Monday’s losses were (mostly) recovered by the close on Friday.
One might be inclined to think we can all get back to ‘normal’.
Normal, like rigged elections, poking the bear (expecting nothing bad to happen), attempted assassinations, fake data, falsifying employment records, more ‘visitors’ flooding in, you know, normal.
However, for anyone paying attention, the charts say we’re at The Danger Point® (not advice, not a recommendation).
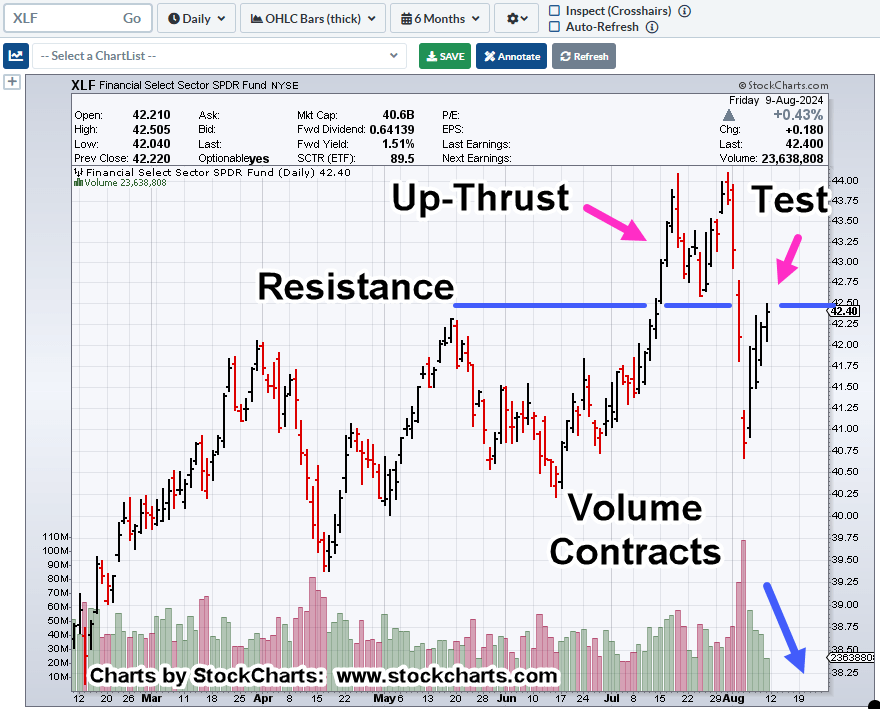
The potential for biotech XBI, has been covered over the past few days (here and here), but we also have another potential set-up; the finance sector, XLF.
We’ll cut to the chase, with the chart.
Finacial Sector, XLF, Daily
It’s important to note: It was four days of retrace (upward) into the test; each day had less volume than the day prior.
Note: Posts on this site are for education purposes only. They provide one firm’s insight on the markets. Not investment advice. See additional disclaimer here.
Note: Posts on this site are for education purposes only. They provide one firm’s insight on the markets. Not investment advice. See additional disclaimer here.
If there was a day to attempt a close of the (August 2nd) gap in biotech (XBI), today was that day.
With the higher open, supposedly from an interest rate policy reversal in Japan, link here and here, there appeared to be plenty of upside momentum for higher prices.
It didn’t happen
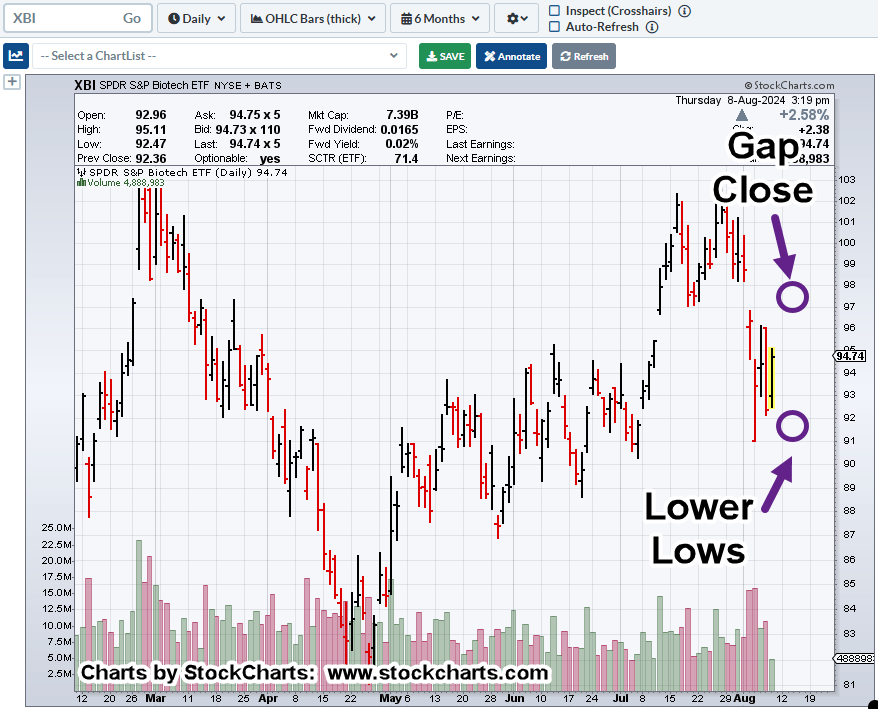
Instead, XBI posted a new daily low, painting that gap as a downside breakaway (not advice, not a recommendation).
As noted in other updates, failed moves are the most telling, getting focused attention from ‘The Street’.
Biotech XBI, Daily
The breakaway is noted.
In addition, trendlines have been updated.
The market could somehow recover and close the gap.
However, with the poor bond auction, pointing to no rate cut or even a rate increase, probabilities suggest more downside for XBI (not advice, not a recommendation).
Note: Posts on this site are for education purposes only. They provide one firm’s insight on the markets. Not investment advice. See additional disclaimer here.
Developing a trading plan that accounts for broker outages, blow-ups, and platform lockups, was presented on this site, as early as December of 2020.
Back then, we had this:
“Built into that [system] approach is recognition there will be market outages, trading halts, communication interruptions and natural disasters.“
“The one thing that may separate this site from others, these (potential) events are taken into account.“
Fast forward to now.
Those events are not ‘potential’ anymore, but a reality.
Note: Before leaving that post, from December 2020, let’s not forget, the dollar reversal (and rally) discussed, is still going, nearly four years later!
That’s what’s meant by ‘a strategic, engineering perspective’ (see About).
Moving on to the topic at hand.
The last update showed potential trendlines in biotech, XBI.
As a result of today’s action, we’re revisiting the post with new information.
Biotech XBI, Weekly
As Dr. Elder said years ago, ‘trendlines are not made of glass’. Trendlines are more like a wire fence; the market can attempt a breakout that may ultimately get negated.
With the weekly XBI, that may be the case.
We’re about one hour before the close, only one day into the trading week; it’s pre-mature to say XBI, will finish the week (or even the day) inside the trendline shown above.
However, if we do end the week lower, it may be a serious bellwether; XBI could be in deep kimchi (not advice, not a recommendation).
Note: Posts on this site are for education purposes only. They provide one firm’s insight on the markets. Not investment advice. See additional disclaimer here.
The daily chart of biotech XBI, may be showing us early signals of a trend as well as trading channel.
Back in the day, when being mentored by David Weis, he would typically start the session by putting up a chart on his computer (with me logged in remotely) and then ask:
“What do you see?”
More importantly, he did not ask, what I ‘thought’ or what the Fed was doing, or any other mainstream form of distraction. No, it was always “What do you see?”
So, we’ll do the same.
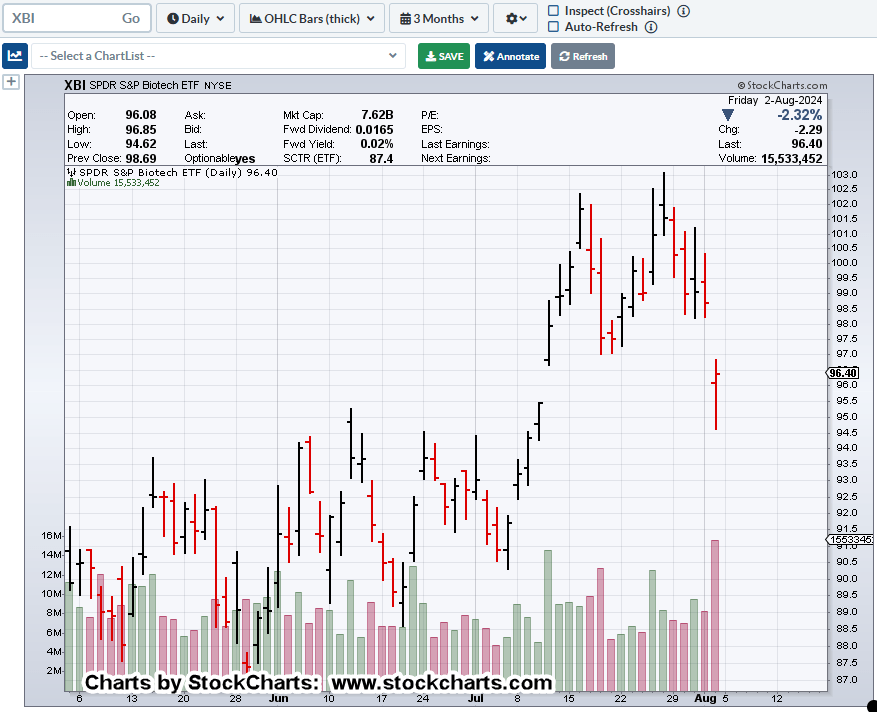
Biotech XBI, Daily
We’re moving in close with the (un-marked) 3-month, daily; what do you see?
Two things should be noticed almost instantly.
Frist: Heavy volume at the last session this past Friday.
Second: Price action (the close) is hanging in ‘mid-air’ with the next support level over two-points away, near 94.0.
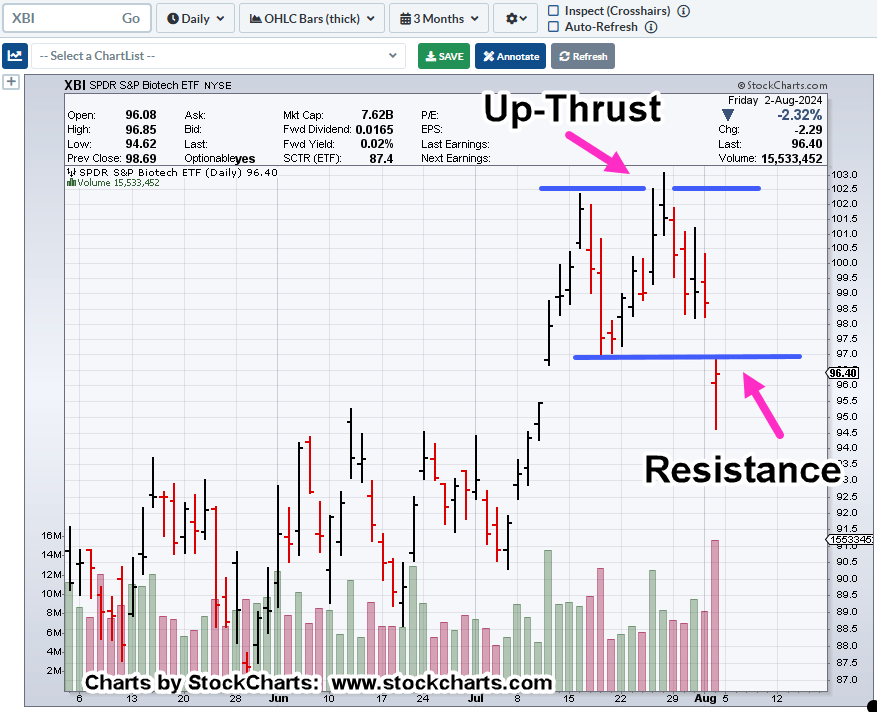
Now, for the marked-up charts.
We’re using the ‘reverse’ trendline technique, presented in the Weis video to determine a potential right side trendline (black dashed line).
Next, we have the Up-Thrust on the daily which is also the right side of the ‘double top,’ shown on the weekly.
Taking both timeframes together, implies a significant inflection point (not advice, not a recommendation).
Anything can happen and the market could recover at the next session.
We’re below support (now resistance) and therefore, technically, in Wyckoff ‘spring’ position.
However, probabilities indicate we’ve had a downside pivot of some significance. That, along with heavy volume at Friday’s session would imply follow through at the next session (not advice, not a recommendation).
Note: Posts on this site are for education purposes only. They provide one firm’s insight on the markets. Not investment advice. See additional disclaimer here.
‘When the tide goes out, that’s when you find out who’s been swimming naked’.
Or, to put it another way:
‘Everybody’s a genius in a bull market’.
Well, ladies and gentlemen, here we are.
We’re about to witness what method’s best suited to handle typical ‘price destruction’ behavior of a bear market (here and here) along with possible chaos in commodities.
That challenge also includes this site of course.
Bear Market Behavior
If we’re really entering a bear market, prices typically do not go straight down unless there’s an outright crash.
No …Bear markets are all about what’s called ‘price destruction’.
That is, price action whipsaws a near infinite number of times; getting into (a short) position for the downside or (long for) an upside squeeze is incredibly difficult.
The most recent example of this was the volatile whipsaws in 3X leveraged inverse fund, SOXS:
Swings over +/- 20%, back-to-back in days if not hours.
With that said, we’re looking at biotech XBI, to see if there’s a chance of it being ‘well-behaved’ during a decline (not advice, not a recommendation).
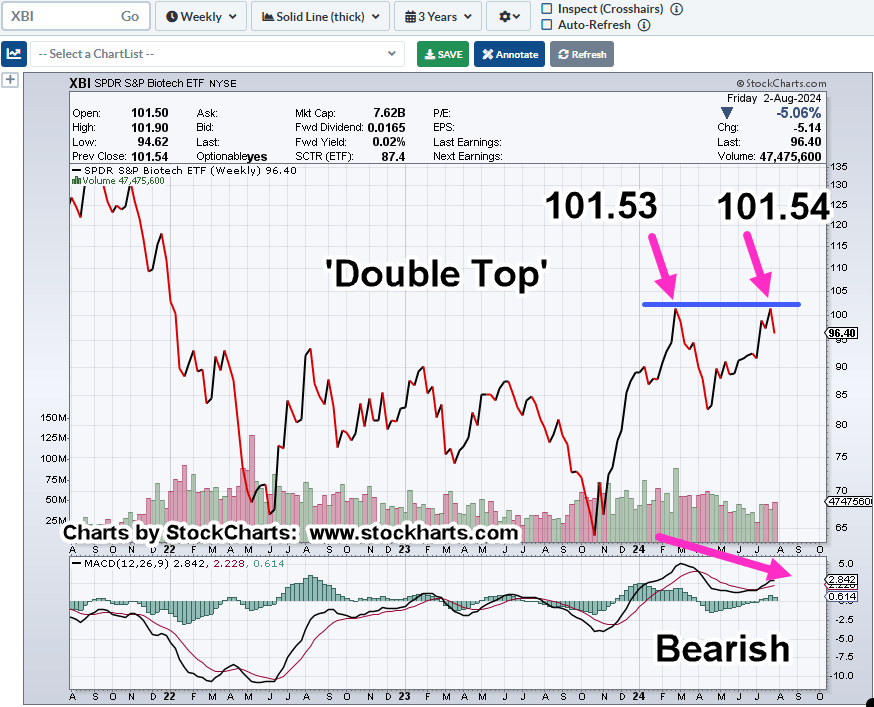
Biotech XBI, Weekly
On a weekly close basis, we’ve had a double top.
Using the MACD, it shows momentum weakened on the leg up to the second top.
Watching price action (the tape) of XBI late Friday, near the close, it gave the appearance of short covering.
Upward spikes that appeared to be labored.
If that’s true, then a lower open at the next session would be the expectation (not advice, not a recommendation).
Taking Action
As the disclaimer states, this site is ‘not certified’ by the SEC and does not, cannot provide any advice.
What it can do, is infer the actions being taken.
With that said, this update shows the ‘category’ side bar with LABD-24-16, thus inferring a short position via LABD.
That’s the firm’s identifier used for spreadsheet tracking; the 16th biotech short via LABD, for the year.
Never Too Early, To Trend
In the next update, we’ll discuss how even in the early stages of (potential) XBI reversal, we may already have a trendline.
Note: Posts on this site are for education purposes only. They provide one firm’s insight on the markets. Not investment advice. See additional disclaimer here.
Insane, delusional valuations, high interest rates, no rate cut.
What could go wrong?
Visitors to this site already knew that ‘something’s up’.
Fully documented well in advance of today, was the A.I. bubble reversal, silver reversal, biotech reversal, and commodities like corn and Nat-Gas continuing their sustained decline.
Now the market hysteria is resulting in the typical knee-jerk, ‘flight to safety’ to the bond market (not advice, not a recommendation).
Surely, with all of that, the Fed will cut rates, right?
For the (potential) answer to that question, let’s look at the bond market.
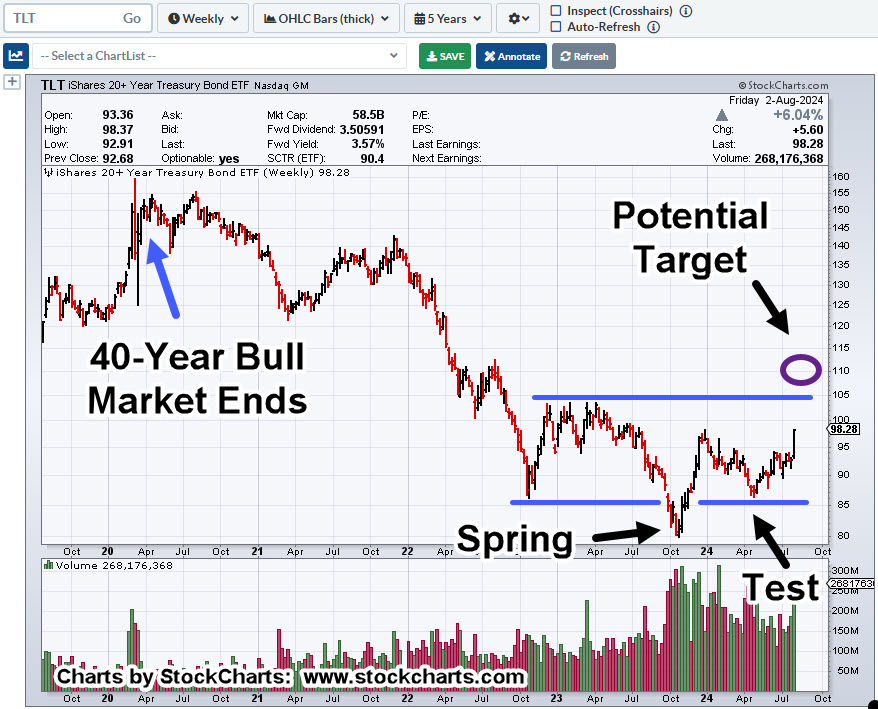
Long Bonds, TLT, Weekly
Already proposed on this site, the Fed does not lead the bond market and interest rates, it follows it (not advice, not a recommendation).
So, what’s this chart telling us?
If the market continues its decline in the coming weeks, TLT price action itself shows a potential for higher bond prices (lower yields).
We’re just over six-weeks away from the next Fed meeting.
Fed Follower?
If the Fed is still a follower, not a leader and if bond (TLT) prices reach the target just as the September meeting is held, then, one would expect a rate cut (not advice, not a recommendation).
Important to note, if TLT gets to the target area, it’s in Wyckoff Up-Thrust (potential reversal) position.
Economic Air-Pocket
If there is a rate cut as a result of the leading action of the bond market and then it reverses to the downside (rates higher), that’s when it would get real interesting.
Correction or crash; we may have to wait until September to find out (not advice, not a recommendation).
Note: Posts on this site are for education purposes only. They provide one firm’s insight on the markets. Not investment advice. See additional disclaimer here.
Question: Who’s going to buy from Carvana, knowing they’re clearing over $7,000 profit on every sale?
The latest earnings release states they’re making Gross Proft per Unit, of $7,049, vs. a more reasonable $529, from just one year ago; that’s over 1,200% increase!
Months ago, after the last CVNA earnings release, the father/son team of CarEdge found the operating numbers to be very curious.
Carvana CVNA, Daily
Price action is at a new high, and hesitating (not advice, not a recommendation).
Volume for the day (thirty minutes before close) has increased.
MACD is posting a bearish divergence and price action appears to be holding right at resistance (blue line).
All of which indicates, we may be at The Danger Point®.
Note: Posts on this site are for education purposes only. They provide one firm’s insight on the markets. Not investment advice. See additional disclaimer here.