Biotech 50% Retrace

Biotech pulls back 50% and the bulls look tired.

Update 12:23 p.m. EST, noted below in red
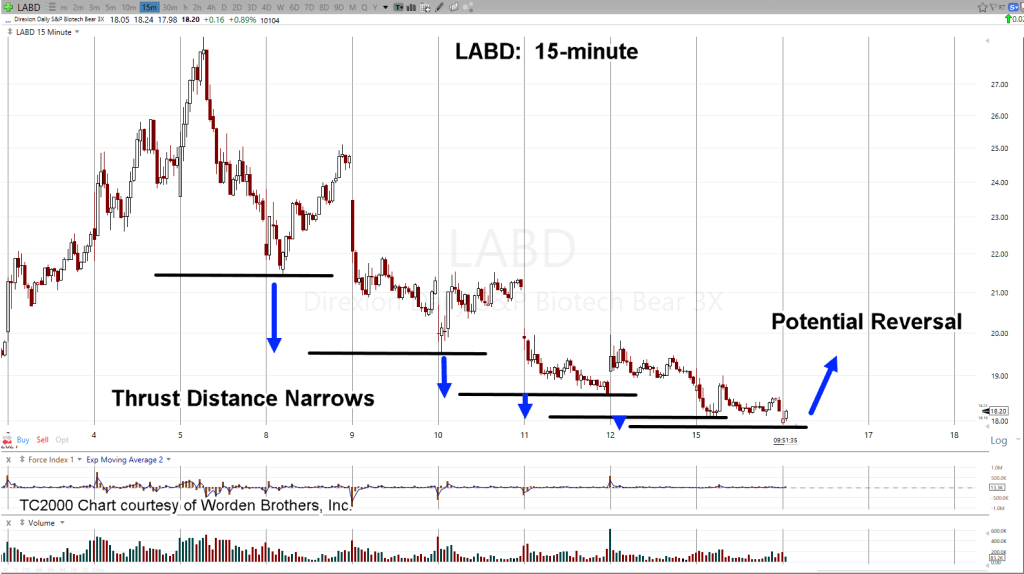
The 15-minute chart of inverse fund LABD shows how successive moves lower (higher for IBB) have covered less distance.

It’s very early in the session and price action at this moment is fighting it out at LABD 18.00, area.

We’ve maintained our short position (not advice, not a recommendation) but have the sense, if there’s not a reversal at this point, IBB could be working up for new all time highs.

This is the danger point.

Current LABD low for the early session is 17.91 … a good place for a stop.

LABD pushed down to 17.80, early in the session before reversing.

It has just passed 18.28, a new hourly high. AMGN to be covered later, at important inflection point (down).

Short position via LABD maintained (not advice, not a recommendation), hard stop at 17.80

With markets at record prices, Fed announcement tomorrow, no more stimulus (likely), forbearance to end, possibility of the ‘speck’ blowing wide open, one gets the sense this may be an important reversal.

Note:  Posts on this site are for education purposes only.  They provide one firm’s insight on the markets.  Not investment advice.  See additional disclaimer here.

S&P 500, Danger Point

Early in the pre-market, SPY is trading unchanged.

Looking at the daily SPY close, we’ve got a tentative breakout just above resistance (black line).

Lower right of the chart shows upward thrust energy has declined significantly … right along with volume.

Yesterday’s update showed longer term momentum (monthly, weekly) for the S&P was pointed up. Continued price action drifting higher is possible.

However, if there’s a reversal in the making, this is a good place to start.

The buyers (volume) have backed off at this level; leaving the SPY hanging just above breakout resistance.

The SOXX, QQQ, and IBB are well off their highs and may be leading the way lower. Our focus remains on shorting biotech IBB, which is the weakest of the three (not advice, not a recommendation)

Charts by StockCharts

Note:  Posts on this site are for education purposes only.  They provide one firm’s insight on the markets.  Not investment advice.  See additional disclaimer here.

High Yield, The Canary

The canary in the coal mine could be High Yield, HYG

Since early last year, this site has been discussing growing parallels of the current market environment to that of August 1987.

Just recently, ZeroHedge began to pick up on the idea as well.

What’s becoming very obvious when looking at 1987, we’re in something much larger; possibly an order of magnitude (or two) larger.

Here’s the latest from Jeramiah Babe. Important time-stamps below:

2:15, Crypto (try it when the power goes out)

3:00, Inflation

3:30, Agricultural prices

3:40, Lumber prices

4:10, Middle Class destruction

5:00, Last longer than Great Depression

7:30, Dramatic shift (never to be the same)

10:00, “We’re in 2021 now. Anything is possible

A quick review of longer term momentum indicators on the major indices (or ETFs), below:

Technology based indices all have significant downside momentum.

The financial press may have pawned this off as ‘rotation’. Of course, that remains to be seen.

Our view, high yield tells us something much larger than a sector rotation’s occurring.

It’s possible, the most debt (interest rate) sensitive indices are reversing first which could be a sustained, long term reversal.

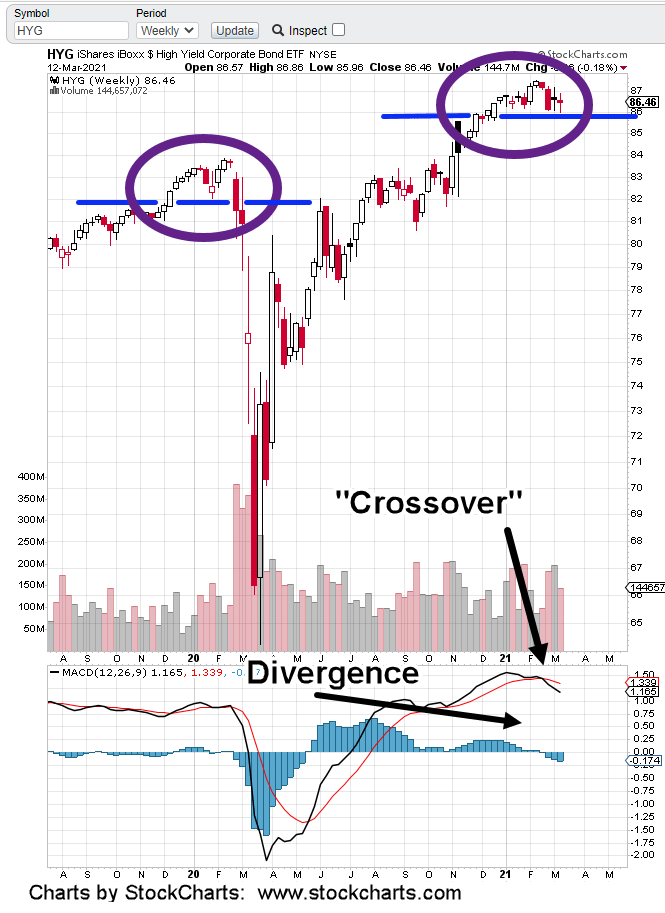
The HYG weekly chart pattern is similar to the prior reversal (magenta ovals). This time however, MACD has spent over nine-months in a divergence and has crossed to the downside.

There could be a new high … low probability but it could happen (after all, it’s at support). If it does, weekly MACD may post an even larger divergence.

In response to the HYG reversal, we’re watching (and are short) the biotech sector, IBB (not advice, not a recommendation)

Of the three noted above with negative momentum, IBB is the weakest. Last Friday’s action has tentatively confirmed the resistance areas and trading channel reviewed in this update.

Friday’s IBB lower action was nearly imperceptible but it was there. Major reversals can happen this way … a little at first.

Wyckoff said it in 1910, ‘It’s as if the weight of a feather can determine the next direction’.

We’ll see if there’s follow-through to the downside on Monday.

Stay Tuned

Charts by StockCharts

Note:  Posts on this site are for education purposes only.  They provide one firm’s insight on the markets.  Not investment advice.  See additional disclaimer here.

Gold To Rally ~ $1,660

If that happens, expect the usual suspects to ‘Go Postal’ on the hyperinflation narrative.

Johnny Bravo put it best when he said (to the effect) months ago:

We’re going to get hyperinflation. The question is “When?”

Looking at it a different way and in ‘Oligarch speak’.

The time for hyperinflation, is when the proletariat have exhausted their supplies of precious metals … most likely using it to buy food.

An engineered famine is being constructed; in process, as we speak.

Judging from comments on the financial sites, the public still thinks food prices are rising because of inflation.

There are exceptions (thankfully) like the comment area on ZeroHedge articles. Those few but growing number, understand exactly what’s happening.

So, what’s all of this got to do with the price of gold?

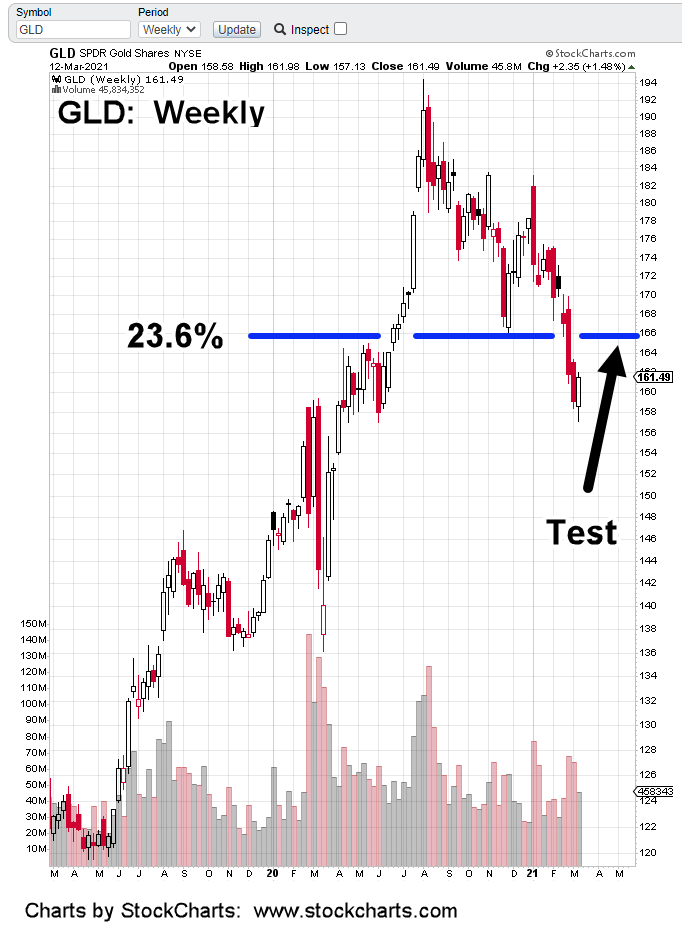
It’s perfectly natural and maybe expected that gold, GLD, after breaking support will rally back to test the 166 (~ $1,660) area.

Just like the incessant narrative on “The Speck“, which is drilled into the collective consciousness day after day (except maybe in South Dakota and Texas) so too, is the hyperinflation Weimar Republic narrative.

A Black Swan (as explained by Nassim Taleb) is a major unexpected event.

The flip side, a Black Swan is also a major expected event, that does not happen. That second definition is not commonly discussed.

What if hyperinflation never happens? What if there’s some kind of ‘transition’ before it has a chance to take hold?

If GLD tests 166, and reverses, downside targets are now 133 and then even lower at 110.

If that happens, there could be a market crash to go along with it.

With margin debt levels the highest in history, most if not all participants will be wiped out long before gold at $1,100 (or lower).

Silver and gold at fire sale levels and the public will be on the other side of the fence, turning in their precious metals hoard in exchange for worthless fiat dollars … just to survive.

It’s an oligarch’s dream come true.

Stay Tuned

Charts by StockCharts

Note:  Posts on this site are for education purposes only.  They provide one firm’s insight on the markets.  Not investment advice.  See additional disclaimer here.
Closing At Confluence: Biotech

On a closing basis, biotech’s hit three areas of resistance.

We’ll put all the lines up at one time (chart above) and then break it down.

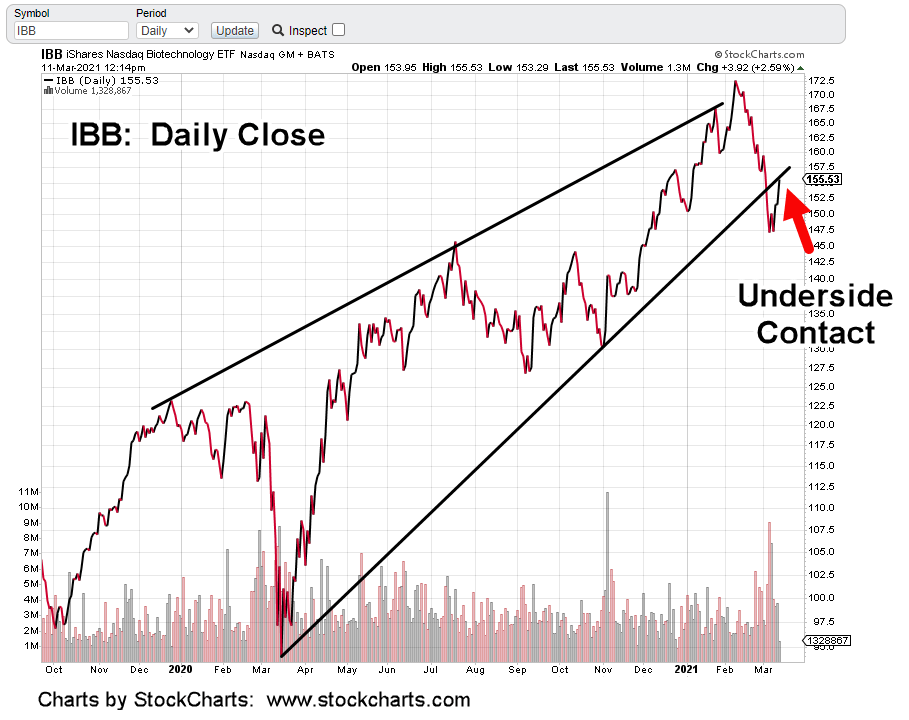
First, there’s the underside of the trend break that’s already been discussed in prior updates.

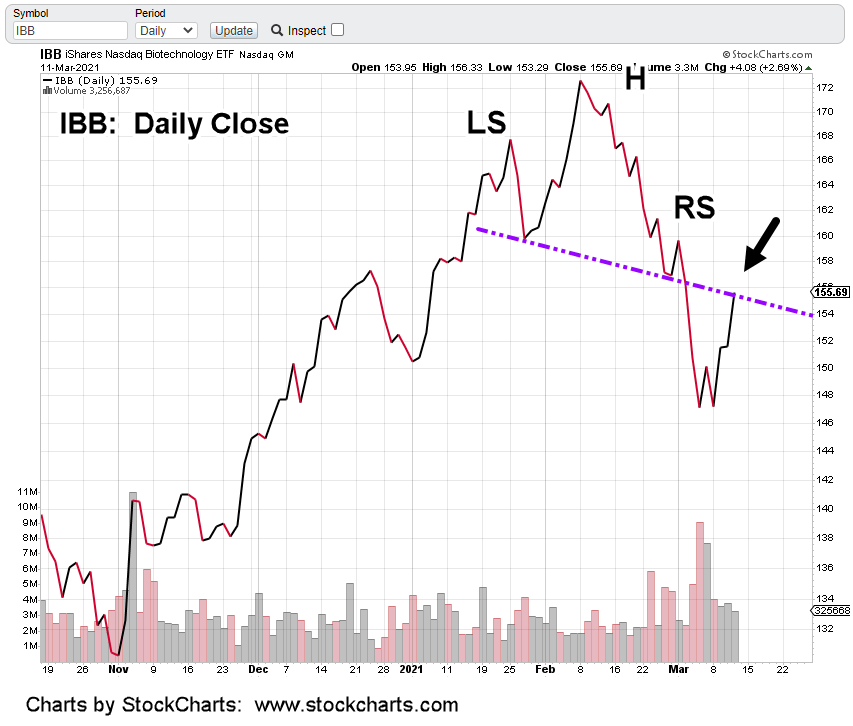
Second, the resistance formed by the underside of the head and shoulders pattern identified in a prior update as well.

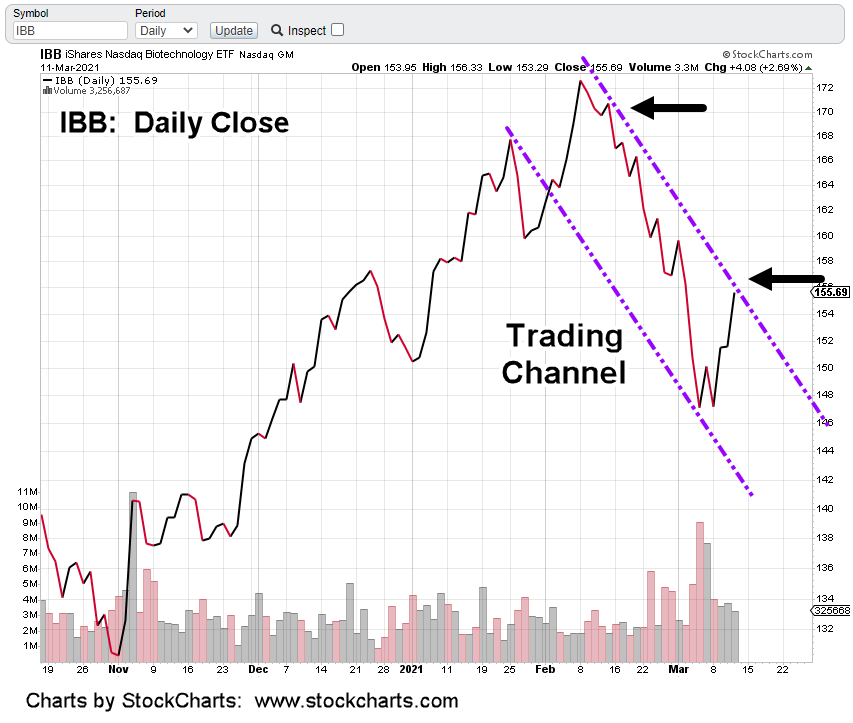
Last, we could have a trading channel in effect. If so, price action contacted and closed at the right side in yesterday’s session.

The following charts get a closer look at two resistance areas:

Using a ‘reverse trendline’ technique outlined by Weis in his DVD, we take contact on the left side and move it to the right.

The chart below shows the H&S resistance area (underside) contact:

Putting all lines together gets us the chart at the top of this post.

Long term MACD indicators are down; both monthly and weekly. Momentum is to the downside.

Probabilities favor a reversal

The potential downside is enormous. The markets are extended the most in history. Margin debt the most in history.

We’ve got kids running around with trading apps designed to make it look like a game. It’s no different from the Shoe Shine Boy at the steps of Wall St., giving out tips.

Positioning:

We’re short biotech via LABD (not advice, not a recommendation).

The highly leveraged inverse ETF, performs best when the direction of IBB is down in a steady and decisive move.

Otherwise as we saw near the close yesterday, IBB could be reversing to the downside while LABD is still eroding lower in value.

Inverse fund BIS does much better in this area but is not nearly as liquid. That makes pre and post market trades impossible.

We’ll be looking for IBB to post a new daily low as confirmation a reversal is underway.

Stay Tuned

Charts by StockCharts

Note:  Posts on this site are for education purposes only.  They provide one firm’s insight on the markets.  Not investment advice.  See additional disclaimer here.
Biotech Update

IBB price action pushed through our stops and contacted the underside trend line. This morning’s update indicated that possibility.

In response, LABD position has been re-opened.

IBB price action has been hovering about this level for about two hours. It may have stalled; indicating potential reversal.

Obviously, this type of positioning is not for everyone. Understandable.

However, the markets themselves are dictating the appropriate action.

Positioning (not advice, not a recommendation)

LABD, Entry 1, @ 18.94

LABD Entry 2 @ 19.23.

Stop: A bit below the session low at approx: 18.60 – 18.90

Charts by StockCharts

Note:  Posts on this site are for education purposes only.  They provide one firm’s insight on the markets.  Not investment advice.  See additional disclaimer here.

Biotech Breakdown

Biotech ETF, IBB looks ready to complete its breakout test and reverse to much lower levels.

There’s a lot going on in this sector.

At this juncture, IBB appears to be the overall downside leader.

The link to this video is the first of its kind. There’ll be more to follow.

Judging from the comments section of ZeroHedge, looks like everyone’s pretty much awake at this point.

Just in case, here are 25-quesitons that can be posed to those still asleep.

Pay special attention to Question No. 11. & No. 12.

At some point you would think it’s all going to bust wide open.

Moving on to the chart:

IBB’s been in a terminating wedge for over a year. There was a ‘throw-over’ in February. Next, was downside penetration of the lower boundary. Now, we’re in a test.

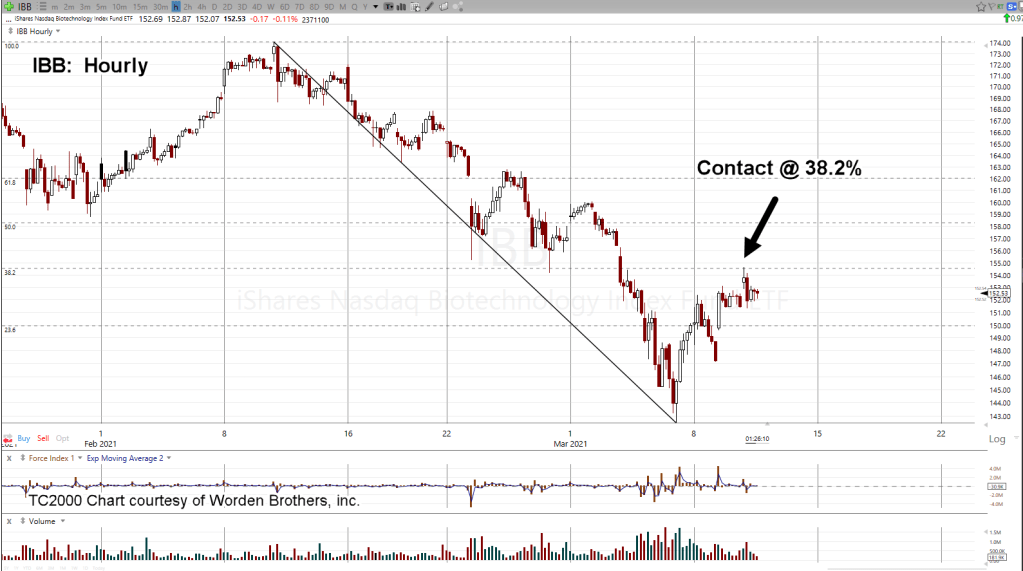
That test can still go higher to contact the boundary underside. However, as posted yesterday, we’re already positioned short (not advice, not a recommendation) at the 38.2%, contact and rejection.

From a fundamental perspective, all the good news is out. Probably the last of any ‘stimulus’ will be figuratively mailed out by the end of the month.

Bonds look to be forming a bottom and the dollar as well.

Even so, the higher interest rates are already having an effect as home buyers are backing off. Lumber prices remain at insane levels.

Positioning:

Last session, the firm’s accounts went short biotech. Pre-market action in LABD shows a slightly lower open (higher for IBB).

The stops for both BIS and LABD have been provided in the last update. Be aware, the stop is loosely based on the tracking fund IBB.

If IBB posts a high above 154.60, its likely to attempt a 50% retrace.

One caveat:

There’s probably an accumulation of short stops (like ours) at the 154.60, high.

If there are enough, the market will automatically go one, or two ticks higher (154.62), to clear them out.

We’ll watch for that and adjust our stops accordingly. If this happens, it’s likely to be within the first 90-minutes of trade.

Charts by StockCharts

Note:  Posts on this site are for education purposes only.  They provide one firm’s insight on the markets.  Not investment advice.  See additional disclaimer here.
Biotech (IBB) Action Like AMT

In price action very similar to AMT before its reversal, IBB looks ready to move decisively lower. Early session hit 38.2% retrace and now, test action (higher) looks weak.

Markets are fractal. Price action repeats itself at various time-frames.

Expectation is that IBB will continue lower from here just as was the case with AMT.

The difference is, since we’re dealing with an hourly time frame instead of daily, price action is faster.

All accounts have been cleared of positions except for being short biotech.

Positions are as follows (not advice, not a recommendation):

LABD: Entry, 19.976, Stop 19.52

BIS: Entry 22.32, Stop 21.75

There are a number of problems for biotech hovering the background that could blow the lid off the ‘planned event’ of the past year.

More information to be provided in a subsequent update

Note:  Posts on this site are for education purposes only.  They provide one firm’s insight on the markets.  Not investment advice.  See additional disclaimer here.
Real Estate Channel

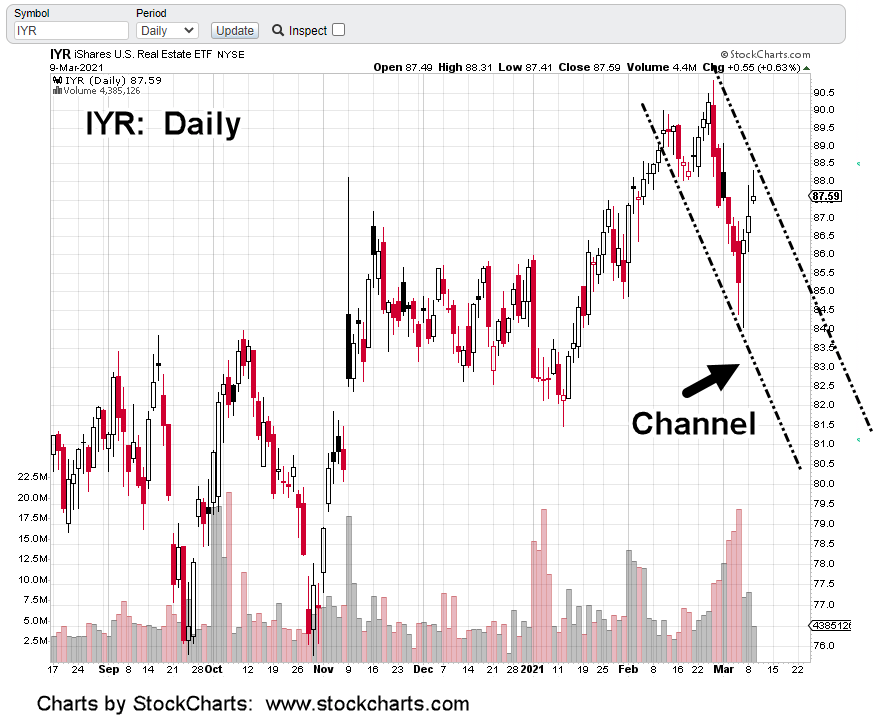
Yesterday, real estate IYR, may have formed a trading channel.

Update: 1:17p.m. EST. IYR has pushed past the channel. Short position via DRV exited (for now).

A new daily low (today) within channel boundaries would help to confirm.

If so, then stops for the long standing short position (via DRV) will follow down the outside right channel line.

Charts by StockCharts

Note:  Posts on this site are for education purposes only.  They provide one firm’s insight on the markets.  Not investment advice.  See additional disclaimer here.
Off With Their Heads

Head & Shoulders patterns are showing up in several markets.

First, there’s biotech IBB … and now the SOXX.

The SOXX is higher in pre-market around +2.5% , +2.70%, near 385.25.

Conversely, inverse SOXS is down -9% to -10% near the 14.00 -area.

Today could be the day where risk is minimized to position short via inverse SOXS (not advice, not a recommendation).

If SOXX remains below yesterday’s high of 397.71, it has set itself up to break the neckline. Once that’s completed, we’d then have a measured move lower to around 320.

If short via SOXS, the stop would theoretically be yesterday’s low of 13.21.

We all know however, inverse funds and especially the 3X versions, have significant negative erosion.

If during the regular session, SOXX price action persists throughout the day near yesterday’s high (397.71), inverse SOXS will continue to erode below its own prior daily low.

A different view is the Right Shoulder has not been completed. We’ll know that if SOXX makes a new daily high.

It’s a myriad of scenarios and the professional understands there’re an infinite number of outcomes. However, at times, risk is reduced enough to take a position on a probable direction.

At this juncture and given the above conditions, the most probable direction is down.

One last caveat.

SOXX has broken below well established support. That puts it in Wyckoff spring position. The market will automatically attempt to rally as we see in the pre-market.

Based on the conditions described, we’re expecting that spring attempt (to new all time highs) to fail.

Charts by StockCharts

Note:  Posts on this site are for education purposes only.  They provide one firm’s insight on the markets.  Not investment advice.  See additional disclaimer here.