First, The SOXX Housekeeping

Biotech Sector SPBIO ($SPSIBI) has got itself into a Wyckoff Up-Thrust (reversal) condition but first, we’ll update the SOXS trade.
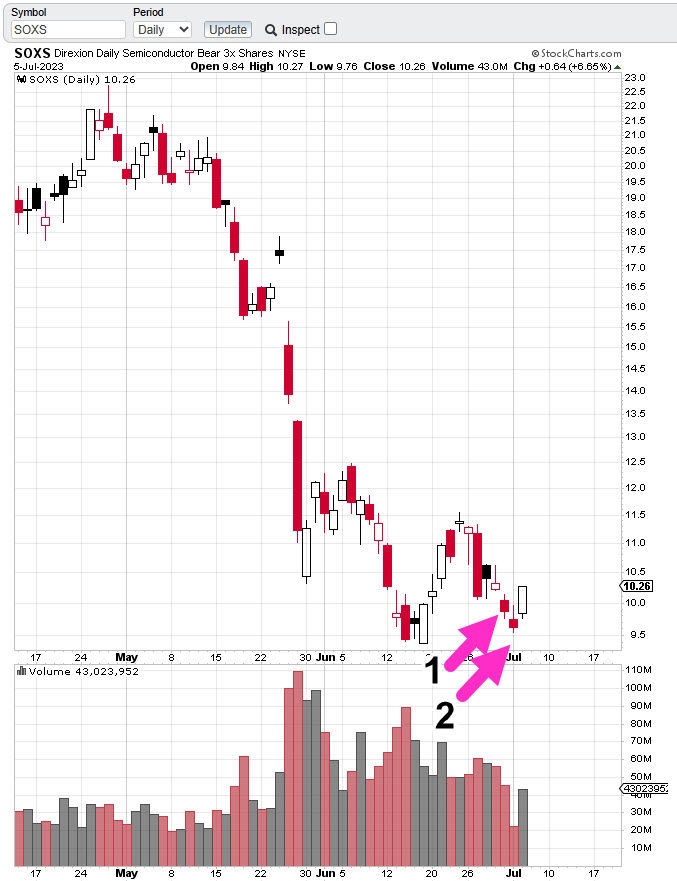
A discretionary exit was made during this session at SOXS 10.10, for just over 1% profit (not advice, not a recommendation).
The trade was in the green and not going to be allowed to go red … a simple, but difficult to execute, trading rule.
We’re still in a bubble. That has not changed. So, it’s being watched closely.
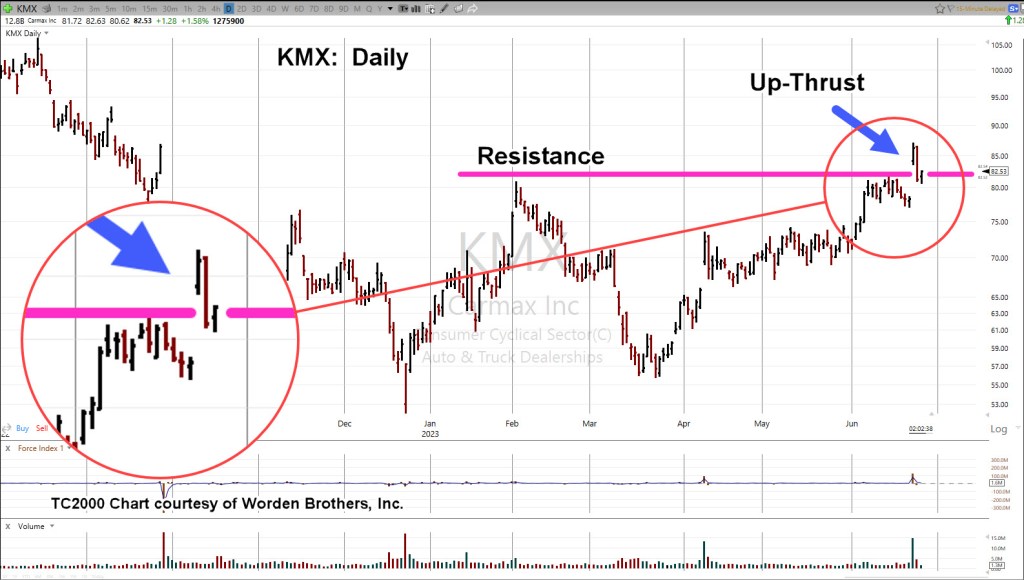
Meanwhile, biotech SPBIO ($SPSIBI) reversed on June 14th and has been edging lower ever since. Today, we have what looks to be an up-thrust condition.
Price action has penetrated previous resistance and stalled (thus far).
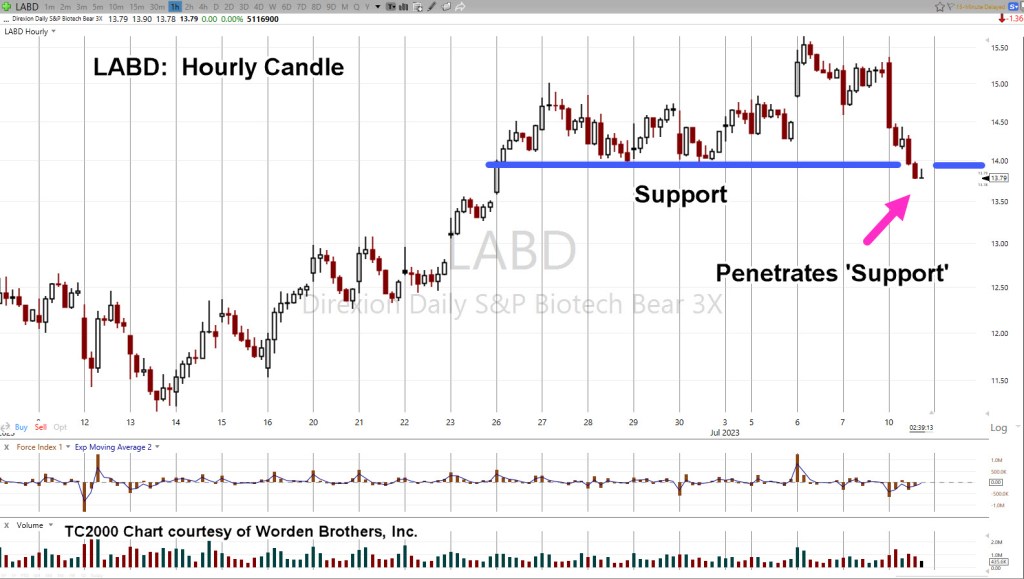
Since our interest is to short the sector, we’ll go straight to the leveraged inverse fund LABD.
Biotech SPBIO, Leveraged Inverse LABD, Hourly
With about an hour before the close, price action’s penetrated support and has slowed significantly.
Positioning:
LABD entry @ 13.8766; Soft-Stop and Hard-Stop might be at the lows for the day (not advice, not a recommendation). More on that, later.
Fundamentals
The drivers for potential downside continue to grow.
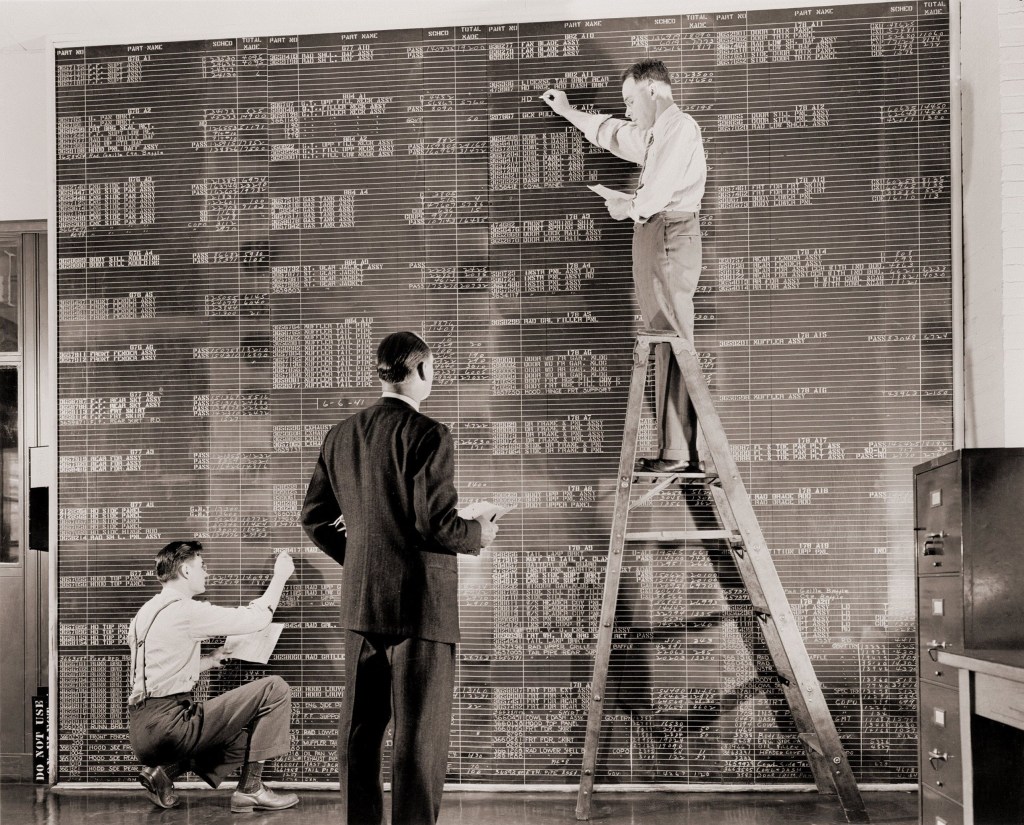
Scenes like this have now entrenched themselves into the public arena.
As stated, many times (in the opinion of this author), these events are the primary driving force for all market activity on a go forward basis.
Stay Tuned
Charts by StockCharts
Note: Posts on this site are for education purposes only. They provide one firm’s insight on the markets. Not investment advice. See additional disclaimer here.
The Danger Point®, trade mark: No. 6,505,279