Position Change

DRV pushed through our stop early in the session; position closed (not advice, not a recommendation).

1:50 p.m. EST:

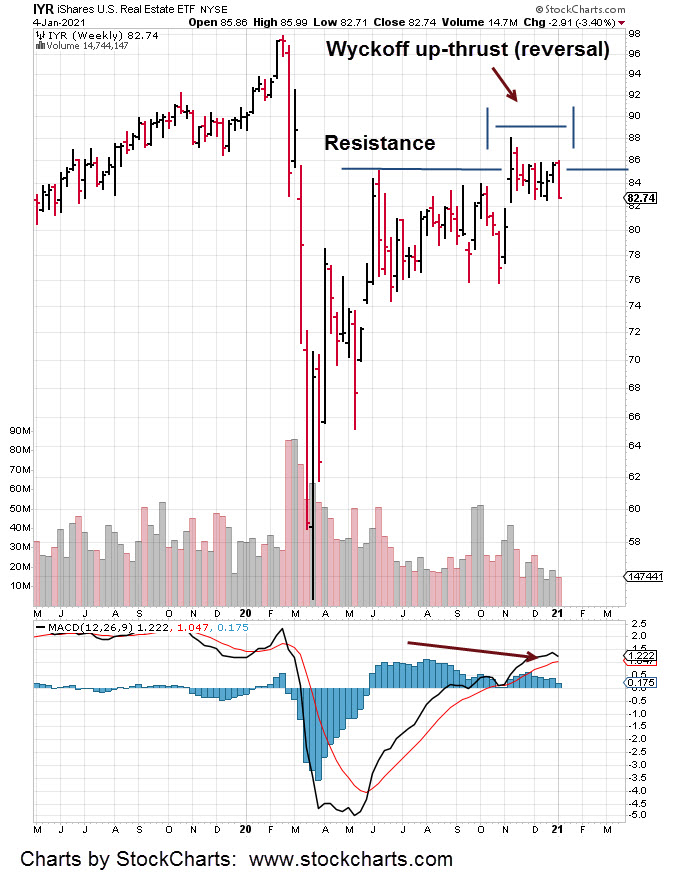
Despite all the analysis, IYR is showing continued buoyancy.

Something else is going on; possibly related to Uneducated Economist’s link provided in the last update.

Taking his cue, a functioning mortgage market is all important to the financial narrative, it’s possible this market will be more heavily manipulated than others.

At this juncture it would make sense. All indications are for reversal … yet it’s not happening in any significant way.

Time for another trade.

We’re going back to a market that in retrospect, should’ve been the focus all along; Biotech.

This site’s coming from the perspective those reading, are well aware the ‘speck’ as we call it (to avoid censorship) was a fabricated event.

Just a reminder that we’re not some ‘Johnny come lately’, here’s the link from way back in May, last year.

That post proves the situation was figured out well before the May 17th publish date (interviews, observations conducted a month prior).

What’s not fabricated however, are the repercussions from the so-called cure for the speck.

Unfortunately, those are happening now and are quite real.

Moving on to the trade.

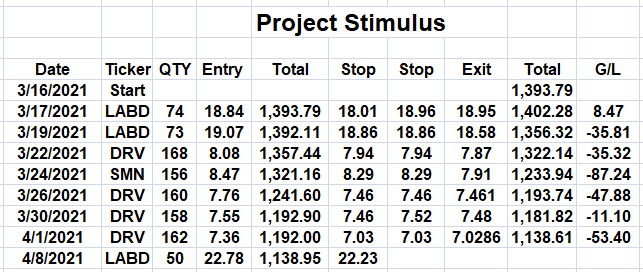
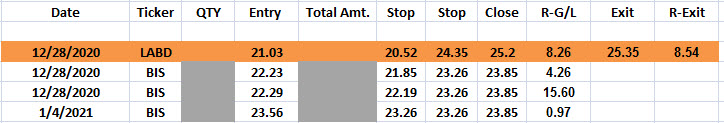
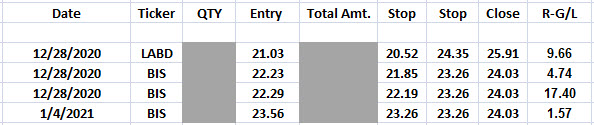
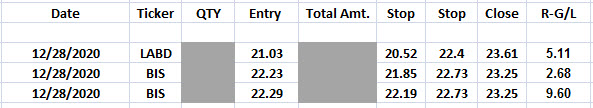
Despite the number of transactions shown in the Project Stimulus table (below), the objective is to minimize activity. We’re looking for a mid, to long term sustainable move; gain potential, 100% to 1,000%.

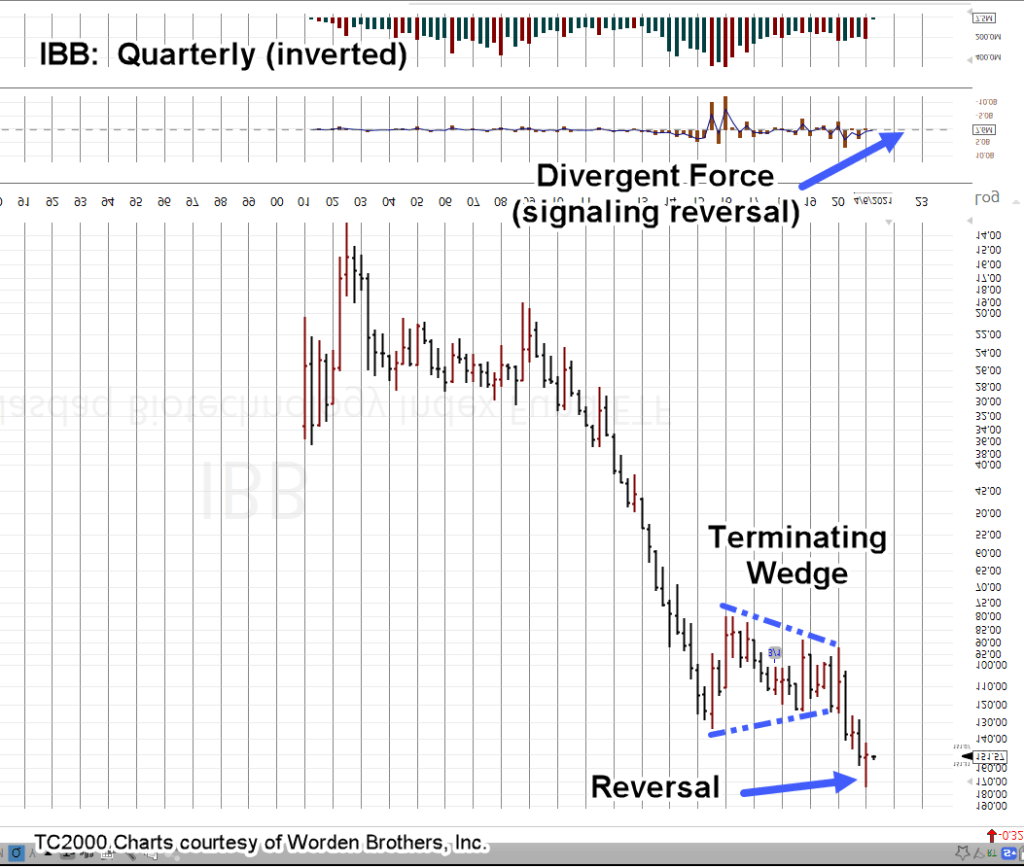
Updated previously, very long term (Quarterly) IBB has reversed.

Monthly and weekly have reversed as well; both the monthly and weekly MACD indicators point down. Daily is essentially flat.

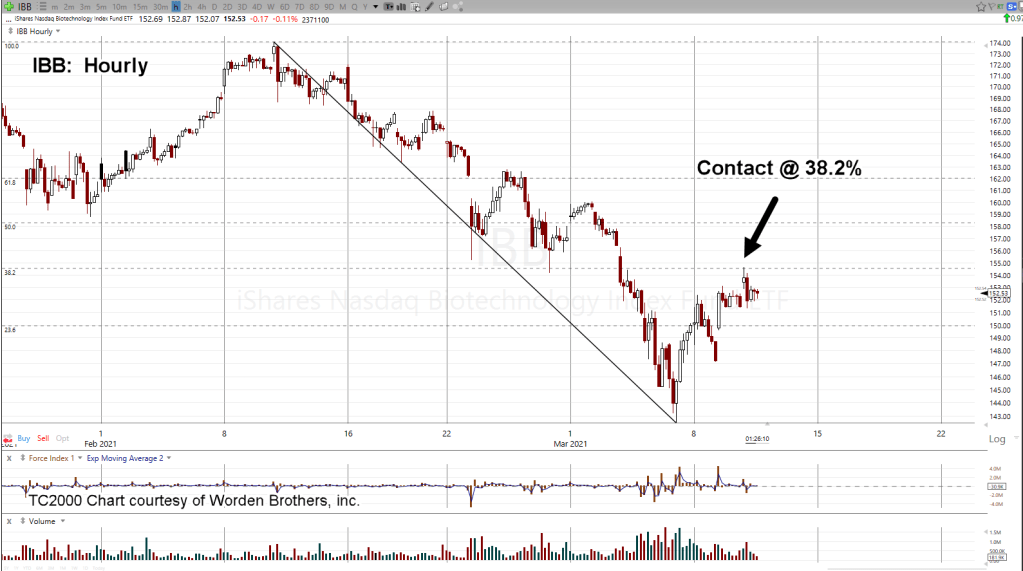
The hourly chart of LABD (3X inverse IBB) shows the entry location and subsequent price action. Stop is the session low @ 22.23 (not advice, not a recommendation).

It’s worth repeating, the false narrative on the speck and consequences of speck protection may blow up in the media (and biotech) at any time.

As J.P. says, getting people to do something they know is bad for them (or lethal) is the ultimate ‘elite’ high.

Note:  Posts on this site are for education purposes only.  They provide one firm’s insight on the markets.  Not investment advice.  See additional disclaimer here.

Something Different, Biotech

A long term (Quarterly) view of biotech, IBB

The inverted chart puts it into perspective. Biotech has already reversed.

It would seem fitting as truth is hard to put down forever.

One can only hope the whole fake ‘speck’ narrative will be blown wide open … taking the entire sector down with it.

It may already be happening but in such slow (long term) motion that we’re not noticing it.

Note:  Posts on this site are for education purposes only.  They provide one firm’s insight on the markets.  Not investment advice.  See additional disclaimer here.

Biotech Breakdown

Biotech ETF, IBB looks ready to complete its breakout test and reverse to much lower levels.

There’s a lot going on in this sector.

At this juncture, IBB appears to be the overall downside leader.

The link to this video is the first of its kind. There’ll be more to follow.

Judging from the comments section of ZeroHedge, looks like everyone’s pretty much awake at this point.

Just in case, here are 25-quesitons that can be posed to those still asleep.

Pay special attention to Question No. 11. & No. 12.

At some point you would think it’s all going to bust wide open.

Moving on to the chart:

IBB’s been in a terminating wedge for over a year. There was a ‘throw-over’ in February. Next, was downside penetration of the lower boundary. Now, we’re in a test.

That test can still go higher to contact the boundary underside. However, as posted yesterday, we’re already positioned short (not advice, not a recommendation) at the 38.2%, contact and rejection.

From a fundamental perspective, all the good news is out. Probably the last of any ‘stimulus’ will be figuratively mailed out by the end of the month.

Bonds look to be forming a bottom and the dollar as well.

Even so, the higher interest rates are already having an effect as home buyers are backing off. Lumber prices remain at insane levels.

Positioning:

Last session, the firm’s accounts went short biotech. Pre-market action in LABD shows a slightly lower open (higher for IBB).

The stops for both BIS and LABD have been provided in the last update. Be aware, the stop is loosely based on the tracking fund IBB.

If IBB posts a high above 154.60, its likely to attempt a 50% retrace.

One caveat:

There’s probably an accumulation of short stops (like ours) at the 154.60, high.

If there are enough, the market will automatically go one, or two ticks higher (154.62), to clear them out.

We’ll watch for that and adjust our stops accordingly. If this happens, it’s likely to be within the first 90-minutes of trade.

Charts by StockCharts

Note:  Posts on this site are for education purposes only.  They provide one firm’s insight on the markets.  Not investment advice.  See additional disclaimer here.

Biotech (IBB) Action Like AMT

In price action very similar to AMT before its reversal, IBB looks ready to move decisively lower. Early session hit 38.2% retrace and now, test action (higher) looks weak.

Markets are fractal. Price action repeats itself at various time-frames.

Expectation is that IBB will continue lower from here just as was the case with AMT.

The difference is, since we’re dealing with an hourly time frame instead of daily, price action is faster.

All accounts have been cleared of positions except for being short biotech.

Positions are as follows (not advice, not a recommendation):

LABD: Entry, 19.976, Stop 19.52

BIS: Entry 22.32, Stop 21.75

There are a number of problems for biotech hovering the background that could blow the lid off the ‘planned event’ of the past year.

More information to be provided in a subsequent update

Note:  Posts on this site are for education purposes only.  They provide one firm’s insight on the markets.  Not investment advice.  See additional disclaimer here.

Real Estate, Ready?

The real estate index IYR has been struggleing at resistance for months.  Yesterday’s action was a swift break lower to the bottom of the range.

Inverse fund DRV (3X inverse IYR) had is largest single day gain since mid-May of last year.

The weekly chart shows the four-month struggle at resistance as well as MACD bearish divergence.

IYR may attempt to test slightly higher (DRV down) during this session.

If so, we’ll be looking to position short via DRV; not advice not a recommendation.

Moving on to biotech.  Yesterday’s action was a good example of negative bias in LABD.  Even though IBB closed lower, LABD closed lower as well.

The LABD position was closed out as shown (above) and the BIS positions maintained.

Note the R-Exit value.

This represents the gain on the amount risked. If $1,000 was risked on the trade, it returned $8,540.

Update will be forthcoming if/when a DRV position is established.

Charts by StockCharts

Note:  Posts on this site are for education purposes only.  They provide one firm’s insight on the markets.  Not investment advice.  See additional disclaimer here.

Dow, S&P, Outside Down

So, this is it?

As this juncture (11:06 a.m. EST), both the Dow and S&P have key reversals; and now the QQQs, and Russell 2000, have just joined them.

If they hold and decline from here, reversing from all time highs, we can add that data to our empirical “Holiday Turns

Holiday turns … markets tend to reverse just before, during, or just after a holiday week.

In the biotech arena, this morning’s gap higher (IBB) closed the distance from price action to the stop for inverse funds BIS and LABD.

That closure opportunity was used to increase the short position (via BIS) in one of the managed accounts.  Not advice, not a recommendation.

The IBB bearish divergence is beginning to take shape.

Positions:

Note: “Close” prices as of 11:03 a.m. EST

Charts by StockCharts

Note:  Posts on this site are for education purposes only.  They provide one firm’s insight on the markets.  Not investment advice.  See additional disclaimer here.

Corn Goes Vertical

Ever since the inland hurricane, the ‘Derecho’ of August 10th, it’s never been the same for corn.

Now, it’s going vertical.

The entire U.S. agricultural food supply infrastructure is being systematically dismantled.  Control the food, control the population. Simple.

It seems the ‘preppers’ tend to focus on stockpiling silver and gold.

If your’re getting ready for what’s coming, from a historical perspective, that’s not the place to start.

Going way back …. thousands of years, during the famine in Egypt of Joseph’s time, we have this:

“And Joseph gathered corn as the sand of the sea, very much, until he left numbering; for it was without number”

“And the famine was over all the face of the Earth: and Joseph opened all the storehouses and sold unto the Egyptians: and the famine waxed sore in the land of Egypt.”

“And all countries came unto Joseph for to buy corn; because that the famine was so sore in all lands.”

Gen 41:  Vs.  49, 56, 57, KJV

They paid for the corn first, with gold and silver.  Then they paid with their livestock.  Then they paid by selling themselves into life-long slavery. We can equate that last part (slavery) as getting the vax.

As corn is going vertical, the bond market is signaling its move as well.

Just now, today, TLT is rotating higher.

Yesterday, Steven Van Metre showed a chart (time stamp 10:00) of the speculators beginning to back off their historic short position.

They’ve figured out they’re trapped. Now, they’re trying to sneak out the door without being completely impaled on a sharp bond spike.

The S&P, Dow, NASDAQ, Russell 2000, all appear to be holding near their highs.

Biotech (IBB), as reported yesterday, is different.

Something major is brewing below the surface with the biotech deception.  Price action itself is showing it’s the place to be for the short-side.

Further info on biotech’s downside is here and here.

Positions remain unchanged (as of 3:02 p.m. EST).  Stops have been moved; not advice, not a recommendation.

Charts by StockCharts

Note:  Posts on this site are for education purposes only.  They provide one firm’s insight on the markets.  Not investment advice.  See additional disclaimer here.

Class Action

Markets press on, new highs. However, biotech (IBB) is losing luster.

It could be just a temporary blip on the road upward.

Or, there could be something else afoot not known to the general public … and possibly not even known to professional speculators and market traders.

The video link below is to an alternate (independent) platform. One among many popping up in response to ‘adjustments’ being made by YouTube.

The video at this link is nearly an hour long.  It’s one of those things that upon viewing the entire presentation, one can never be the same.

 Viewer beware.  For those with short attentions, fast forward to Time Stamp 22:50, for the meat.

Wyckoff stated a century ago ‘the reason for a move is always revealed after the fact’; we might find if IBB reverses from here and does not look back, the link above may ultimately become the ‘reason’ for such a move.

Imagine if this presentation becomes widespread knowledge … where will biotech be then?

Of course, price action is always the final arbiter.  Positions (and stops) remain unchanged.

Note:  Posts on this site are for education purposes only.  They provide one firm’s insight on the markets.  Not investment advice.  See additional disclaimer here.

Crowded Trades

Gold miner (GDX) bulls and bears have been fighting in a crowded trade since late November.

This morning’s GDX retrace up (and now down) from yesterday is a case in point. 

In such a choppy environment, inverse funds lose market value (downside bias) quickly and trades need to be avoided.

Meanwhile, on the other side of the market, biotech (IBB) has formed a top, reversed, and posted a new weekly low today.

An hourly trend-line has been formed as well (not shown). 

If it holds as (or if) IBB declines past current support (~152 area), that hourly trend is moving lower at just over -96%, annualized.

Maintaining negative trend, with declining momentum on both daily and weekly timeframes is what we’re looking for.

The objective (not advice, not a recommendation) is to move stops (shown below) and maintain the trade until stopped out or trend break.

As of this post (1:03 p.m. EST), the current price of LABD and BIS are listed in the ‘Close’ column. 

The “R-G/L” is from Dr. Van Tharp’s concept of Risk Gain/Loss.

Example:  If $1,000 of capital was “risked” (entry-to-stop) on the LABD, position, that position is now up by 6.83-R, or $6,830.

Charts by StockCharts

Note:  Posts on this site are for education purposes only.  They provide one firm’s insight on the markets.  Not investment advice.  See additional disclaimer here.