We’ve got the daily chart of LABD, leveraged inverse fund Biotech, SPBIO, above.
Next, we highlight the tight price action and note the failed push lower:
Scroll up and down between the two charts and you can see, this is an area where the market has firmed-up.
Tight action is usually (not always) a pre-cursor of an upcoming move. One side is taking control; about to take the market their direction.
Note: The last two days (including today) show a pivot of sorts … still very young.
Positioning:
The tight stop on the DRV position was hit early in the session. Exit was performed at DRV 4.4336 (not advice, not a recommendation).
That freed-up capital was then allocated to a position in LABD (again, not advice, not a recommendation).
The stop is tight at LABD 18.79.
Stay Tuned
Note: Posts on this site are for education purposes only. They provide one firm’s insight on the markets. Not investment advice. See additional disclaimer here.
As is typical of Fed announcements, the market tends to go one way before the speech … then, the opposite way after the speech.
As real estate (IYR) pushed higher before the speech, it got just a little too far upward for comfort. The short position was closed out for one managed account.
As time progressed, price action was clearly setting up a spring condition; seen in the 30-minute leveraged inverse fund DRV, above.
The Project Stimulus Account closed its TZA position (for profit, table to follow) and the account then positioned long DRV, at about 4.49 (not advice, not a recommendation).
The stop is tight … the low of the day @ 4.42 (not advice, not a recommendation)
We’ll see what happens next
Stay Tuned
Note: Posts on this site are for education purposes only. They provide one firm’s insight on the markets. Not investment advice. See additional disclaimer here.
If there’s a major volcanic eruption (Level VEI 5), the entire world dynamic will be changed instantly.
Not saying the La Palma eruption is another Black Swan … no, just that volcanic activity is picking up world wide and needs to be included in any ‘unforeseen’ event situation.
Real Estate (IYR)
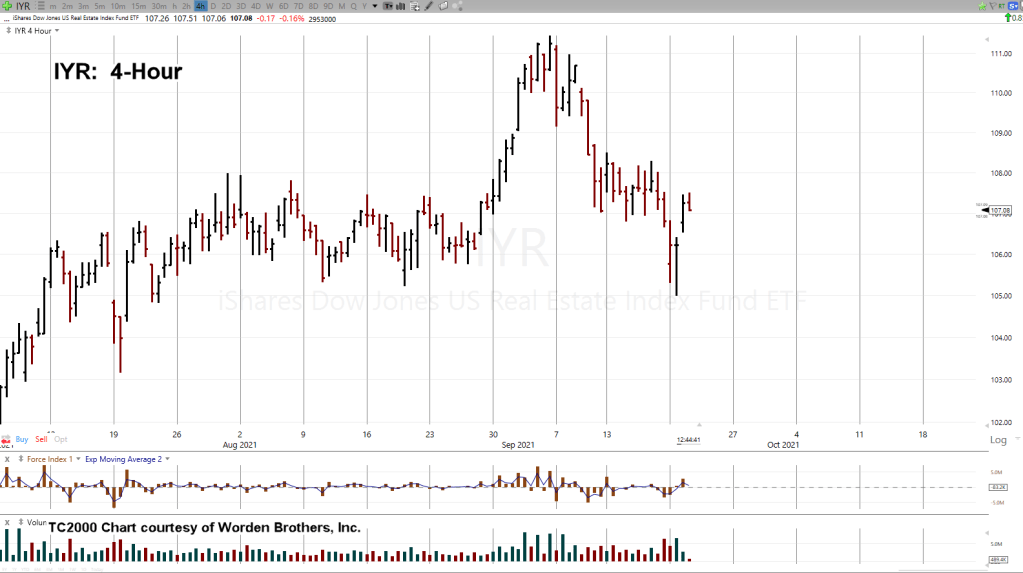
Back at the markets, let’s see if everything’s ok in the bull camp for IYR.
The short answer is, it’s not decisive for either side as of this post
4-Hour Chart of IYR:
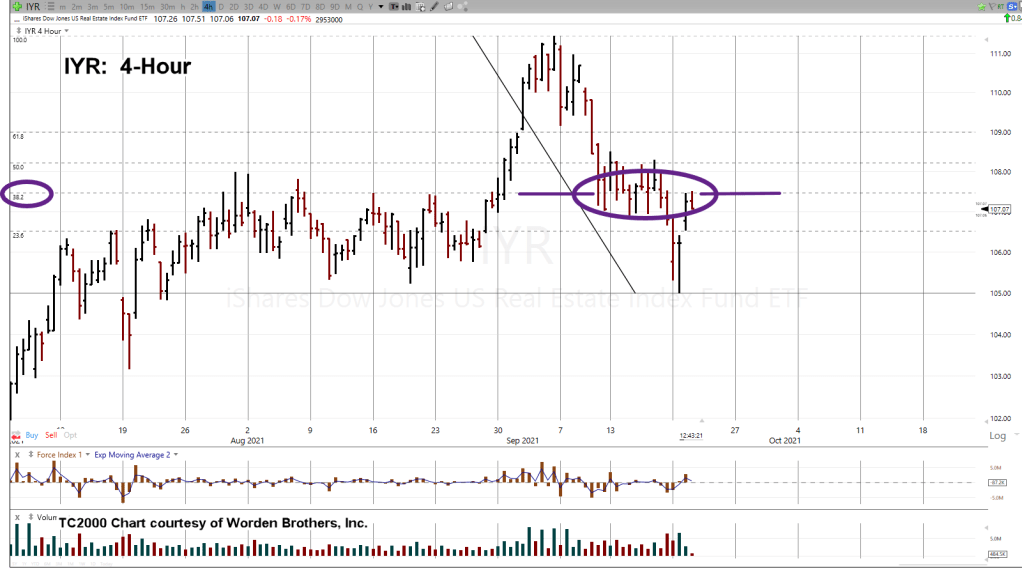
If we put in a Fibonacci retrace and then highlight the resistance area, it paints the picture more towards the bears:
Price action has reversed from a well defined resistance area … that just happens to be a 38.2%, retrace level.
So, we’ve got an excellent demarcation line.
If IYR price action gets significantly above the 38%, retrace, we’ll close out the DRV short (not advice, not a recommendation).
However, at this juncture, price action continues to retreat from the 38%, area. A good sign for the bears.
Stay Tuned
Note: Posts on this site are for education purposes only. They provide one firm’s insight on the markets. Not investment advice. See additional disclaimer here.
From his 1923 book (Reminiscences), Livermore’s rules for going short were fairly blunt:
‘I’m not interested in shorting a stock until it goes down and stays down’
It’s possible that’s what we’ve got with real estate, IYR.
This past trading week was IYR’s opportunity to regain balance and attempt to move higher.
It didn’t happen.
Instead, we got a struggle for several days; ultimately breaking lower, late during the Friday session.
Note the volume increased markedly from the day prior.
Summary:
We’re short this sector (not advice, not a recommendation) via DRV. There are times were significant reversals start slow and take time to build … this could be one of those.
Note: Posts on this site are for education purposes only. They provide one firm’s insight on the markets. Not investment advice. See additional disclaimer here.
Note: Posts on this site are for education purposes only. They provide one firm’s insight on the markets. Not investment advice. See additional disclaimer here.
Barring any new highs in the S&P, which seems less and less likely, the market has bookended two historic extremes.
September 3rd, 1929, was the peak back then; September 2nd, 2021, is the peak now.
This site has said many times, if we’re doing our job right, whenever the big reversal comes, we’ll already be in position (not advice, not a recommendation).
So, far that has proven to be correct; having gone short via DRV and TZA during the past week.
This down move is still very young. It’s almost imperceptible and could somehow be negated.
However, with each passing day when there’s no attempt or unsuccessful attempts at new highs, downside probability continues to build.
Note: Posts on this site are for education purposes only. They provide one firm’s insight on the markets. Not investment advice. See additional disclaimer here.
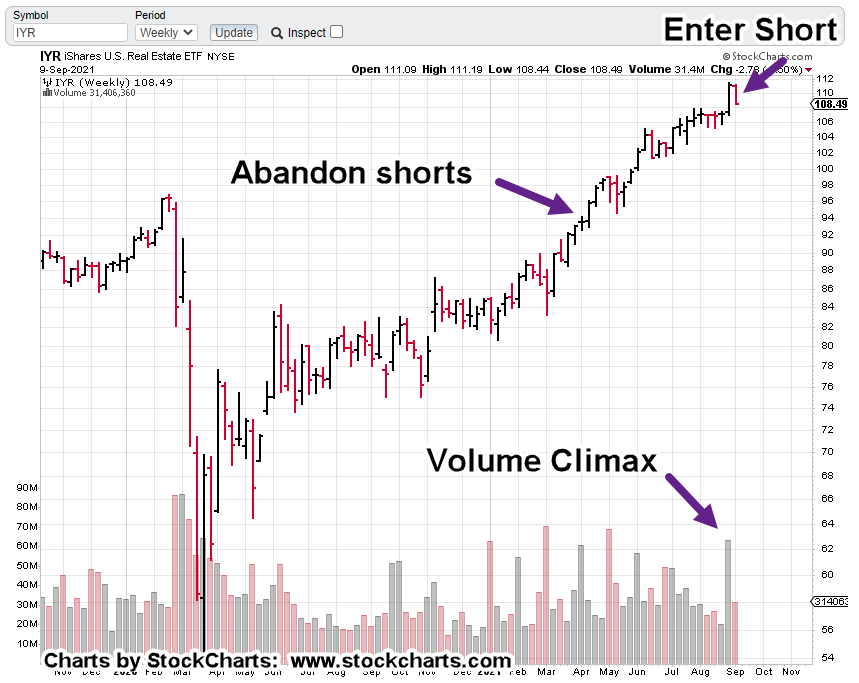
The last update on real estate (IYR) was at the ‘abandon’ arrow. At that time, the assessment was, even though conditions appeared set for reversal, it just was not happening.
Something else was going on.
It came out weeks later, that ‘something’ was entire subdivisions were being purchased (above asking price) out from under qualified potential homeowners.
Well, has that trend finally exhausted itself?
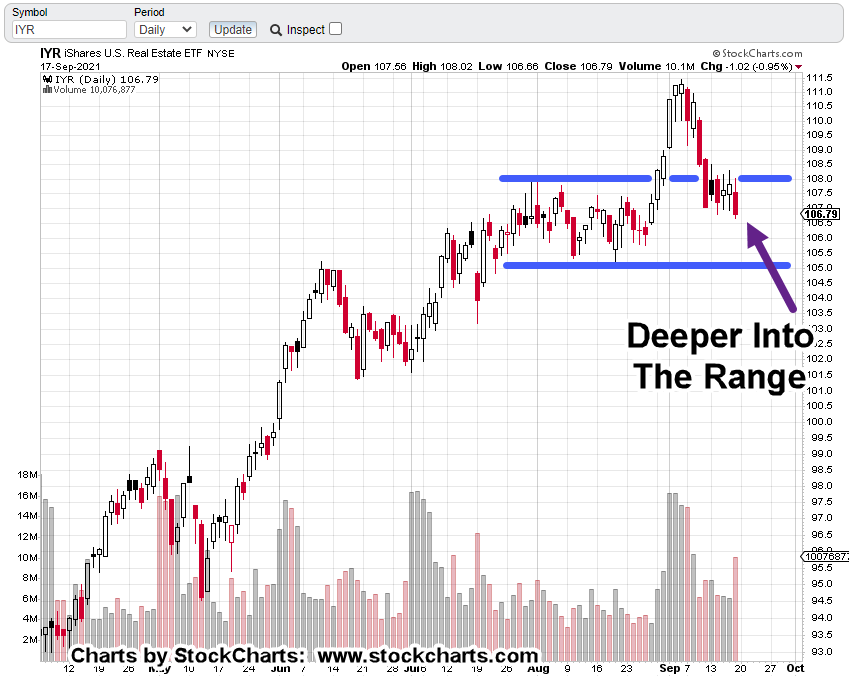
Last week’s climactic price rise and volume, which is quickly being eroded suggests were at some type of transition.
An initial position in DRV (3X inverse IYR) was opened today as shown (not advice, not a recommendation).
Pushing below the support level around IYR 107, would help confirm there’s something more going on than just a breakout and test.
Note: Posts on this site are for education purposes only. They provide one firm’s insight on the markets. Not investment advice. See additional disclaimer here.
DRV pushed through our stop early in the session; position closed (not advice, not a recommendation).
1:50 p.m. EST:
Despite all the analysis, IYR is showing continued buoyancy.
Something else is going on; possibly related to Uneducated Economist’s link provided in the last update.
Taking his cue, a functioning mortgage market is all important to the financial narrative, it’s possible this market will be more heavily manipulated than others.
At this juncture it would make sense. All indications are for reversal … yet it’s not happening in any significant way.
Time for another trade.
We’re going back to a market that in retrospect, should’ve been the focus all along; Biotech.
This site’s coming from the perspective those reading, are well aware the ‘speck’ as we call it (to avoid censorship) was a fabricated event.
Just a reminder that we’re not some ‘Johnny come lately’, here’s the link from way back in May, last year.
That post proves the situation was figured out well before the May 17th publish date (interviews, observations conducted a month prior).
What’s not fabricated however, are the repercussions from the so-called cure for the speck.
Unfortunately, those are happening now and are quite real.
Moving on to the trade.
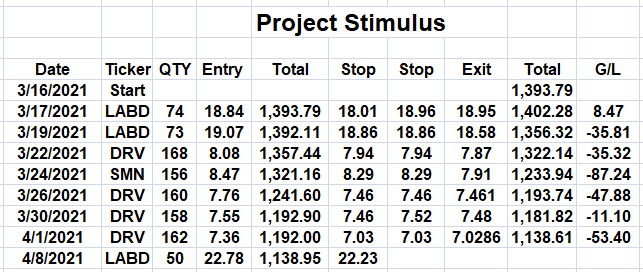
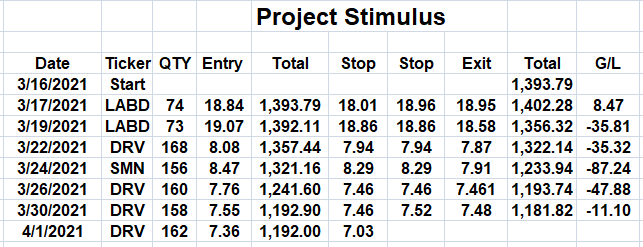
Despite the number of transactions shown in the Project Stimulus table (below), the objective is to minimize activity. We’re looking for a mid, to long term sustainable move; gain potential, 100% to 1,000%.
Monthly and weekly have reversed as well; both the monthly and weekly MACD indicators point down. Daily is essentially flat.
The hourly chart of LABD (3X inverse IBB) shows the entry location and subsequent price action. Stop is the session low @ 22.23 (not advice, not a recommendation).
It’s worth repeating, the false narrative on the speck and consequences of speck protection may blow up in the media (and biotech) at any time.
As J.P. says, getting people to do something they know is bad for them (or lethal) is the ultimate ‘elite’ high.
Note: Posts on this site are for education purposes only. They provide one firm’s insight on the markets. Not investment advice. See additional disclaimer here.
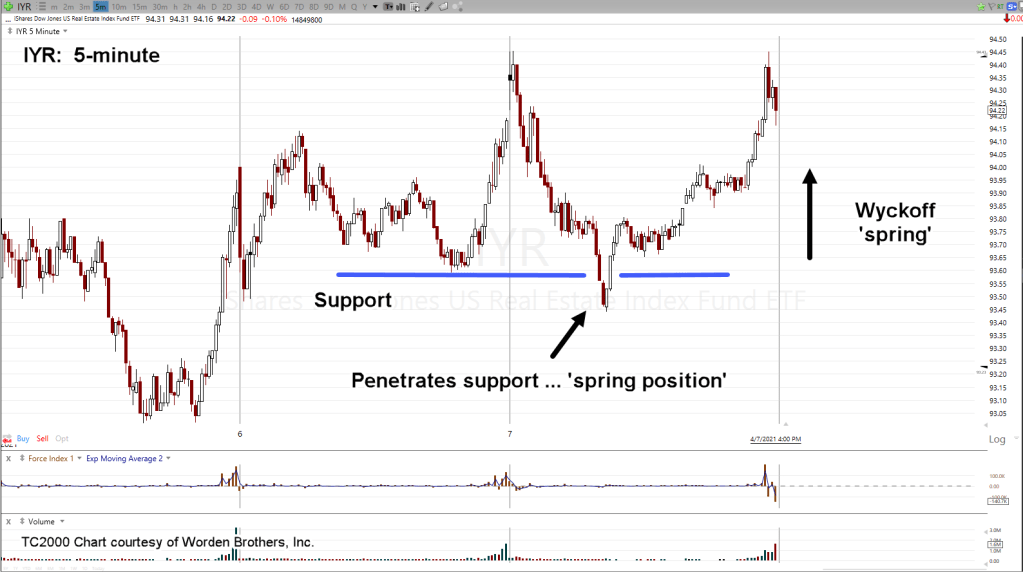
Price action is extracting every last bit of up-side. We’re down to the five-minute chart (above) to discuss yesterday’s move.
Any time price action penetrates a low or support level, it automatically puts that action in ‘spring’ position. Sometimes the selling is just too strong and the spring set-up fails immediately.
Other times (like yesterday), it holds.
Another way to look at it; for IYR to move higher, it had to go lower to get the needed fuel (penetrating support levels). Only this time, and depending on the data provider, IYR closed unchanged or up 0.02-pts.
So, the range in our recent technical discussion(s) has gone from 9.77%, to 1.83%, to 0.60%, 0.27%, and now, yesterday, 0.0%.
Before a market can go down, it has to stop going up … looks like we’re there or at least at the point where reversal is highly probable.
The hourly chart has the characteristic where volume spikes indicate trend change or potential change. The right side of the chart has the spikes but no direction change … yet.
Separate but related, Uneducated Economist gives his take on potential government ‘incentives’ for real estate.
Stay Tuned
Note: Posts on this site are for education purposes only. They provide one firm’s insight on the markets. Not investment advice. See additional disclaimer here.
Note: Posts on this site are for education purposes only. They provide one firm’s insight on the markets. Not investment advice. See additional disclaimer here.