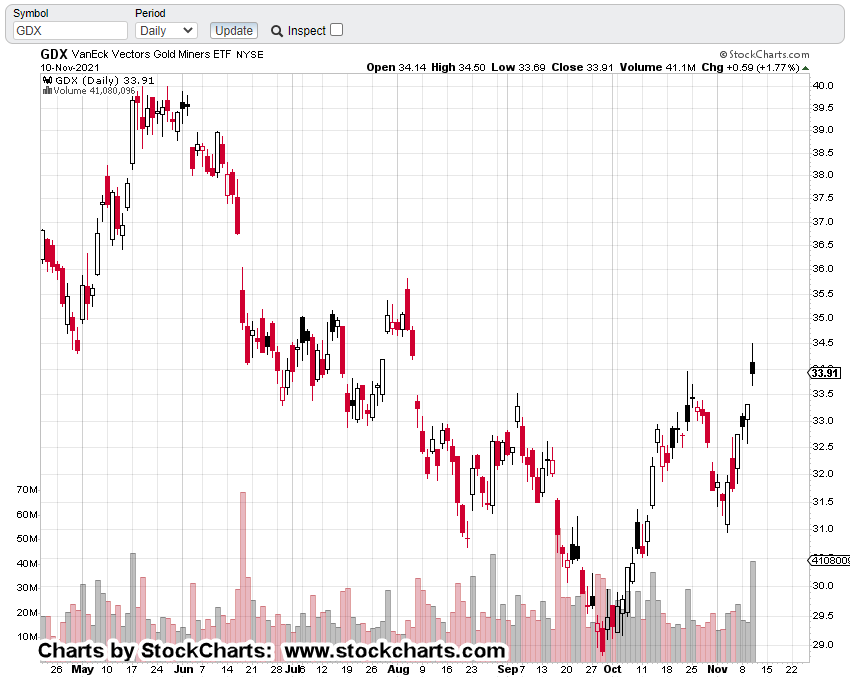
Pre-market action in miners GDX, shows a slightly higher open with inverse fund DUST below yesterday’s low.
Is the short set-up busted?
In the markets, anything can happen but we don’t know who’s really in control … yet.
Even as the dollar powers higher, gold bulls could overpower deflationary conditions pushing gold and the mining sector up as well.
To do that, they’re going to need to overcome some significant resistance obstacles.
Let’s take a look at just a couple.
Senior Miners GDX
The un-marked chart:
The mark-up:
The mark-up shows the first two layers of resistance. The blue line is the Up-thrust (potential short) condition.
The dashed black line is not so easily discernable. It was formed way back in late July and early August.
The next two charts zoom into those areas of interest; providing evidence, getting above these levels may require a sustained effort by the bulls:
Summary:
The ‘inflation’ news is already out.
Price action in today’s session may let us know if we’re in a drawn out fight lasting day to weeks; or will the bulls reach exhaustion during the session.
Note: Posts on this site are for education purposes only. They provide one firm’s insight on the markets. Not investment advice. See additional disclaimer here.
Those who’ve been monitoring this site already know, today has been in the planning stages for months.
This post was the first one to discuss the target area for a reversal in gold (GLD).
So, here we are.
So-called inflation is running rampant and it looks as if everybody’s in agreement.
Well, almost.
Turns out there’s a guy in the Pacific Northwest, a ‘boots on the ground’ type that sells lumber for a living.
Uneducated Economist never waivered on the fact, prices are rising as a result of supply constraints and not inflation.
There was one more as well.
Steven Van Metre has given his take on current monetary policies; they’re deflationary.
It’s a minority view.
Either way, we’re about to find out the truth.
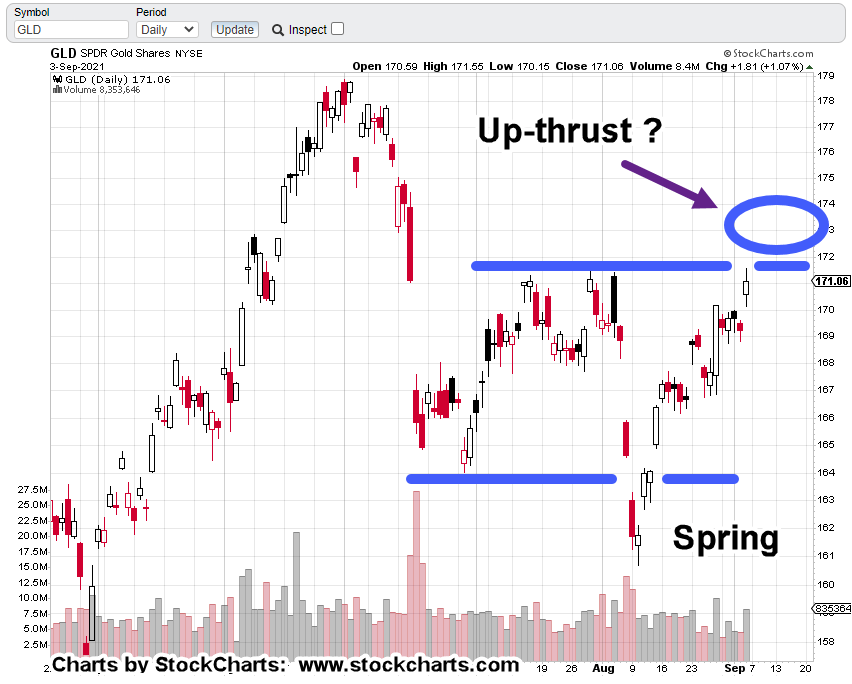
Gold (GLD) Analysis
The fact GLD, has reached a target identified two months ago, gives credence to a potential reversal.
We’ll start first, with the un-marked weekly chart of GLD:
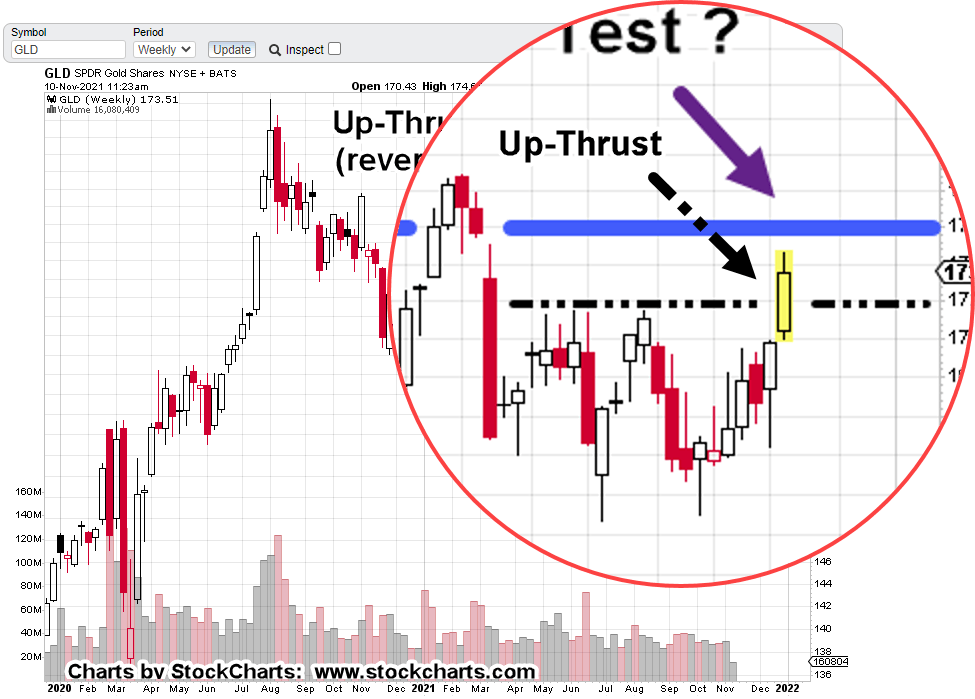
Now, the mark up:
It looks like we have a test of the original Up-Thrust (reversal).
In addition, today’s action (above black dashed- line) is another Up-Thrust.
Is this a reversal, within a reversal ?
The chart below zooms in on that area:
Everyone has their own investment/trading time-frame and method.
There’s no doubt, gold (GLD) is at the danger point. Price action can go either way.
Positioning:
The ‘inflation’ links above highlight current psychology and sentiment. The bull trap may be set.
As of this morning, we’re already positioned short this sector via DUST (not advice, not a recommendation).
Note:
A push below today’s DUST low of 17.27, does not necessarily negate the trade but it does (or will) bring it under scrutiny for potential exit (not advice, not a recommendation).
Note: Posts on this site are for education purposes only. They provide one firm’s insight on the markets. Not investment advice. See additional disclaimer here.
Maybe, it turns out that some people don’t want to be in the spotlight after all.
Click on the link.
See if your jaw doesn’t drop with how casually the interview discusses things we (the serfs) should not know.
That interview (at least the ‘tweet’) is from February, this year. So, maybe this is old news to some.
Even so, it’s just one of the many bricks in the wall for biotech.
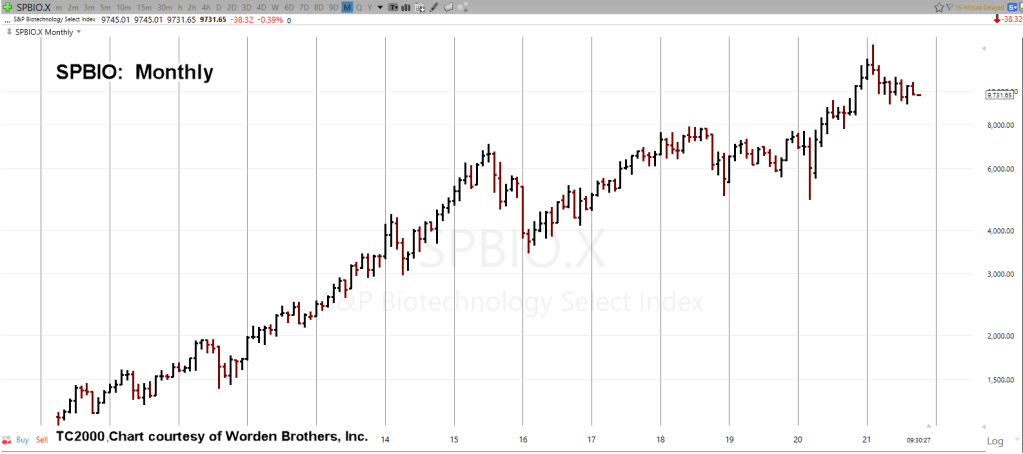
With that said, let’s take a look at our chief cook and bottle washer: SPBIO
SPBIO (and inverse, LABD) Analysis:
The last update said that we expected SPBIO, to decline and LABD, to rise from current levels.
That’s exactly what happened.
As usual, we’ll start with the unmarked chart:
Obviously, biotech’s not moving higher.
At Friday’s close, it’s down – 28.4%, from the all time highs posted February, this year.
Market Insight:
The ‘tweet’ in the link above, is dated February 9th, 2021.
The all time high for biotech SPBIO, was the very same day: February 9th, 2021.
Remember, there are no coincidences.
Let’s mark up the daily chart; showing that Friday was an outside-down (key reversal) day.
The right-most area of the chart has been zoomed-in.
Higher high, lower low and lower close:
The next chart is where it gets interesting.
We’ve included a Fibonacci projection; going from all time highs to lows in May and then counter-trend high on June 28th:
It’s clear the 23.6%, projection level has been an axis line.
SPBIO, price action has oscillated about this area for months.
With Thursday’s ‘a-b-c’ corrective move and Friday’s outside-down reversal, that axis oscillation may be complete.
If SPBIO is to head lower from this point (which is expected), we’ll watch to see if price action ‘respects’ the Fibonacci projections; that is, will price action head lower to 38%, then 50%, and on?
Positioning:
Friday was a good day to be short via LABD (not advice, not a recommendation).
Biotech, is nowhere near all time highs. The sector is essentially running neck-and-neck with GDX, to the downside.
The expectation’s for SPBIO to head lower in the coming week.
Note: Posts on this site are for education purposes only. They provide one firm’s insight on the markets. Not investment advice. See additional disclaimer here.
As is typical for this site, we’ll let the bulls duke it out with the bears. We’ll wait and see if we’re at a reversal point (trend-line) or if we’re headed to up-thrust condition.
If GLD breaks the trend-line, getting back to the 170 – 171, level (up-thrust), imagine the hysteria. 🙂
Lastly, Biotech (LABD):
First: Did we exit LABD?
Answer is No (not advice, not a recommendation)
Second: Why?
The price action thrusts below support that have been reported in prior posts were indeed spring set-ups.
However, it’s obvious now, they were not THE set-up.
The chart shows LABD has met an ‘a-b-c’ measured move target.
The idealized form of an ‘a-b-c’ corrective move, is shown with the blue lines and notations:
At this juncture, wave ‘a’ net distance traveled, is equal to ‘c’ and wave ‘b’ net distance, is about 50% the length of wave ‘a’.
These measurements are typical for ‘a-b-c’.
Positioning:
My firm’s main position is still showing a good profit and we’re going to maintain short biotech via LABD (not advice, not a recommendation).
However, as with GDX being at the danger point before its rally, so too is biotech at the danger point (prior to a potential decline).
Expectations are for LABD to retrace higher from current levels.
Note: Posts on this site are for education purposes only. They provide one firm’s insight on the markets. Not investment advice. See additional disclaimer here.
Just like the biotech sector intentionally euthanizing (a polite word for what’s really happening) its customer base, here we have another entity calling out its own followers as the problem.
It’s similar to the rabid, mindless, one-way (only goes up) gold bulls crying ‘it’s all rigged’, when their pathetic attempts at analysis don’t work out; we now have another entity citing YOU as the problem when the forecasts fall flat.
This is yet another so-called financial source that can be permanently crossed off the watch list.
Brutal, But Beneficial:
Admittedly, the ‘tone’ of the posts on this site are not for everyone.
Even mild-mannered Dan at I Allegedly, finds himself responding to snowflakes that complain about his ‘get ready’ posts.
There’s good reason why the average are so ignorant.
For those who were actually listening in middle-school, the history books conveniently leave out the part where millions of Americans died of starvation during the Great Depression.
No pictures of emaciated bodies. Nothing.
With what’s coming, we’re likely headed for mass casualties in one form or another. The financial community refuses (from what I’ve seen) to discuss this up-coming event.
For example:
If you’re still using a ‘financial advisor’ and they’re not talking about, or don’t know about the elephant, do you really want to be (paying for and) taking direction from someone who’s that lazy, fearful, or ignorant?
Prechter, said it himself when he stated, the next mega bear market’s going to wipe out the ‘wealth management’ industry.
We may be on the cusp of that now.
Not Advice:
With that said, this site does not, and will not give financial advice.
Each person has his (her) own situation in life. You are the one to decide on your next direction or action.
What this site does do, is attempt to provide analysis and supporting price action data on what’s really going on.
What’s the market saying about itself?
If you’re still reading, that was a very long intro to get to our topic for the day: Gold miners, GDX.
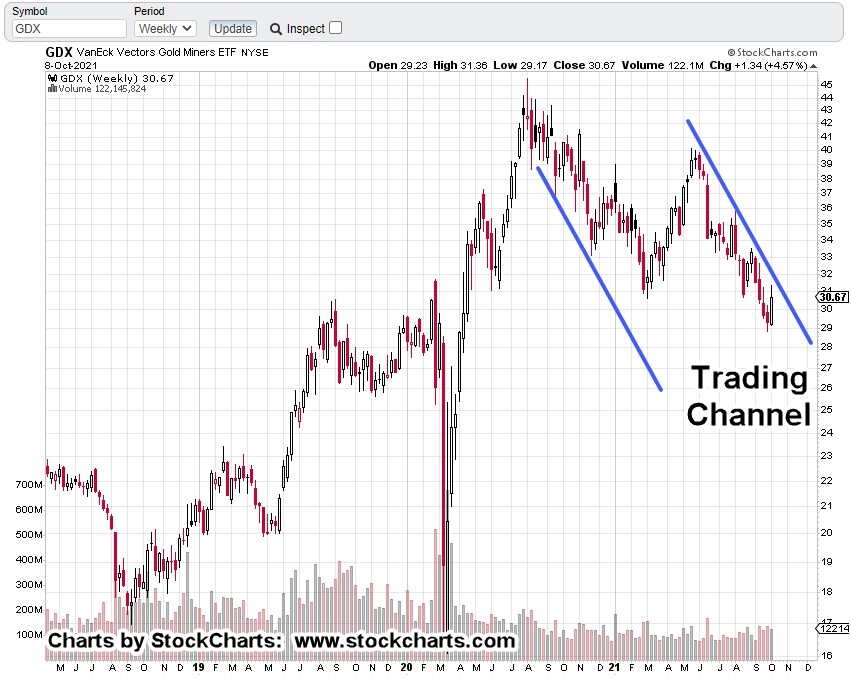
Wyckoff Analysis: Senior Miners, GDX
What we see from the weekly chart is straightforward.
GDX, has been channeling lower for about a year:
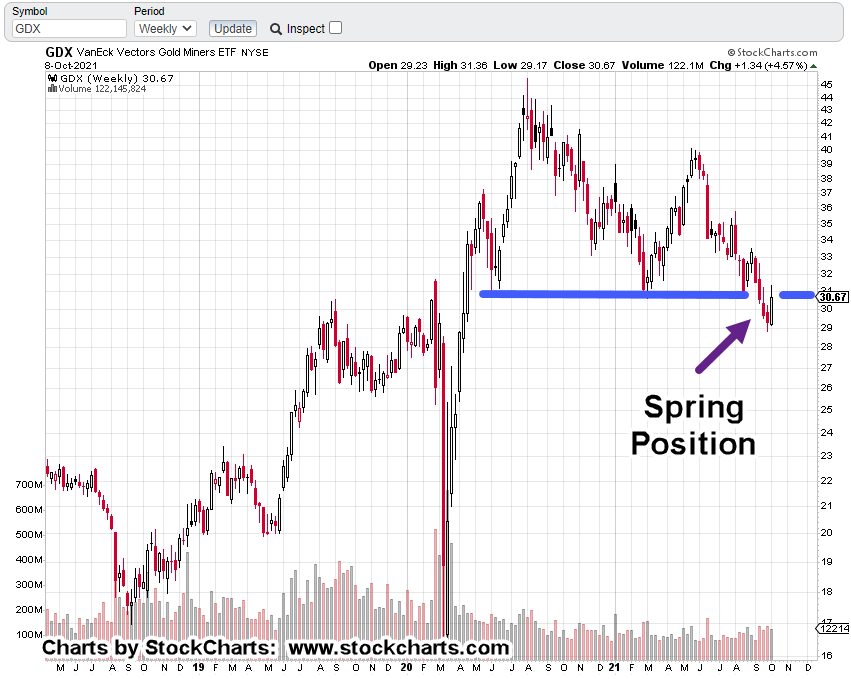
The next chart shows we’ve penetrated support and are now testing the underside.
Of note: GDX is in ‘spring’ position. An upward attempt is to be expected.
If GDX was to break out and start a sustained bull move, this would be the spot. We’re at the danger point.
In my view, the participants in this sector are borderline delusional, if not completely insane.
They disregard what the market’s actually doing; holding to a (so far, for years now) unverified belief that ‘$10,000/oz gold, is just around the corner.’
It could very well be … but only after the (possibly, soon to be) starving stackers have sold off their hoard to buy food.
One has to wrap their mind around the fact, we’re being subjected to a long term diabolical plan.
Thinking and acting with that long game in mind (in my view) provides at least a hope for not only survival, but positioning to prosper during the on-going collapse.
Note: Posts on this site are for education purposes only. They provide one firm’s insight on the markets. Not investment advice. See additional disclaimer here.
No other major index has three consecutive quarters lower.
Even the gold miners (GDX, GDXJ), while in a bear market, still had an up quarter with the one ending June 30th, this year.
So, what does this mean?
Slow At First. Then, All At Once:
The first answer is the obvious one; the air is slowly but steadily (thus far) coming out of this sector.
The second answer is more complicated.
As discussed yesterday, we’ve seen the phenomenon of instantaneous focus shift in disparate parties … a well documented and repeated occurrence in the animal kingdom.
We could see a similar thing with biotech or the markets overall.
As Dan from I Allegedly reported yesterday, the container ship pile-up off the coast and slow unloading is intentional.
The resulting shortages are intentional.
The corresponding price rises (camouflaged as ‘inflation’ by the media), are intentional.
It’s possible (speculation) that by having prices go up and the media touting it as inflation, the public, pile into the corresponding sectors such as gold, silver and the miners … all of which have been heading lower.
More importantly, what this crowd does NOT do, is go the other direction; sell and sell short, stockpile food, water, medicine, tools, hardware, consumables, protection, backup power.
Of course, some of them are.
However, just in my neighborhood as I look around and down the street, there are fifteen houses that are visible.
I know for a fact, only two (this residence and the neighbor across the street) have been, and are, taking preparatory action: That equates to 13%.
Driving through the neighborhood to get to a main road, there are about another 40 homes.
I can see, none of them have an operation garden (or livestock) of any kind: That makes our ‘prep’ percentage go down to 3.6.%.
The real percentage (for the entire neighborhood) may be close to 0.5%, or less.
This is probably a typical number but your mileage may vary.
Instantaneous Shift:
That low percentage (0.5%), gives a clue to how vicious a down-draft could be once everyone realizes they’ve been had.
Couple that with our ‘elephant’ from yesterday, and it may be absolute insanity.
All of which, brings us to the chart of biotech (SPBIO).
SPBIO Analysis:
Not only was it a down quarter but on a monthly and weekly basis, SPBIO has posted reversal and continuation (down) bars respectively.
The unmarked monthly chart of SPBIO, is below:
The next two charts show monthly reversal bars and then a Fibonacci projection to lower levels.
The projection was taken from the all time high on February 9th, this year, to the intermediate low, May 11th; then the counter-trend pivot high on June 28th.
It’s interesting to note; the monthly reversal bars are Fibonacci 8-months apart.
Stay Tuned
Note: Posts on this site are for education purposes only. They provide one firm’s insight on the markets. Not investment advice. See additional disclaimer here.
The gold and mining sector continues to be chocked full of delusional bulls and rabid hyper-inflationists.
Just take a cursory look at YouTube sites that continue to ‘stack’. As repeated many times over the past year the ‘hyperinflation’ narrative is just not happening.
Food price increases along with fuel and shipping, are all related to a controlled demolition of the supply chain.
It’s not hyper-inflation.
It really does not take much research effort to figure that part out.
If there is a trade here, we’re going to leave it (not advice, not a recommendation) and just watch to see where the carnage goes.
Note: Posts on this site are for education purposes only. They provide one firm’s insight on the markets. Not investment advice. See additional disclaimer here.
Note: Posts on this site are for education purposes only. They provide one firm’s insight on the markets. Not investment advice. See additional disclaimer here.
Note: Posts on this site are for education purposes only. They provide one firm’s insight on the markets. Not investment advice. See additional disclaimer here.
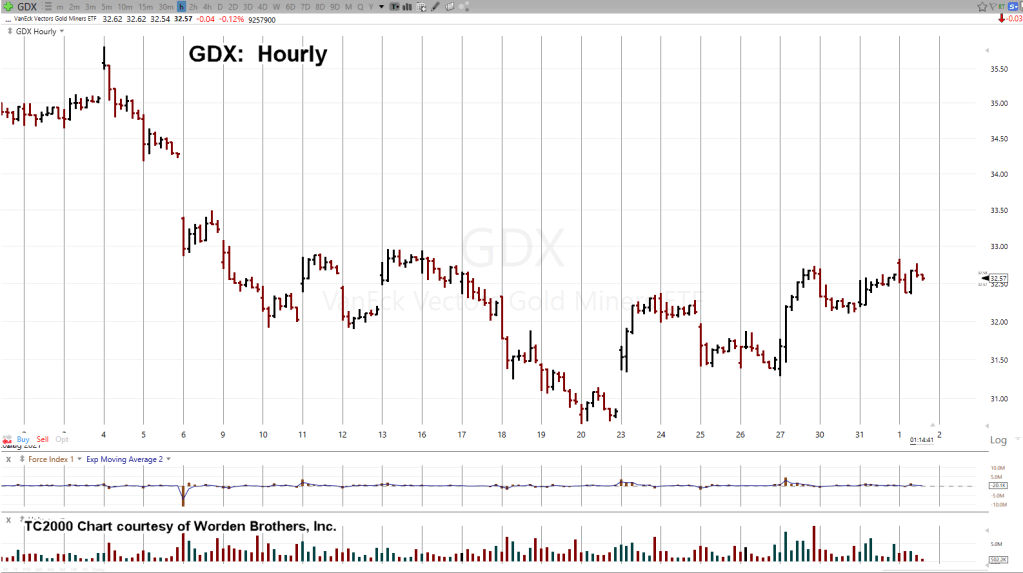
With a slight new daily high, we’re potentially at the end of the GDX rally.
It should be noted: The past two weeks of trading have stayed within the price extremes of the wide bar posted during the week of August 20th.
This is called ‘inside action’; typically signaling preparation for the next phase … whether up or down.
Note, the inverse fund DUST pushed just 0.02 points (DUST, 19.78) below our stop level (not advice, not a recommendation).
That position was elected to be maintained … we’re still short.
The hourly unmarked chart of GDX is below:
Next, we invert the chart to mimic the inverse fund DUST:
Now, comes the mark-up:
From Wyckoff’s writings all the way back to circa 1910, he discussed ‘shortening of the thrust’.
When net progress becomes less and less … we know we’re nearing the end of the move.
Throw into the mix the high level of resistance at the GDX 33.00, and probabilities favor the downside … upside for DUST (not advice, not a recommendation).
Stay Tuned
Note: Posts on this site are for education purposes only. They provide one firm’s insight on the markets. Not investment advice. See additional disclaimer here.