Biotech: Three In A Row

Early Session

It’s Official:

Down, Three Quarters In A Row

No other major index has three consecutive quarters lower.

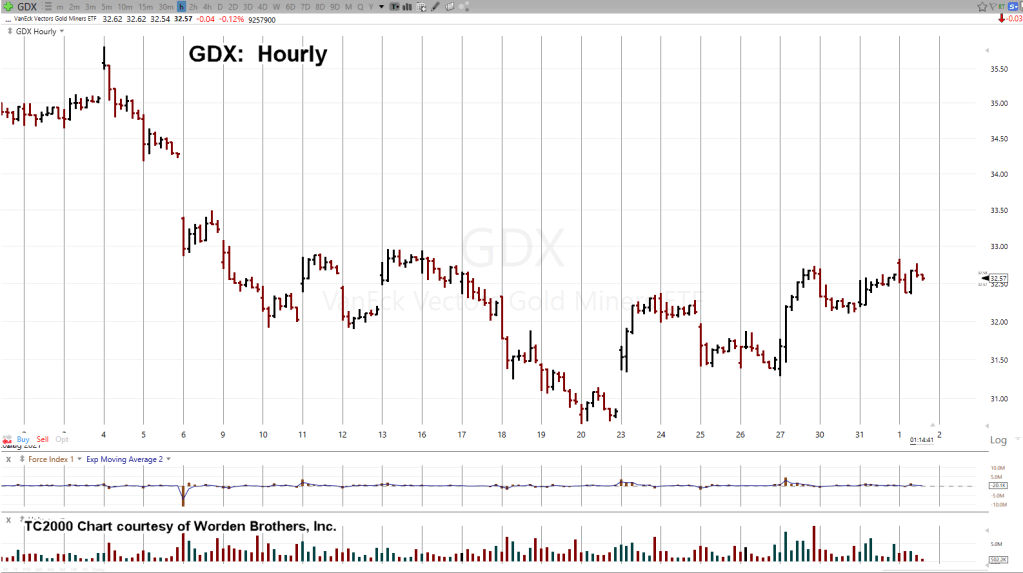
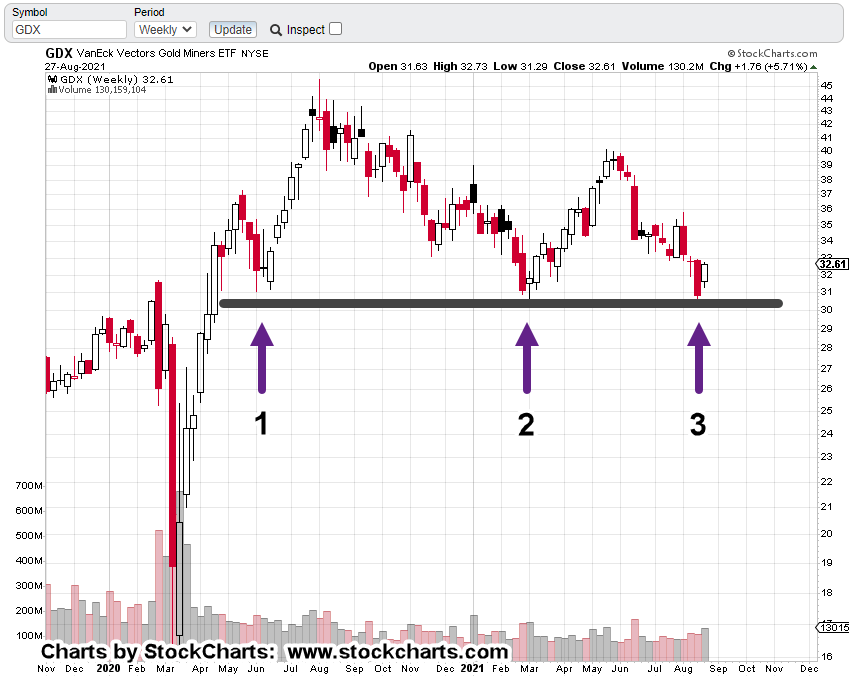
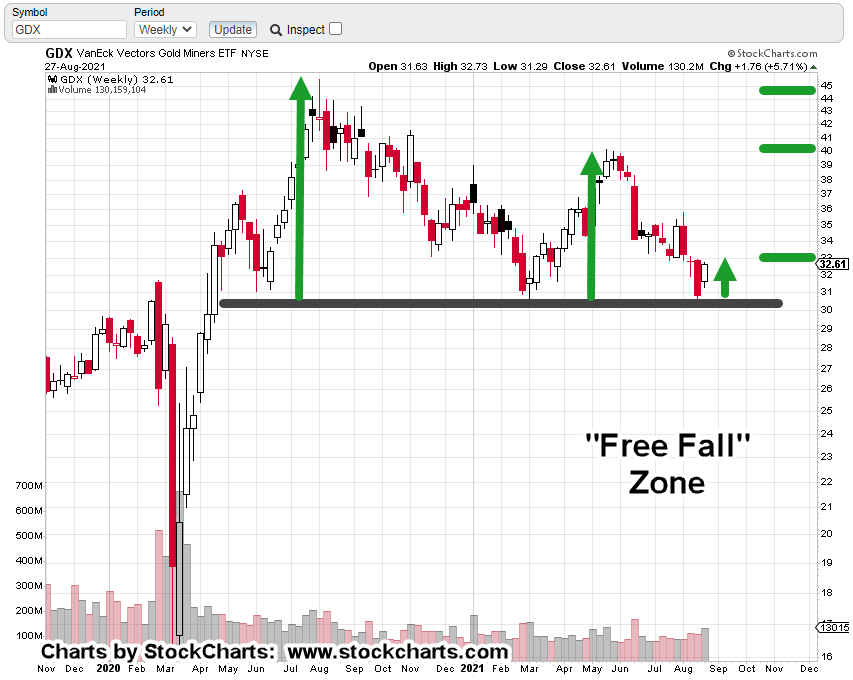
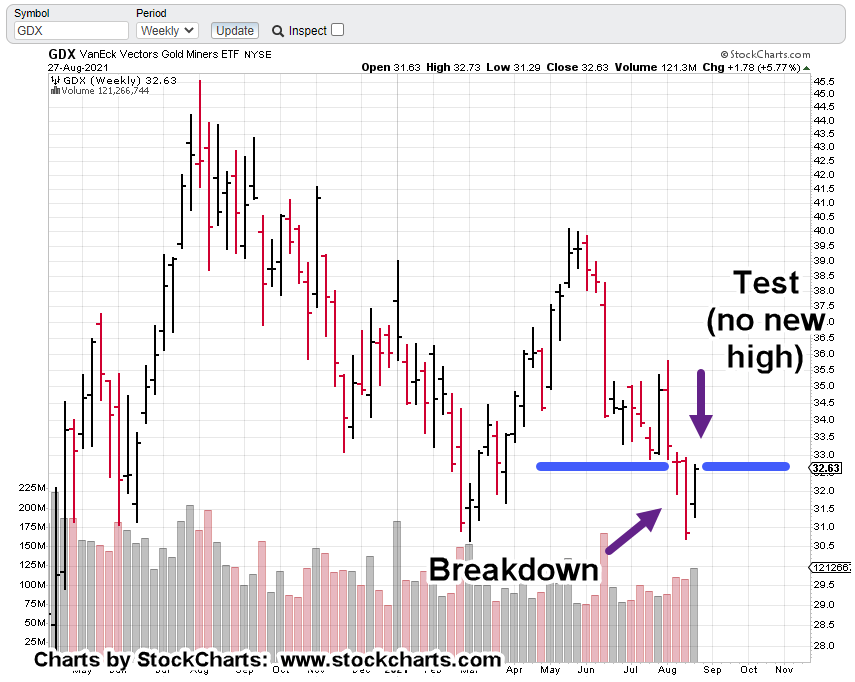
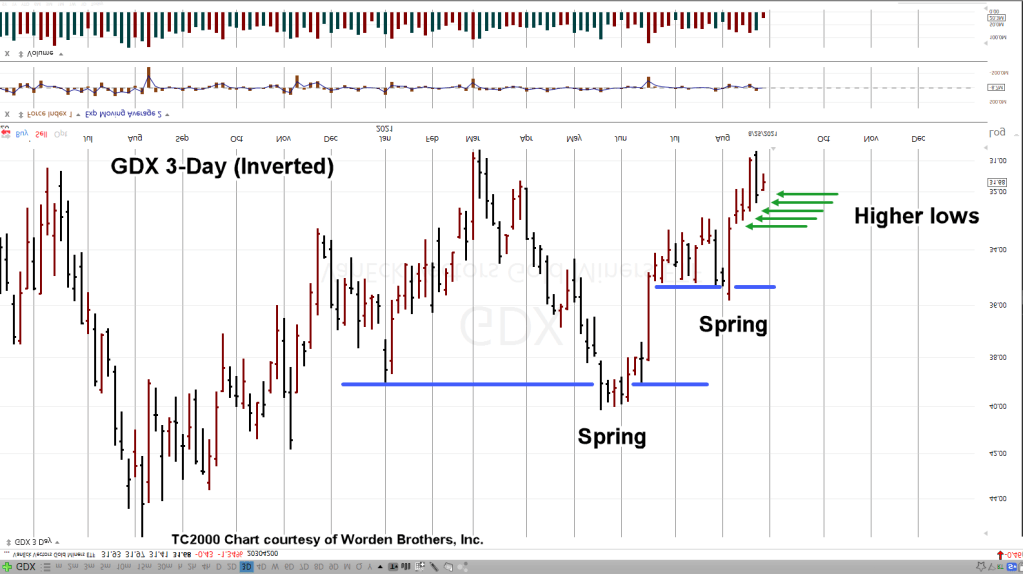
Even the gold miners (GDX, GDXJ), while in a bear market, still had an up quarter with the one ending June 30th, this year.

So, what does this mean?

Slow At First. Then, All At Once:

The first answer is the obvious one; the air is slowly but steadily (thus far) coming out of this sector.

The second answer is more complicated.

As discussed yesterday, we’ve seen the phenomenon of instantaneous focus shift in disparate parties … a well documented and repeated occurrence in the animal kingdom.

We could see a similar thing with biotech or the markets overall.

As Dan from I Allegedly reported yesterday, the container ship pile-up off the coast and slow unloading is intentional.

The resulting shortages are intentional.

The corresponding price rises (camouflaged as ‘inflation’ by the media), are intentional.

It’s possible (speculation) that by having prices go up and the media touting it as inflation, the public, pile into the corresponding sectors such as gold, silver and the miners … all of which have been heading lower.

More importantly, what this crowd does NOT do, is go the other direction; sell and sell short, stockpile food, water, medicine, tools, hardware, consumables, protection, backup power.

Of course, some of them are.

However, just in my neighborhood as I look around and down the street, there are fifteen houses that are visible.

I know for a fact, only two (this residence and the neighbor across the street) have been, and are, taking preparatory action: That equates to 13%.

Driving through the neighborhood to get to a main road, there are about another 40 homes.

I can see, none of them have an operation garden (or livestock) of any kind: That makes our ‘prep’ percentage go down to 3.6.%.

The real percentage (for the entire neighborhood) may be close to 0.5%, or less.

This is probably a typical number but your mileage may vary.

Instantaneous Shift:

That low percentage (0.5%), gives a clue to how vicious a down-draft could be once everyone realizes they’ve been had.

Couple that with our ‘elephant’ from yesterday, and it may be absolute insanity.

All of which, brings us to the chart of biotech (SPBIO).

SPBIO Analysis:

Not only was it a down quarter but on a monthly and weekly basis, SPBIO has posted reversal and continuation (down) bars respectively.

The unmarked monthly chart of SPBIO, is below:

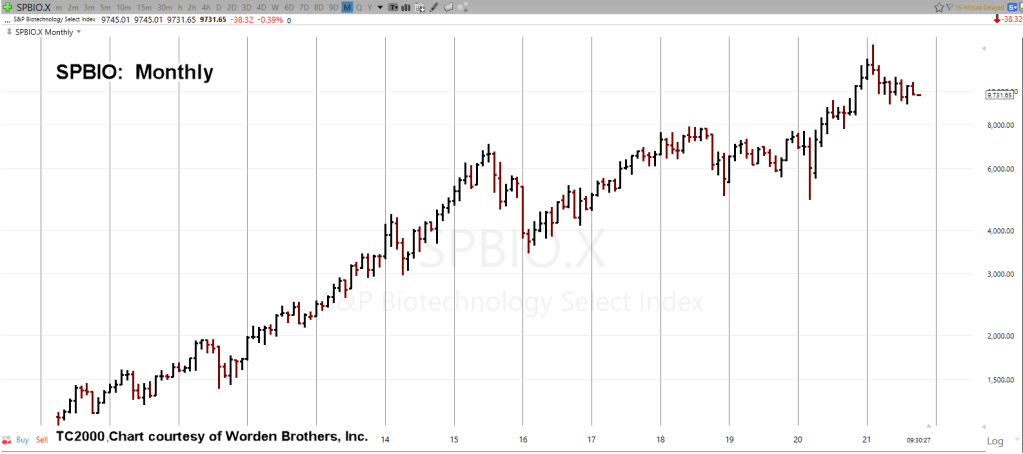
The next two charts show monthly reversal bars and then a Fibonacci projection to lower levels.

The projection was taken from the all time high on February 9th, this year, to the intermediate low, May 11th; then the counter-trend pivot high on June 28th.

It’s interesting to note; the monthly reversal bars are Fibonacci 8-months apart.

Stay Tuned

Note:  Posts on this site are for education purposes only.  They provide one firm’s insight on the markets.  Not investment advice.  See additional disclaimer here.

Gold Changes Character

Mid Session

Another Bell Rings

Gold (GLD) was on track to continue higher into a potential up-thrust … right up to yesterday.

That’s when the character of price action changed.

Action suddenly had a down day with no buoyancy. That was the clue something else is at work.

Today, we saw the result.

At this juncture, with world events picking up yet again, we probably just entered or are about to enter a deflation impulse.

Summary:

The gold and mining sector continues to be chocked full of delusional bulls and rabid hyper-inflationists.

Just take a cursory look at YouTube sites that continue to ‘stack’. As repeated many times over the past year the ‘hyperinflation’ narrative is just not happening.

Food price increases along with fuel and shipping, are all related to a controlled demolition of the supply chain.

It’s not hyper-inflation.

It really does not take much research effort to figure that part out.

If there is a trade here, we’re going to leave it (not advice, not a recommendation) and just watch to see where the carnage goes.

Stay Tuned

Charts by StockCharts

Note:  Posts on this site are for education purposes only.  They provide one firm’s insight on the markets.  Not investment advice.  See additional disclaimer here.

Gold Lower ? … Not Yet

Mid Session

Gold (GLD) Pivoting Higher

The last update on gold (GLD) has us expecting an up-thrust (reversal) condition.

Even though price action immediately pushed away from the resistance area, there’s still a possibility GLD is on track to recover and move higher.

Downward action in GLD has stalled and looks like it’s building energy for an attempted breakout.

If and when we get an up-thrust … that’s the time to expect fireworks in the mining sector.

Stay Tuned

Charts by StockCharts

Note:  Posts on this site are for education purposes only.  They provide one firm’s insight on the markets.  Not investment advice.  See additional disclaimer here.

Gold (GDX) Signs of Order

After The Close

Fibonacci Width Channel

Fibonacci Sequence On Trend

Adhering to Fibonacci time sequencing does not guarantee anything.

What it does tell us in the case of GDX (daily) below, is that price action’s exhibiting order.

Fibonacci width on the GDX trading channel can be seen here.

Order is what usually comes before dis-order 🙂

It won’t take much force either way, to negate the down-channel set up; or allow gold and the miners to descend into bear market chaos.

Stay Tuned

Charts by StockCharts

Note:  Posts on this site are for education purposes only.  They provide one firm’s insight on the markets.  Not investment advice.  See additional disclaimer here.

Gold (GDX) Bulls … Exhausted?

Mid-Session

Intraday Hourly GDX Reversal: Signs of Trouble?

It took one more day than expected.

With a slight new daily high, we’re potentially at the end of the GDX rally.

It should be noted: The past two weeks of trading have stayed within the price extremes of the wide bar posted during the week of August 20th.

This is called ‘inside action’; typically signaling preparation for the next phase … whether up or down.

Note, the inverse fund DUST pushed just 0.02 points (DUST, 19.78) below our stop level (not advice, not a recommendation).

That position was elected to be maintained … we’re still short.

The hourly unmarked chart of GDX is below:

Next, we invert the chart to mimic the inverse fund DUST:

Now, comes the mark-up:

From Wyckoff’s writings all the way back to circa 1910, he discussed ‘shortening of the thrust’.

When net progress becomes less and less … we know we’re nearing the end of the move.

Throw into the mix the high level of resistance at the GDX 33.00, and probabilities favor the downside … upside for DUST (not advice, not a recommendation).

Stay Tuned

Note:  Posts on this site are for education purposes only.  They provide one firm’s insight on the markets.  Not investment advice.  See additional disclaimer here.

Gold (GDX) Bulls … Time To Hide?

Late Session

GDX Breakdown, Draws Nigh?

We’re not there yet and anything can happen in the meantime.

However, Senior Miner’s GDX, price action has moved lower during this session as expected.

Today has offered up one more clue for the bears provided GDX closes lower.

That is, we may have a channel confirmation:

Fibonacci time sequences are not necessarily always at price extremes. As shown above, they can define the width of a trading channel as well.

If this short (sell) set-up fails (GDX moves higher), we now have a definitive stop area for inverse fund DUST (not advice, not a recommendation); somewhere around: DUST 19.80 – 20.00.

Steven Van Metre in his last update, gave data on how the dollar is in a rally and nearing breakout position.

So far, there’s still a negative correlation between the dollar, gold, and gold miners.

Stay Tuned

Charts by StockCharts

Note:  Posts on this site are for education purposes only.  They provide one firm’s insight on the markets.  Not investment advice.  See additional disclaimer here.

Knock Three Times …

Gold, GDX Warning: Breakdown Imminent?

It’s true when price action rebounds off a level, whether support or resistance, that level is confirmed.

However, personal (mental) bias, like the rabid hyperinflation ‘dollar destruction’ gold bulls, collectively have their minds so twisted, every bounce off so called support, is a buying opportunity.

That kind of blindness can set oneself up for (financial) disaster.

Well, we’re about to see if the current bounce was a buying opportunity or harbinger of a “free fall” breakdown.

Price action’s the final say. So, let’s take a look at what its been saying about the latest move.

Un-marked weekly chart of Senior Mining (ETF) Index GDX:

Next, comes the support line and contact points identified:

Now, comes the important part. Each rebound off support has less upward travel than before:

The right-most green arrow (upward travel), may or may not be complete. One fact in favor of completion is the significant amount of resistance around GDX, 33.00.

Price action has spent six weeks transacting in this area. Three weeks above support and now three weeks below.

Positioning:

We’re at the danger point; risk of being wrong on a short position is least (not advice, not a recommendation).

At this juncture, price action does not need to go far to either support or negate a short trade set-up.

With that in mind, the Project Stimulus account is short this sector via DUST (not advice, not a recommendation).

Stay Tuned

Charts by StockCharts

Note:  Posts on this site are for education purposes only.  They provide one firm’s insight on the markets.  Not investment advice.  See additional disclaimer here.

GDX Update

After The Close

No New Weekly High

GDX price action pushed through the 3-day highs shown in the last update. Even so, on a weekly basis, price action was unable to make a new high.

We see on the chart, a breakdown through support and this week’s test.

After today’s Fed speech, we’ll see if this is all there is for the upside on gold and the miners.

Recall, from a recent J. Bravo update, there aren’t any bears left.

Stay Tuned

Charts by StockCharts

Note:  Posts on this site are for education purposes only.  They provide one firm’s insight on the markets.  Not investment advice.  See additional disclaimer here.

Gold (GDX) Experiments

Before The Open

Looking At The 3-Day GDX, Chart

As Dr. Elder once said (paraphrasing): ‘There are many ways to make money in the markets … even more ways to lose it.’

The time required to master the basics like support, resistance, accumulation, distribution is up to the individual.

After that however, the experimentation starts: Fibonacci retrace, time sequences, technical forces, multiple time frames and on.

Experimenting with the chart of Senior Gold Miners GDX, shows at this time, a 3-Day chart reveals nuances not seen (so easily) in the daily or weekly.

We’re going to invert the chart to mimic the GDX inverse fund DUST (without the tracking errors) as shown below:

Then comes the mark-up:

All of a sudden, it becomes clear. Inverted GDX has been in a series of springs (up-thrust, non-inverted) and is now pivoting to the upside. That pivot is shown with the green arrows.

Each 3-Day period having a higher low than before.

As detailed in this prior update, GDX is potentially on the verge of ‘free fall’ (not advice, not a recommendation).

Pre-market trading has GDX, lower with DUST higher.

Stay Tuned

Note:  Posts on this site are for education purposes only.  They provide one firm’s insight on the markets.  Not investment advice.  See additional disclaimer here.

Dollar Destruction? Not Yet

Before The Open

‘Dollar Destruction’ To Be Postponed

Hyper-Inflation Not In The Charts

Who looks at the actual chart anyway … so old-school.

However, what that school is telling us, the dollar’s built a solid base for a sustained rally.

Then we have this: Uneducated Economist gives us links in his report on why dollar demand could increase substantially.

If dollars are going up, gold is going down.

At this juncture, there’s still an inverse correlation.

Position Update:

On a separate but related note, the FDA announcement from yesterday was not taken into account with the biotech plan. An error if you will.

The level of malfeasance as detailed in this link was not thought to be possible.

The Project Stimulus account exited the short biotech trade with a small gain as shown below.

More analysis to come on a potential long-term biotech reversal set-up not unlike the dollar.

For now, we’re out.

Stay Tuned

Charts by StockCharts

Note:  Posts on this site are for education purposes only.  They provide one firm’s insight on the markets.  Not investment advice.  See additional disclaimer here.