Gold … After The Reversal

Changing of Hands’

It’s a significant, if not major event, when one market participant (collectively) hands off the trading vehicle to another.

In a decline, that usually means the ‘average investor’, the least disciplined, least knowledgeable, gives up and hands off to the professionals; the ‘strong hands’.

In a blow-off top, the reverse is true.

The professionals lead the ignorant along with whatever narrative is necessary so that enough volume is created to successfully exit positions.

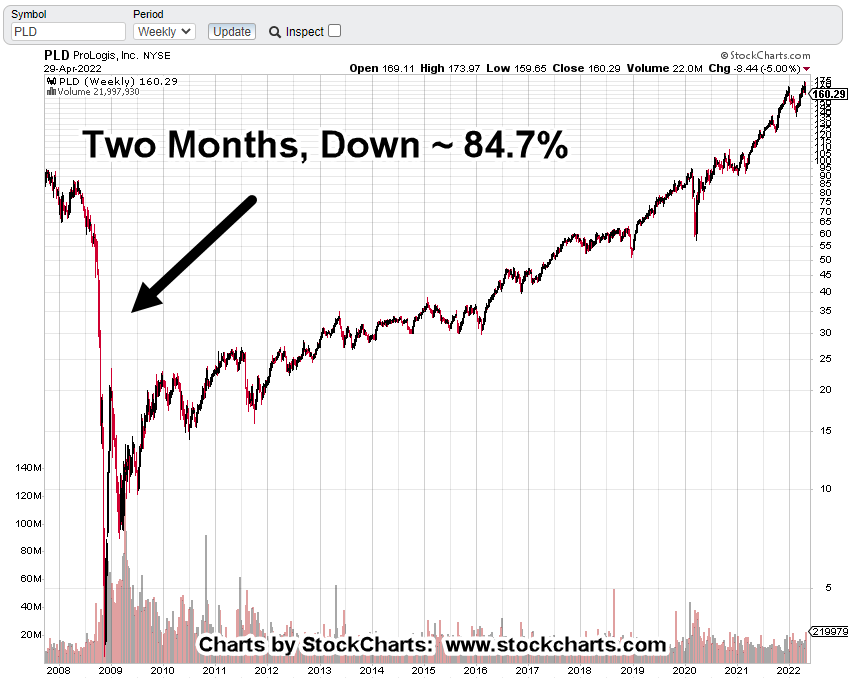
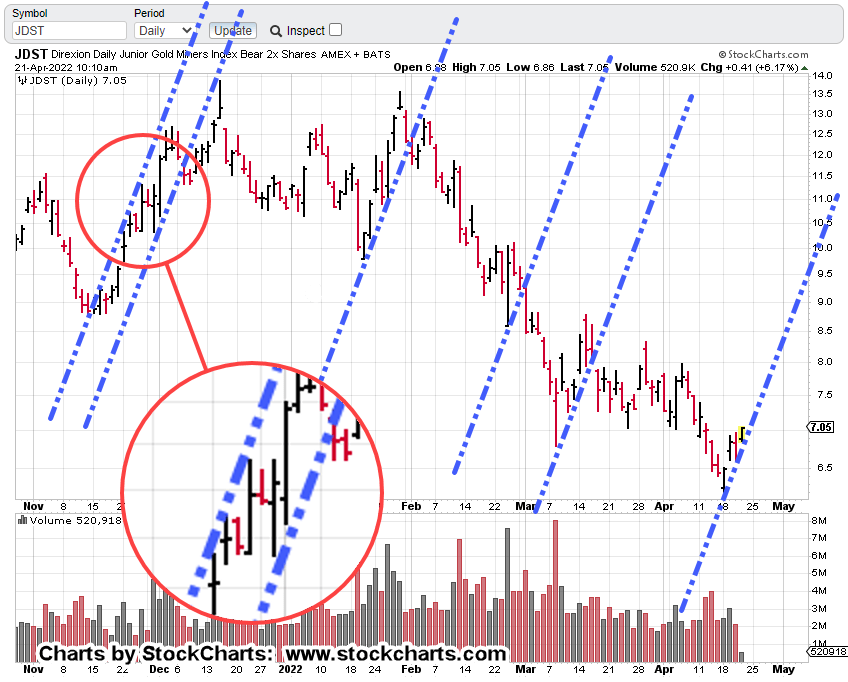
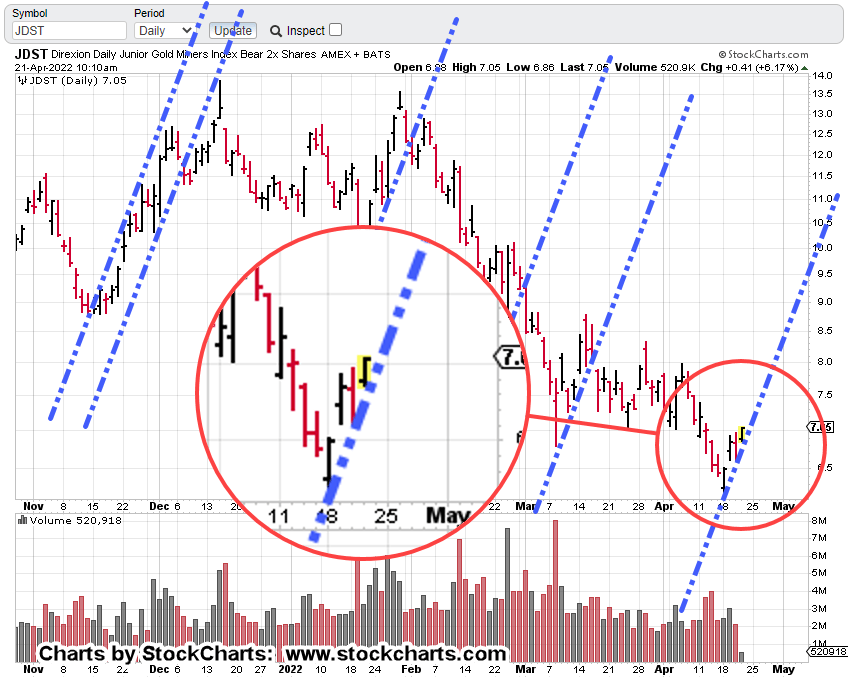
The changing of hands for gold and gold miners, was identified on this site, here, here, here, here, here, here, and here, starting over two-and-a-half months ago.

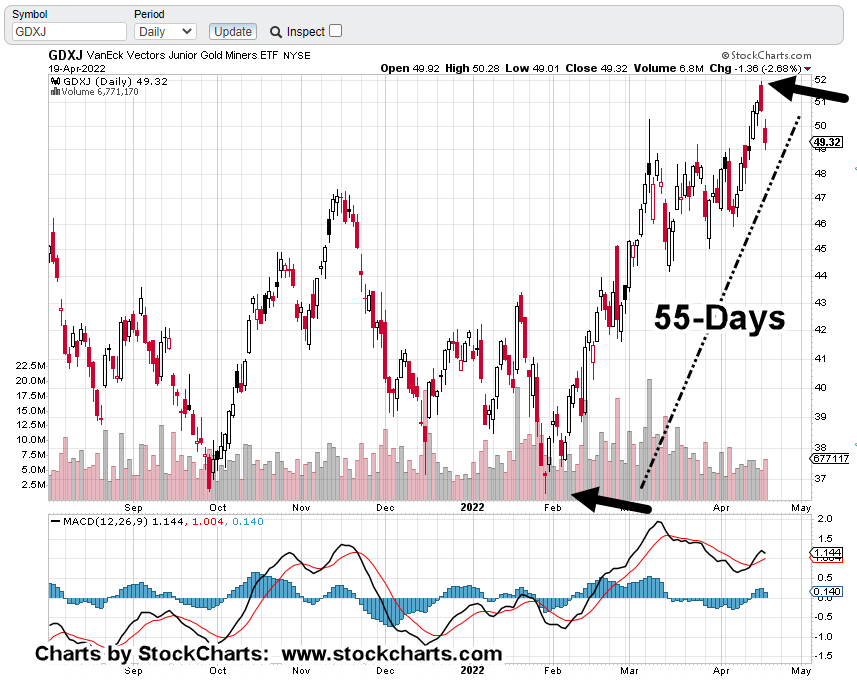
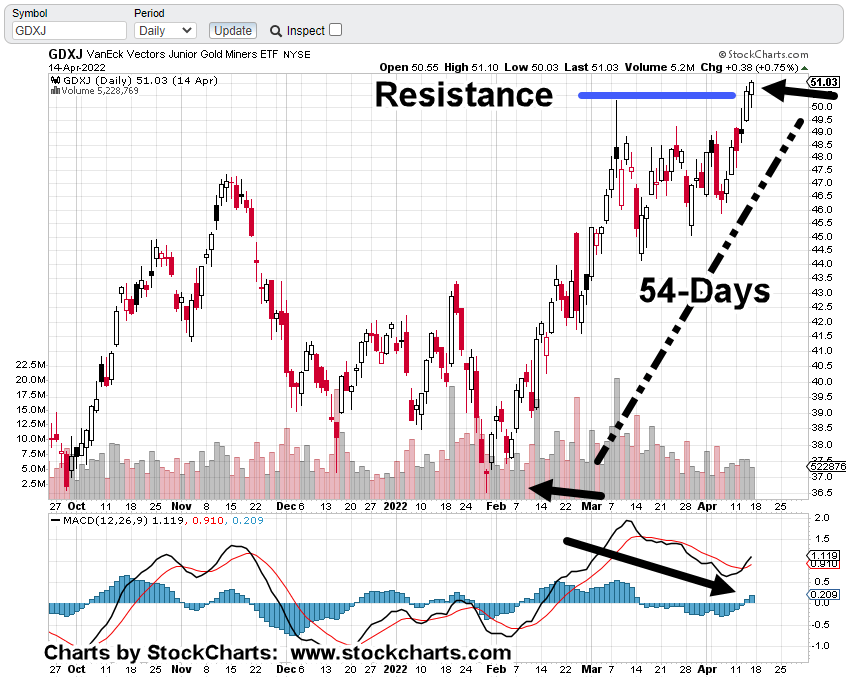
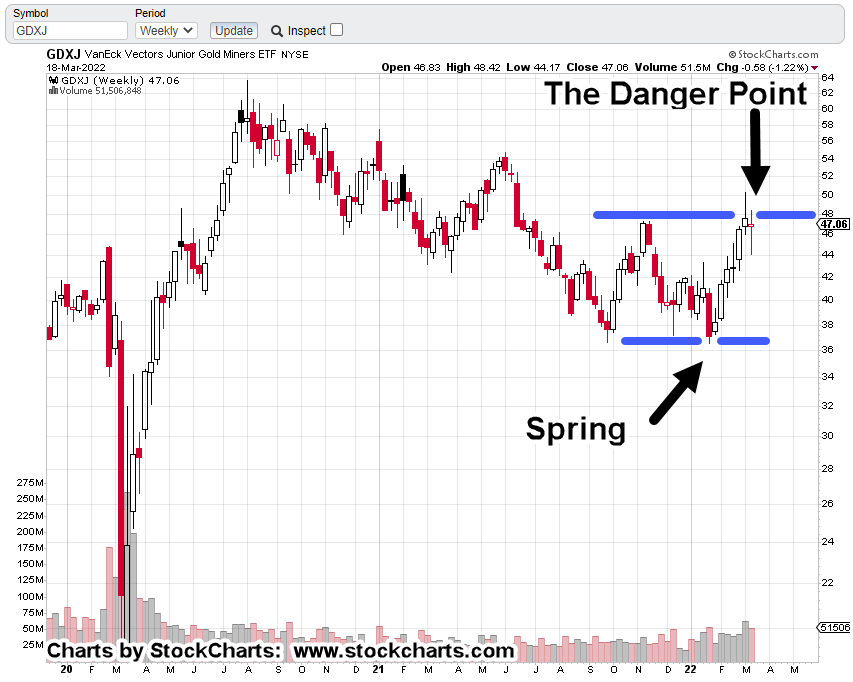
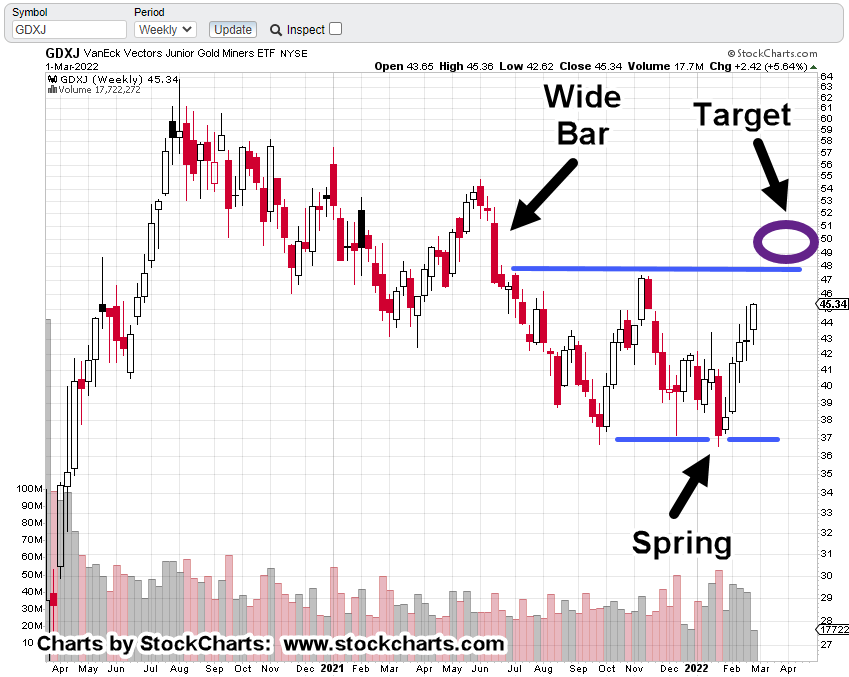
The analysis was consistent throughout; we are not in a long-term, sustainable, bull market. That stance applied most specifically to gold miners GDX, and GDXJ.

For that assessment to change, price action itself would have to change character; not the lagging momentum indicators, moving averages, price oscillators and so on that are themselves, defined by price action.

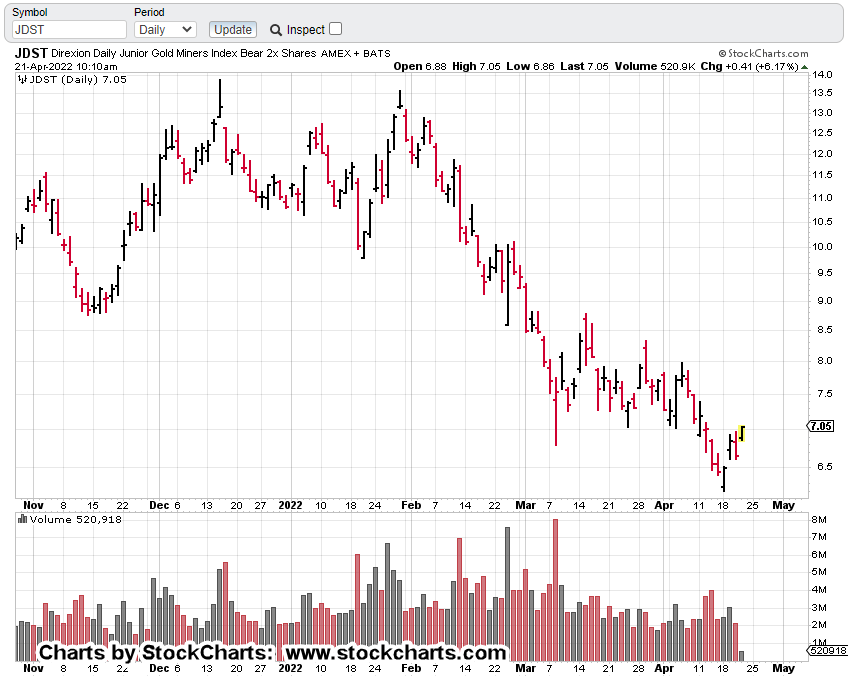
So, let’s take a look at what gold (GLD) is saying about itself.

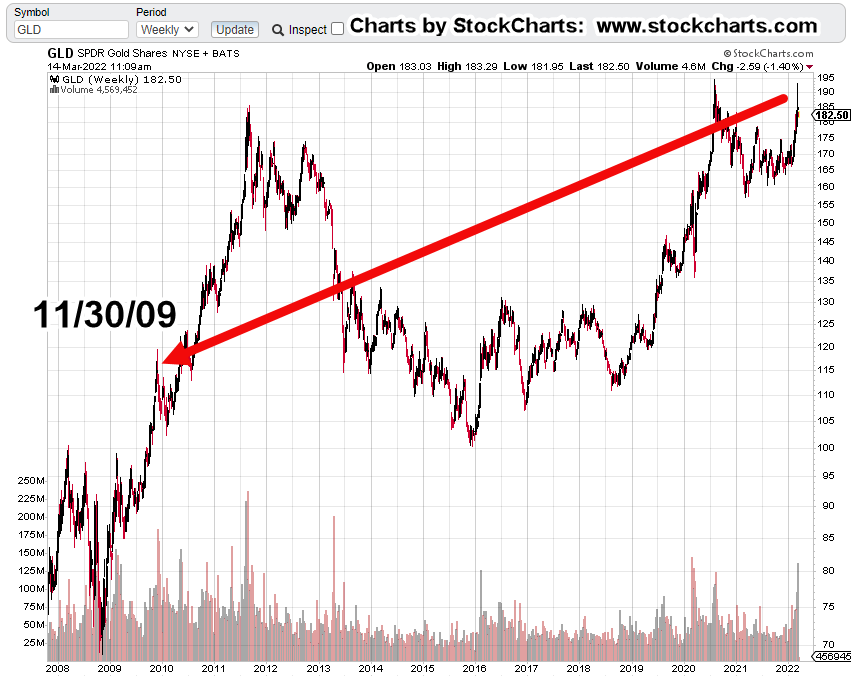
Gold (GLD), Weekly Chart

First, the un-marked chart.

Next, we see a medium to long term trendline that’s been decisively broken and tested.

Getting closer-in, we can see the oscillation about the line, the break and subsequent test (with reversal).

What’s Next?

Well, that brings us to Harry Dent.

Love him or hate him. Here he is, offering up a perspective that’s not going to be popular.

How can gold (GLD) decline from here?

Let’s take a look.

If the wedge above is in-effect, if it’s the dominant factor at this point, then a break depending on location would take GLD down to about 130-ish.

If that happens, it will be a big event … down to approximately $1,300/oz.

However, it’s what may come next, that will be totally unexpected.

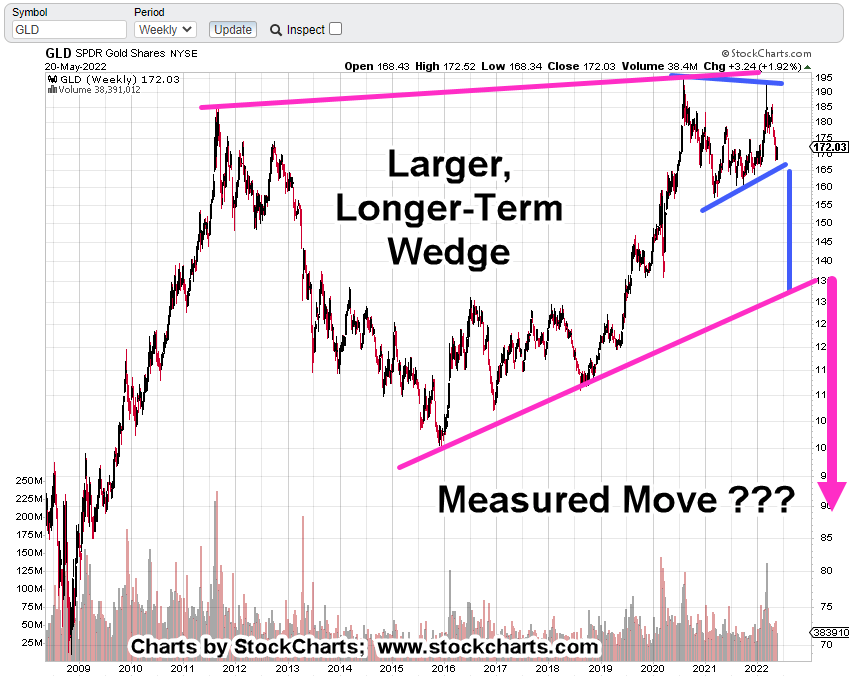
It’s interesting, the wedge in blue has a measured move target right to the bottom of the larger wedge in magenta.

To get below $900/oz, will be a very different place.

With that in mind, this site has presented time and again, we’re in an unprecedented world-event.

‘Normal’ is not coming back … ever.

Awake, or Not

Jerimiah Babe, in one of his latest videos hints there’s a strange vibe to what’s happening: Time stamp 5:20,

‘There’s something going on here …’

The Fed may actually be telling us the truth … just not in the way we expect.

You have to be awake to read between the lines.

Inflation may indeed be ‘transitory’ as they say because consumer demand is going to evaporate.

Evaporate not because the consumer can’t afford it, but because there are, or will be, no consumers.

Stay Tuned

Charts by StockCharts

Note:  Posts on this site are for education purposes only.  They provide one firm’s insight on the markets.  Not investment advice.  See additional disclaimer here.

The Danger Point®, trade mark: No. 6,505,279


The ProLogis ‘Connection’

Largest Cap, In The IYR

The French Connection

As with Newmont Mining in the Senor Miners Index GDX, ProLogis is the largest market cap in the Real Estate Index, IYR.

When markets ‘thin-out’, when they reach the end of a long sustained bull move, capital exits the lower caps, the lesser performers, and is thrown into the last man standing; the largest cap(s) in the sector.

In can be argued, that’s where we are now with IYR.

Friday’s Wipe-Out

As expected, because of the near thousand point drop in the Dow, YouTube’s abuzz with everyone attempting to figure out what’s going to happen this coming Monday.

The Maverick does an excellent job (linked here) of posing the question, ‘Where are we’?

He doesn’t even bother with are we in a market collapse; that’s pretty much a no-brainer. It’s the ‘where’ in the collapse, that’s the question.

Real Estate … What’s Next?

From this site’s perspective, we’ll let the market itself tell us what’s likely to happen next.

Since the focus over the past week has been real estate (IYR), let’s look at the largest cap ProLogis PLD, to get clues on the next potential action.

ProLogis PLD, Weekly Chart

First, we’ll look at the big picture.

PLD was vaporized in the last market collapse.

We should also note, it took about 12-years to get back to pre-crash levels; good ‘ol ‘buy and hold’ 🙂

Of course, a multi-year covered call strategy could have been implemented if maintaining long. With that approach, PLD could have potentially become a cash-cow.

Crash Clues

Note on the chart above, PLD didn’t just up and crash; it gave clues well beforehand.

We’ll go into those clues in a later update.

For now, let’s look at next week’s probable action.

ProLogis PLD, Daily Chart

First, the un-marked chart to show where action finished up on Friday.

Next, we see an upthrust, test and sharp reversal.

Price action finished at support and just below the lows set on Monday, the 18th and Monday the 25th.

Wide, high-volume bars tend to get tested.

So, we’re below the lows with a wide high-volume bar. That puts PLD, in spring position.

Summary

Because PLD and IYR (and the rest of the indices) finished at or near their lows, there may be some downside follow-through this coming Monday.

Price action’s the final arbiter but there’s potential for some kind of upside test in the coming week(s).

As a courtesy, the DRV chart below shows the entry location for DRV-22-02 (not advice, not a recommendation) and the current stop.

Note how liquidity has picked up over the last two weeks.

Friday’s volume of 309,800 shares, was the largest ever for the inverse fund.

Stay Tuned

Charts by StockCharts

Note:  Posts on this site are for education purposes only.  They provide one firm’s insight on the markets.  Not investment advice.  See additional disclaimer here.

The Danger Point®, trade mark: No. 6,505,279

Gold To Rally ?

In Position For Upside Test

As long as almost no-one catches on to the Fibonacci time correlations playing out in real time, they’ll continue to have validity.

First, some housekeeping.

The downside action in Junior Miners GDXJ, was a vicious move; from top to bottom (thus far) it dropped over – 17.5%, in just six trading days.

This type of collapse was not really expected as YouTube and ZeroHedge are still filled with the manic bulls.

The short position, JDST-22-04, launched higher as a result.

Taking advantage of the hysteria, that position was closed out today (not advice, not a recommendation).

The expectation is for some type of relief rally in gold and the miners.

Gain on the whole event, which included three entries and three exits was around +24.1%

Moving on to the chart.

Gold (GLD) Daily

We’re at Fibonacci Day 34 and have just slightly penetrated support (blue line).

That puts GLD, in Wyckoff Spring position … although the push below support was not really enough to expect a rally (if it occurs) to go very far.

Today’s action opened up a significant gap and it just so happens, the close of Friday’s bar (April 22nd) is right at 23.6%, retrace.

Stay Tuned

Charts by StockCharts

Note:  Posts on this site are for education purposes only.  They provide one firm’s insight on the markets.  Not investment advice.  See additional disclaimer here.

The Danger Point®, trade mark: No. 6,505,279

Same Then, Same Now … Gold

Common Characteristics

Every market has its own personality, its own characteristics.

After working the gold mining indices GDX, more specifically GDXJ, a repeating trendline tendency was observed in leveraged inverse, JDST.

That repeating market behavior, shown below.

Junior Miners, Leveraged Inverse, JDST

The un-marked daily chart, first

Repeating trendlines

The next several charts zoom-in on specific areas.

Set The Stop

And walk away …

As the tagline in this post shows with JDST-22-04, we’re already short the Junior Miners via JDST (not advice, not a recommendation).

The current stop, is set at yesterday’s low of 6.61.

Depending on price action today, that stop will be moved up to the recent low (presently @ JDST 6.855).

Summary

GDXJ, reversed at Fibonacci 55-Days, 13-Weeks from the January 28th, low.

As presented in this update, we’re also Fibonacci 89-Weeks (+1), peak-to-peak.

Time correlation coupled with price action, along with incessant financial press ‘gold standard‘ narrative, gives a near perfect backdrop for a significant downside reversal.

The trade may or may not work out … price action is the final arbiter. However, we’ve already shown the trend characteristic of the market.

A simple but effective way to manage the trade is to follow that trend, raise the stop accordingly and exit when stopped out (not advice, not a recommendation).

Stay Tuned

Charts by StockCharts

Note:  Posts on this site are for education purposes only.  They provide one firm’s insight on the markets.  Not investment advice.  See additional disclaimer here.

The Danger Point®, trade mark: No. 6,505,279

Gold Miners … Downside Reversal

Wait … What?

A major gold (miner) reversal?

Is that possible?

The last update on the subject highlighted a multi-decade Fibonacci time correlation.

Going all the way back to the 2001 lows for gold, there’s a correlation of 21-years, 89-weeks and 55-days as it relates to the Junior Mining Index, GDXJ.

This past Monday, 55-Days from the January 28th, low, GDXJ, posted a reversal.

The chart below, is an updated version of the one presented on Thursday, the 14th.

Junior Miners, GDXJ, Daily

The bearish MACD has completed with a momentum tick to the downside. Price action reversed exactly at Fibonacci 55-Days.

Getting closer-in, the chart below shows we’re at minor support.

It’s early in today’s session about an hour after the open.

Price action’s already pushing down on the support level, posting a new daily low.

If GDXJ continues lower and decisively penetrates support, the expectation is for some kind of upward test in the next session(s).

For the Junior Gold Miners, GDXJ, we’re at the danger point.

Obvious stop levels for a short position would be yesterday’s high or Monday’s high (not advice not a recommendation).

Summary

With so many convinced gold and the miners must move higher as a result of ‘inflation’, a significant, sustained reversal would be completely unexpected.

Of course, what’s not being discussed (except in alternate media) is the intentional destruction of the food supply and the supply chain.

That’s at least a significant contributor to the rising prices.

Stay Tuned

Charts by StockCharts

Note:  Posts on this site are for education purposes only.  They provide one firm’s insight on the markets.  Not investment advice.  See additional disclaimer here.

The Danger Point®, trade mark: No. 6,505,279

Gold & Silver, Timeline’s End ?

Government, Is Always Last

The laws enacted by the Government to prevent the crash of 1929, were passed in 1934.

So, now we have at least two states (here and here) eliminating sales tax on the purchase of gold and silver.

Where were they way back in 2001, as the metals were bottoming?

Interestingly (then again, not) it’s a Fibonacci 21-years, nearly to the day, from that 2001 bottom.

That’s not the only Fibonacci correlation being observed.

Let’s take a look at Junior Miners GDXJ, and see if it too, has a Fibonacci event.

Junior Miners GDXJ, Weekly

We’re just one week short of Fibonacci 13-Weeks, from the late January 2022, bottom.

One extra week is well within margin of error when considering the 89-Week timeframe as shown.

But wait, there’s more.

Looking at the daily chart, not only is there a bearish MACD divergence, we’re also just one day shy before it’s a Fibonacci 55-Days, from the 1/28/22, bottom.

Junior Miners, GDXJ, Daily

Can it all line up this perfectly?

Well, it can if no one is watching; that’s where the crowd and the government come in.

Summary

It’s a fairly safe assessment, nobody expects a downside reversal … nobody.

Even though time and again, we have clues that opportunity for precious metals may come later not sooner (not advice, not a recommendation).

The lockdowns in Shanghai with subsequent starvation and bartering (here and here), show under such conditions, precious metals are nowhere on the list.

Closer to home, the Texas Freeze of 2021, exposed that (lack of metals demand) as well.

Housing prices are starting to ease-off as well as prices for used cars.

Gold (GLD) may have reached its peak, March 8th, this year. Let’s see what happens next.

Stay Tuned

Charts by StockCharts

Note:  Posts on this site are for education purposes only.  They provide one firm’s insight on the markets.  Not investment advice.  See additional disclaimer here.

The Danger Point®, trade mark: No. 6,505,279

Gold Up … Miners Down

It’s Not A ‘Miners’ Bull Market

Gold (GLD) is hovering near all-time highs but the miners, especially the Juniors GDXJ, are far below.

What better way to show the disconnect than looking at the weekly close charts for both gold (GLD), and GDXJ.

GLD & GDXJ, Combined, Weekly Close

The next chart has been discussed in prior updates but is repeated here for refrence.

The difference is GDXJ’s, now in up-thrust (potential reversal) position.

Junior Miners GDXJ, Weekly Close

Closer in on the weekly candle chart, we have the following repeating pattern, ‘Spring to Up-Thrust‘:

We’re at the danger point where it won’t take much to see if action is to continue higher or reverse.

The case for reversal is shown on the daily below.

Note the energy of the upward thrusts Force Index, is dissipating (black arrow) while the energy on the downward thrusts is increasing.

GDXJ, Daily with Force Index

Summary:

The Junior Miners are not in a bull market and have not been for years.

They never fully recovered after gold’s decline during the 2012 – 2015, timeframe. In the meantime, they may have posted an ‘a-b-c’ corrective (bearish) price action.

Obviously, there have been upward spasms as has just occurred over the past six-weeks.

Now, it appears we’re at the juncture where action has set probabilities to favor a downside reversal (not advice, not a recommendation).

Stay Tuned

Charts by StockCharts

Note:  Posts on this site are for education purposes only.  They provide one firm’s insight on the markets.  Not investment advice.  See additional disclaimer here.

The Danger Point®, trade mark: No. 6,505,279

Gold Price Action, Blows-Up

Trading The Price … Not The Narrative

The narrative and the price don’t agree; at least at this point.

Over and again, we hear it’s ‘dollar destruction’ and ‘hyperinflation’.

Here is a link to one of the latest pontifications on what ‘inflation’ is doing or is going to do.

After watching that, one is so much better informed. Well, at least we know what the bit-players are saying … each reading from their own (pre-approved) script.

Let’s get back to reality and the price action at hand.

We’ll start with this quote from the last update which references shorting the gold miners using JDST (not advice, not a recommendation).

“However, something that can be done is to use that upward bias to position short at the lowest risk possible.”

That’s exactly what was done during this (past) session; let’s start first with the big picture.

Junior Miners GDXJ, Weekly

As a reminder, and for those who may be new, we’re looking for a particular price pattern that has been shown to repeat over time:

Wyckoff: Spring-to-Up-Thrust

Note in the CAT, example in the link above, price-action up-thrusted and then came right back down to support without any kind of an upward test.

Sometimes, it happens that way.

What’s not known of course, is if GDXJ will respond the same way.

Junior Miners GDXJ, Daily

The chart above is a close-up of the action.

The next chart is leveraged inverse fund JDST. It shows the initial entry of what is labeled trade, JDST-22-02 (not advice, not a recommendation).

Trade entry was just as JDST, price had reached its daily low extreme and was backing off higher (GDXJ, lower); right around 1:14 p.m., EST.

Note the tightness of the stop; just 0.24-points.

Summary

Tomorrow’s action could hit the stop, blow (gap) through the stop or continue upward.

It’s unknown.

What we’ll get for sure, is another data point on what’s really going on with the miners.

Stay Tuned

Charts by StockCharts

Note:  Posts on this site are for education purposes only.  They provide one firm’s insight on the markets.  Not investment advice.  See additional disclaimer here.

The Danger Point®, trade mark: No. 6,505,279

Gold, Way Back To 2009 !

That’s How Far We Have To Go

All the way back to late November 2009, to find a bar that’s remotely similar to the one just posted last week.

Even then, there are key differences.

The reversal during the week of November 30th, 2009 was after a breakout and run-up of about 20%; from the resistance/support area around GLD, @ 100.

Last week’s bar was within a trading range not outside it. Also, we had to wait until this morning’s open to get a new weekly low.

Volume (blow-off) characteristics were similar:

Week-ending 11/30/09, volume 93% higher than the week before; week-ending 3/11/22, volume 43% higher than the week before.

GLD, Weekly Chart

The chart gives us a feel for just how far back we have to go to find similar price action.

The prior update said at this juncture, longer term momentum indicators are pointing higher. Thus, suggesting there will be some kind of upward test either today or this week (Fed meeting?).

Junior Miners GDXJ, Weekly

Earlier this month, this post said to expect GDXJ, to up-thrust in the 48 – 50, area.

That’s exactly where we are now.

GDXJ, back then.

GDXJ, now.

There we have it. The repeating pattern of ‘Spring to Up-thrust’

That does not guarantee a downside reversal. It just shows us price action repeats these behaviors; doing so for decades, if not hundreds of years.

What happens now?

Longer term momentum indicators point higher and give the bias to the upside.

However, something that can be done is to use that upward bias to position short at the lowest risk possible (not advice, not a recommendation).

Positioning via JDST

Junior Miners GDXJ, could come back to test the trendline break shown below starting today, through Wednesday.

If it does, the difference between being correct (about going short) and continued bull side action may be narrowed as much as possible (not advice, not a recommendation).

If that happens, the JDST stop will be very tight.

Stay Tuned

Charts by StockCharts

Note:  Posts on this site are for education purposes only.  They provide one firm’s insight on the markets.  Not investment advice.  See additional disclaimer here.

The Danger Point®, trade mark: No. 6,505,279

Gold Reversal … Wait, What ?

Um, … Weren’t We Going To The Moon ?

One hour, and fifteen minutes after this post was released, gold and the miners topped-out.

Depending on the close for today, gold futures prices may post a weekly reversal bar.

If it happens, that’s an important nuance.

The prior reversal from all-time highs … back in early August of 2020, did not happen on weekly reversal bar or even a daily bar.

What does that mean or what could it mean?

Unlike last time where gold (GLD), hovered around its all-time highs for a couple of weeks, this time, it looks like it can’t even do that.

We’re at the danger point.

For the gold tracking fund GLD, the price to watch is Monday’s open at 184.45. Closing below that level, indicates trouble for the bulls.

Gold (GLD), Daily Chart

Twelve months of daily price action shows the build-up, to the blow-off.

Below, we have a ‘measured move’ target completed.

Then, we have a volume climax.

Changing of hands from strong to weak.

Such volume spikes typically indicate the potential for a long-term, sustained reversal.

Contrary View

This analysis isn’t contrary just to be contrary.

We’re looking for market truth. Meaning, ‘what’s the market saying about itself?’

Once that truth is found or at least probabilities identified, then it’s incorporated into a strategic plan.

Go-Forward Strategy

At this point, it’s more than obvious, food and the food supply, is literally going to be the choke-point.

As nations world-wide, scramble to secure reliable food sources, anything can happen. They can even resort to selling-off their gold reserves en-masse, to pay for the insane commodity prices.

Don’t think that can happen?

Well, oil futures couldn’t go negative either, right? Nickel couldn’t surge to record highs on the largest single-day jump ever, right?

London Metal Exchange (LME) would never cancel trades and fudge their numbers, right?

What couldn’t happen then, is likely to happen now.

There’s a chance gold will not post a weekly reversal at the end of this session (currently, 12:53 p.m., EST). If so, it holds open the probability for an upward test or series of tests in the coming week.

Stay Tuned

Charts by StockCharts

Note:  Posts on this site are for education purposes only.  They provide one firm’s insight on the markets.  Not investment advice.  See additional disclaimer here.

The Danger Point®, trade mark: No. 6,505,279