Newmont Mining (NEM) Reversal

Newmont Mining (NEM) is the heavy hitter. 

Newmont’s in the Senior Mining Sector GDX with a market cap that’s equal to the next six mining operations combined.

If Newmont has reversed, the entire sector is likely to follow suit.

At this juncture, that’s exactly what’s happened. 
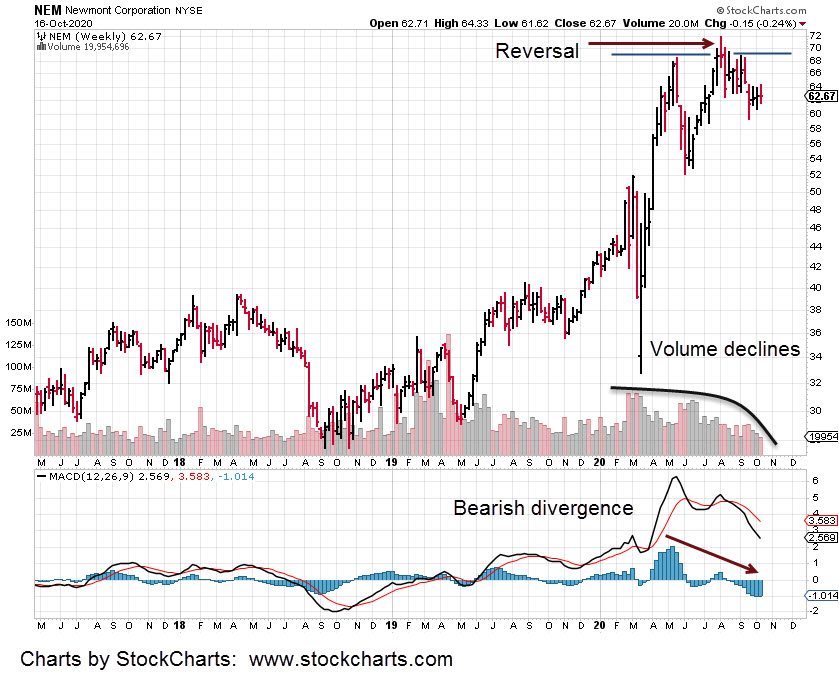
The chart below shows a weekly MACD bearish reversal in-effect.  In-effect means the technical indication is correlating with the price action result.

Newmont appears to have made its high and is now heading lower.

Of course, the gold miners reversing and heading lower is completely opposite the established narrative.

Price is always the leader.  Price action in NEM has probabilities pointed to the downside.

So, how will we know if the direction changes and resumes an up-ward course?  What price level must be reached to negate the current reversal scenario?

Since we’re right at the edge, the danger point, small fluctuations change the outlook significantly.

Recall in a prior update, the quote from Wyckoff that effectively said:

‘At pivot points, price action can go either way.  It’s as if the weight of a feather can determine the next likely direction.’

That’s where NEM is now.  Price action is tight.  The picture changes to the upside if we get a push above last week’s high:  NEM, 64.33.

That’s just 1.66, points, or a 2.65% move from were NEM closed last Friday.
Charts by StockCharts

Note:  Posts on this site are for education purposes only.  They provide one firm’s insight on the markets.  Not investment advice.  See additional disclaimer here.

Trending: Biotech

Today’s action may be in a trading channel.

It’s a Fibonacci eight days from the low of September 4th, to the top on the 16th.

That time correlation, along with the channel hits, help to provide validity to the set-up.

Our short position in the sector has not changed appreciably.  There was a slight backing off yesterday, by reducing the size about one-percent.

However, during today’s action as IBB was making intraday highs (BIS making lows), the short position was increased, via BIS.

In any event, we have a hard stop at the day’s high, IBB 134.85, which is approximately 31.46, on BIS:  Not financial advice, not a recommendation.

As of this post, 7:00 p.m., EST, the S&P 500 futures are trading down about -0.50%, giving the inference that downside action will continue at the next session.

Silver futures have dropped another 4.5% – 5%. Price action’s heading straight down.  Nearest chart support for the SIZ20 (December) contract is around 20.00.

Charts by StockCharts

Note:  Posts on this site are for education purposes only.  They provide one firm’s insight on the markets.  Not investment advice.  See additional disclaimer here.

Silver Freak-Out

It’s all starting to sound like the global warming scam. 

‘It’s only ten years before all the ice caps will be melted’.  Problem is, it’s only been ten years for at least 40-years!

Note:  For a total evisceration of the AGW narrative (or hoax), Tony Heller has done an excellent job.

Which brings us to silver and the boogeyman of ‘hyperinflation’s just around the corner’.  It could be the latest false narrative that’s not panning out.

At some point, the dollar will go to zero.  That’s well understood by anyone with a modest amount of financial knowledge.

It’s what happens before that; that’s what’s important.

Even J. Bravo, is starting to think it may not be a slam dunk to dollar zero.  He had a guest on a while back that got howls of disapproval with his deflation (first) assessment.

Not saying the premise is right.  Just saying when there’s that much of a consensus (hyperinflation), it has a nasty habit of not coming to fruition.

As always, anything can happen.  We could get hit with a solar flare or a massive volcanic eruption throwing everything out of balance.

Matter of fact, both of those are highly likely right along with a near earth miss, asteroid passing within 13,000 miles … tomorrow.

In the meantime, we’ll focus on typical market behavior.

The last update stated:  “Barring any additional upside, the expectation is for price action to retrace and test the wide, high volume chart areas.”

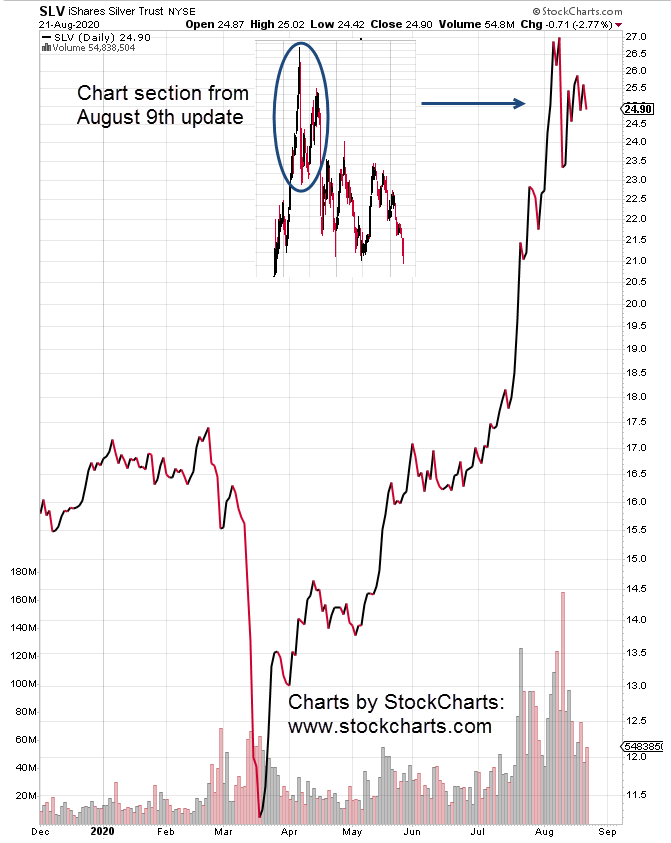
Fast forward to now.  There was just one more blip higher before silver began its correction in earnest.  This is normal and expected market behavior. 

The chart shows there’s potential to go all the way back to support levels at the 17-area.

However, it’s also possible we’ve seen a top and silver’s headed to new lows (time stamp 3:10); That’s completely opposite the consensus and potentially a more likely result.

Charts by StockCharts

Note:  Posts on this site are for education purposes only.  They provide one firm’s insight on the markets.  Not investment advice.  See additional disclaimer here.

Silver Top?

The silver bulls may have been sufficiently trapped.  If so, they’re subject to a beating via reversal.

2017-02-10_6-36-21-border

The markets aren’t friendly and silver’s one of those that never takes prisoners.

As mentioned in an earlier post, even trading genius Ed Seykota (of Market Wizards fame), early in his career, was impaled mercilessly by silver spikes.

As always, anything can happen and some new demand come in to lift SLV higher.

However, when you look at the typical form of a silver topping pattern, it looks like we’re there.

If there’s a caveat, the chart pattern insert is on a weekly basis and the current chart is daily.

Markets are fractal.  Patterns can (and do) repeat at all time-frames.

Barring any additional upside, the expectation is for price action to retrace and test the wide, high volume chart areas.

2020-08-21_15-42-55-SLV-Daily-Close-3-bar-notes

Charts by StockCharts

Note:  Posts on this site are for education purposes only.  They provide one firm’s insight on the markets.  Not investment advice.  See additional disclaimer here.

Is Corn The Catalyst?

Bonds, biotech, the banks; or is it corn that’s the catalyst?

Everyone’s focused on the markets, the S&P 500.

Fotosearch_k8956751Meanwhile, back at the farm (literally), the food supply is undergoing controlled demolition.

If the supply chain continues to be restricted with prices rising ever higher, the silver and gold ‘stackers’, may have to liquidate their hoard just to survive.

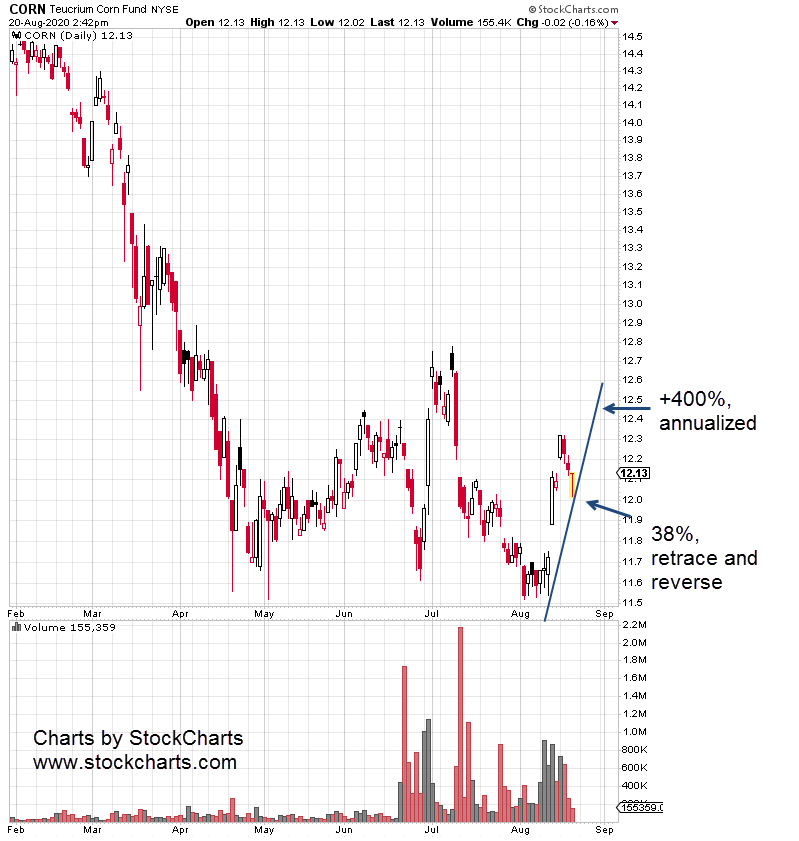
Getting back to corn; the technical position of the ETF, CORN was highlighted yesterday in this post.

Now, with about an hour before market close, CORN has posted a 38% retrace and reversal ( if close is at or above current levels).

On top of that, it may be too early but maybe not.  CORN is now trending upward at over 400%, annualized.

One day, does not a trend make.  Then again, wouldn’t it be nice to know early on of the possibility?

2020-08-20_13-42-53-CORN-Daily-4-bar-notes

Charts by StockCharts

Note:  Posts on this site are for education purposes only.  They provide one firm’s insight on the markets.  Not investment advice.  See additional disclaimer here.

Corn Flattened

Ten percent of the U.S corn crop was instantly wiped out last week during what’s described as an inland hurricane.

The video here goes into more detail about correlating events.

iStock-1019396932

To limit the food supply even further, driving prices higher under the guise of inflation, the ‘speck’ (time stamp 6:00) has invaded 100% of tested agriculture workers in California.

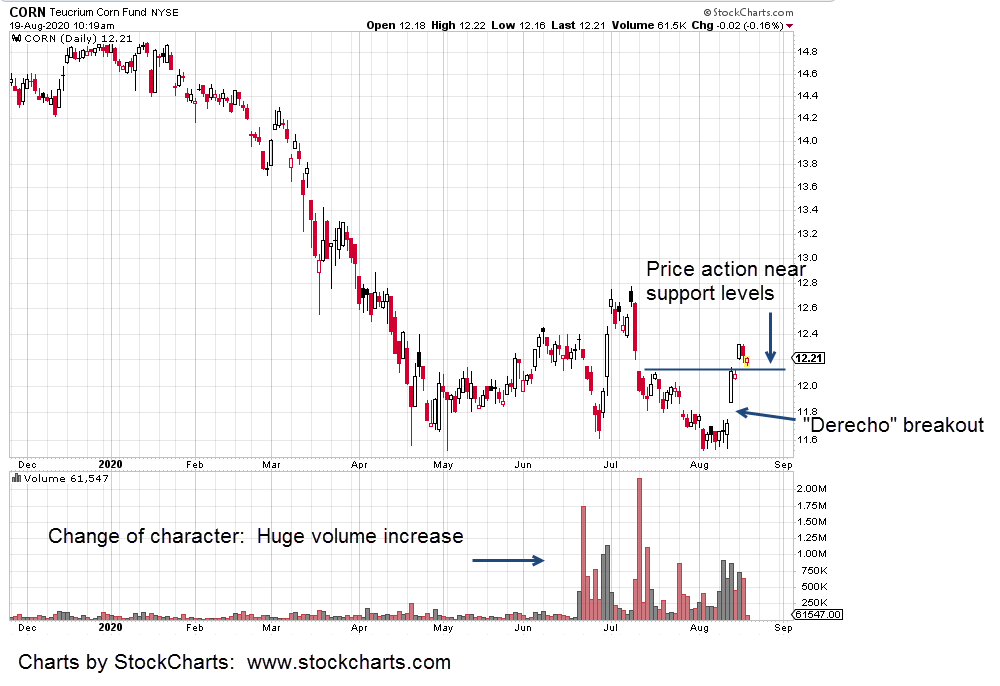
The corn ETF mentioned at Time Stamp, 4:16, in the linked video is shown below:  CORN is the ticker symbol.

The ‘derecho’ breakout is clear.  Currently, CORN price action has retraced slightly and is testing support levels.

2020-08-19_9-20-04-CORN-Daily-4-bar-notes

In separate markets, biotech (IBB) has posted another sell, sell-short signal with this session’s new daily low (not financial advice).

Silver is reversing as expected.

Whether or not this is just the beginning of a long down move to form new lows (for SLV), is unknown.  Of course, such a position or thought is, completely opposite the consensus view.

Charts by StockCharts

Note:  Posts on this site are for education purposes only.  They provide one firm’s insight on the markets.  Not investment advice.  See additional disclaimer here.

Random Notes

Notes for the day … not in any particular order.

Lumber futures:   Prices up over 180% in five months.

2020-08-12_11-40-37-notesInterest rates are rising.  10-yr rates up.  Similar set-up as August, 1987?
Frustration with the mindless herd growing.

Biotech testing yesterday’s move lower.

Moderna (MRNA) has formed a wedge and is near a downside breakout.

Drunk and ‘working’ from home.

Internet censorship:  Oppenheimer Ranch Project no longer monetized.

Silver and gold, future test of new lows?  At time stamp 2:58, Sajad hints at same ‘testing the lows’ scenario as was posted with Silver Up, Then Down on July 25th.


Note:  Posts on this site are for education purposes only.  They provide one firm’s insight on the markets.  Not investment advice.  See additional disclaimer here.

Silver … Straight Up. Now What?

From bottom to top, silver has exploded over 147%, in less than three months.

In the process, a wide high volume trading range has been created.

So, what happens now?

shutterstock_55919800

A likely answer is, go back to silver price action under similar conditions.

That behavior can be summed up as a ‘test’.  It’s the nature of the markets to test wide, high volume, (near vertical) price action.

Just what does test mean?

The financial pundits will typically call this type of action ‘consolidation’, but that’s a misnomer.

A test can pass or fail.  If the silver market retraces from here … or goes a little higher before a retrace, the nature of the retrace price action is important.

Using the SLV chart shown at the bottom of this post, we’ll be looking for how SLV behaves if and when it comes back to the resistance area … which may now be support.

The last update on silver hinted at a potential new low coming some time after the current run.  ‘Some time’, may be months or years.

Let’s step aside briefly and discuss market reality:

Completely contrary to what is espoused in the financial media, money is not ‘at work’ in the markets.  It’s ‘at risk’.

Fotosearch_k0729352

Upon entering a position, any position, a tacit agreement has been made by the new entrant and the other participants.

That agreement is to voluntarily walk into what’s essentially the Roman Coliseum.

The longer you’re in the ring, the more chance you have of being gored, mauled, or eaten alive.

So, how does one minimize that risk? 

The answer is (from this firm’s perspective), wait for the set-up, no matter how long and then move quickly.

Here’s a prior update that’s a good example of how a trade opportunity was identified seven months in advance; then executed for a 155%, gain in just five days.

End of digression

As for silver, it looks like time to wait.  Bullish sentiment at this juncture may (if not already) have reached an extreme.  Price action typically reverses at high sentiment levels.

The SLV chart has two prior reversals identified.  Those reversal actions are similar but not exact.  If silver is to re-test the recent lows, we’ll be looking closely at how it behaves as it returns to potential support levels.

2020-08-08_8-01-01-SLV-Weekly-1-bar-notes

Charts by StockCharts

Note:  Posts on this site are for education purposes only.  They provide one firm’s insight on the markets.  Not investment advice.  See additional disclaimer here.

Dollar Death, Not Yet

The latest financial fad, the ‘dollar destruction’ narrative, appears to be losing steam … at least for now.

shutterstock_536563939

On the other side of the spectrum are the precious metals markets with their ‘all bets are off’, ‘this is it’, narrative.

Of course, it’s a dog pile of expert opinion on the whys of the dollar destruction.

Why not join nearly everyone else on the #MeToo, fiat currency bandwagon?  A safe bet no doubt; we all know how important it is these days to “stay safe”.

So, what’s really going on?

Since this site follows principles laid down a century ago, by Richard Wyckoff, it’s not important to know the “why”.  That reason changes daily if not minute by minute.  The truth behind the move will eventually come out; long after the trend has reversed.

As trading legend Ed Seykota inferred, if you want to make money, fundamentals are essentially a waste of time.

2020-08-06_17-09-41-UUP-Weekly-Force-Index-notesWhat we see is downward thrust energy on the dollar proxy, UUP is declining.  Downward enthusiasm is waning.

Does that mean go long on the U.S. Dollar?  Well, that’s up to the reader.  What is being presented here, is the latest hysteria is at least slowing down or coming to a pause.

As Jeremia Babe reports at this link, were just one or two innings into the greatest financial collapse of all time.  The dollar may go through wild excursions before potentially coming to its long awaited fiat demise.


Charts by StockCharts

Note:  Posts on this site are for education purposes only.  They provide one firm’s insight on the markets.  Not investment advice.  See additional disclaimer here.

Silver Up, Then Down

Let’s take a look at silver’s upside breakout.

First off, silver spikes as seen in the chart below, are nothing new.

shutterstock_6325966

Even trading genius Ed Seykota lamented in his interview for Market Wizards (1989) about getting ‘impaled’ on numerous silver spikes.

It’s just the nature of the very thin market.

For example, as of this post, there are 176,008 silver futures contracts active (Open Interest) out to January 2021.

That compares to 835,037 active gold futures contracts for approximately the same time-frame.

So, at this point, the gold market has over 370% more active futures contracts than silver.  Silver is indeed a thin market; therefore lending itself to radical (spike) moves.

The spike lower in March and then higher over the past week, is quite evident.  However, if we pull out and look at the big picture, there’s trouble ahead for the bulls.

2020-07-25_12-38-36-SLV-Weekly-1-bar-landscape-notes

On the SLV chart is a massive multi-year resistance zone in the 23 – 26, area.

Not only that, it’s a 38.2%, Fibonacci retrace of the entire down move from the top in April of 2011, to the bottom in March this year.

Thus, price action itself implies that silver (SLV proxy) is still in a bear market.

The chart allows for the probability of further downside action once the upside objectives are met.  We can see a hint of that downside objective (circled) as somewhere below the 2009, lows.

Of course, expect the market and analysis hysteria to ramp up as (or if) SLV approaches the 25-area.

If or when that happens, we’ll be looking for clues that a reversal is imminent or if by some other measure, “this time is different”, suggesting that silver will continue higher.


Charts by StockCharts

Note:  Posts on this site are for education purposes only.  They provide one firm’s insight on the markets.  Not investment advice.  See additional disclaimer here.