Beginning next week, we’re about to find out if Intel (INTC) is on track to be a ‘penny stock’, by year-end.
Stocks trading below $5/share, are technically called ‘Penny Stocks‘, and mostly ignored by institutional money.
Dystopian Hell: The Stage Is Set
INTC, has already cut the dividend by 66% (note the symbolism) and is ‘conserving cash’.
A large part of their operation with 18,600 employees, is just outside Portland, Oregon.
Here’s a recent look at Portland, uploaded two months ago.
‘Gee honey. Let’s take the kids and move to Portland … Not.’
Incredible, that ‘Speck Protection’ is STILL being pushed (time stamp 2:11). How would you like to work at a location at this late date, where it’s normal to wear a mask?
All of this brings us to the chart. The price action itself defines the next likely course (Wyckoff).
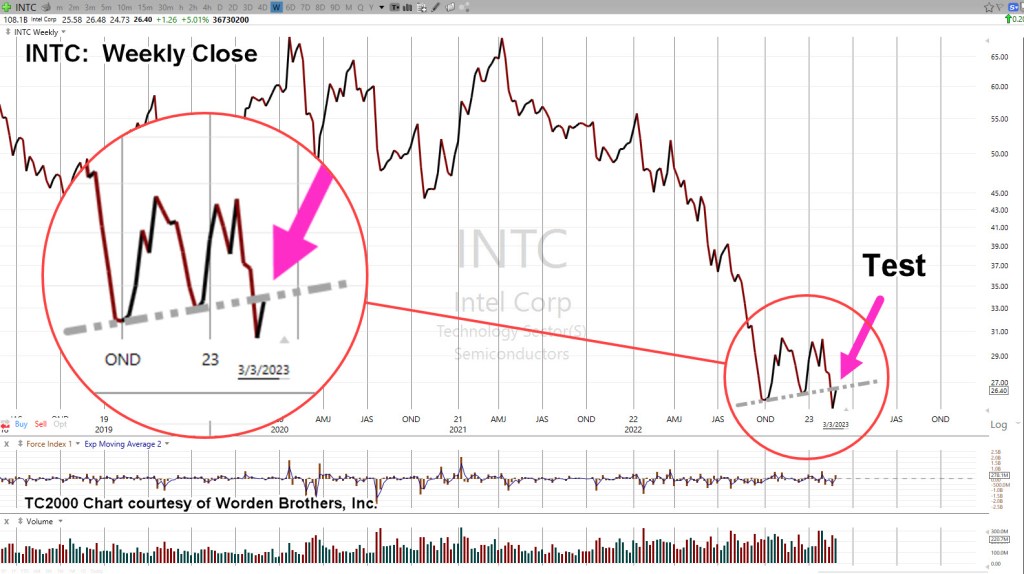
Intel INTC, Weekly Close
Last week closed testing underside resistance and potential right-side trend line contact (second chart).
Compressing the chart and expanding the downside scale, gives us the following.
Just in case anyone’s skeptical about ‘channels’ not being a real potential, here’s the latest look at Carvana (CVNA).
Carvana CVNA, Weekly Close
It’s important to note, not only the channel but the location of “No P/E”, which was the release of this post.
Carvana never closed higher after December 11th, 2021.
Intel, What’s Next?
Will it be the same for Intel?
Of course, that’s not known. Price action itself is the final arbiter; at this juncture, it’s at The Danger Point®
This is where the risk is least (not advice, not a recommendation).
If price action moves significantly higher from here, let’s say 5%, then we’ve likely bottomed and are heading into a rebound.
If not, and Monday, opens and closes lower, it may be a confirmation of the right-side trend line and potential trading channel (not advice, not a recommendation).
Note: Posts on this site are for education purposes only. They provide one firm’s insight on the markets. Not investment advice. See additional disclaimer here.
Note: Posts on this site are for education purposes only. They provide one firm’s insight on the markets. Not investment advice. See additional disclaimer here.
With today’s heavy downward action, as we head into the close, any number of scenarios could play out.
Work has already been done on INTC, KMX, MRNA, Biotech Leveraged Inverse LABD, and others.
With such a decisive push lower, there could be some kind of short covering late in the session.
For example, as of this post 2:15 p.m. EST, KMX (detailed below) appears to be coming off the day’s lows.
CarMax Weakness
The daily chart has KMX, right a the bottom of a trading channel.
Price action may continue to rebound from this area heading into the close or not.
If there’s a rebound, naturally Put options will begin to decay in value … a desired outcome if one is looking to enter short (at the cheapest price possible).
The bottom of the channel line could be all there is for this week or we could be heading to much lower levels.
It’s up to the trader/speculator to decide (not advice, not a recommendation)
Note: Posts on this site are for education purposes only. They provide one firm’s insight on the markets. Not investment advice. See additional disclaimer here.
Intel’s a dog … and has been for a very long time.
How do we know that? The price action itself, tells us.
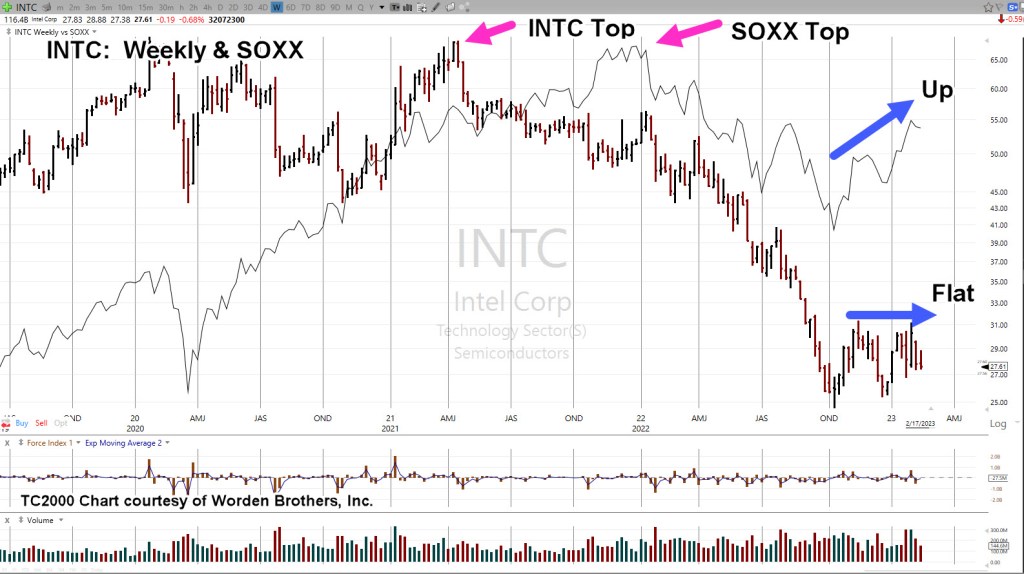
Looking at the weekly chart of INTC, overlaid with the SOXX (thin black line), it’s clear, things literally went south for INTC, right around April, of 2021.
Intel reversed while the sector, the SOXX continued higher.
It’s what happened next, that’s important.
Intel INTC, With SOXX, Weekly
Note how the SOXX has rebounded since mid-October last year while Intel has remained flat.
Even with all the market manipulation to keep the major indices trending higher, having the public thinking ‘the consumer is strong’, INTC has languished.
This lack of upward price action in a rising market, indicates significant weakness.
Has Intel reached a bottom? This is the ‘dip’, isn’t it?
As always, anything can happen and INTC, could launch higher from here. However, it’s not likely.
It’s a juggernaut and at the moment, heading lower.
All of which brings us to the set-up: Options trade to the short side.
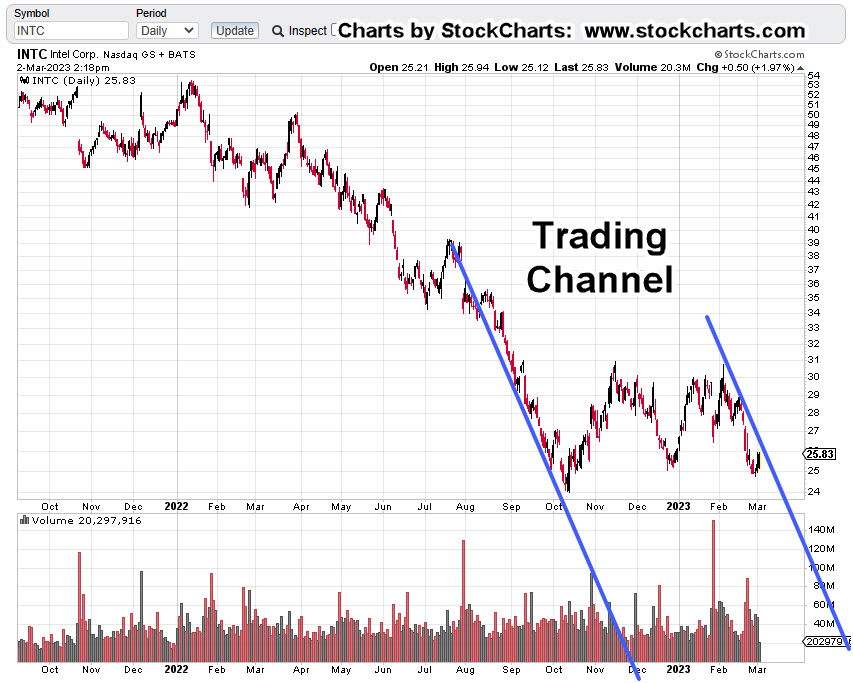
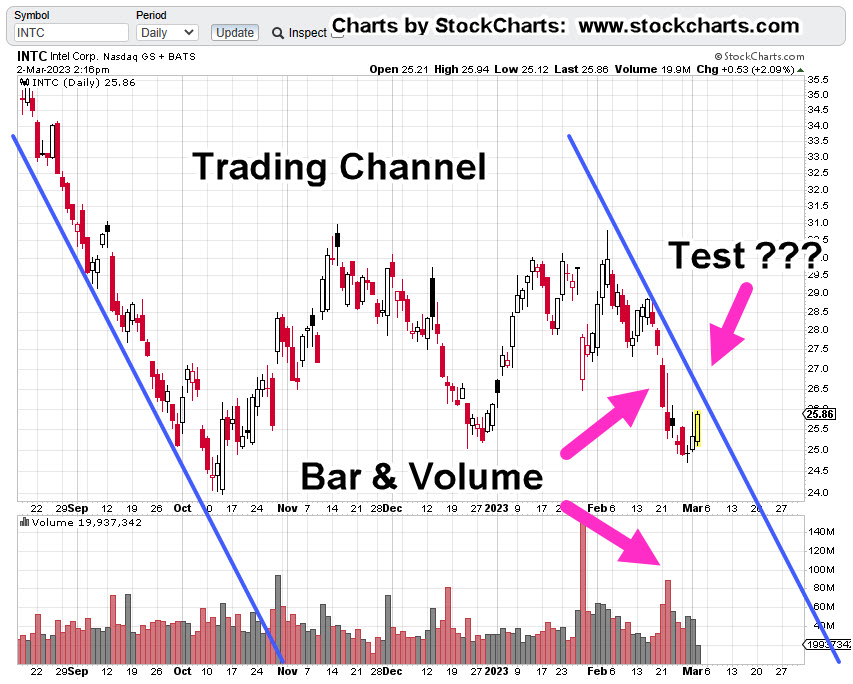
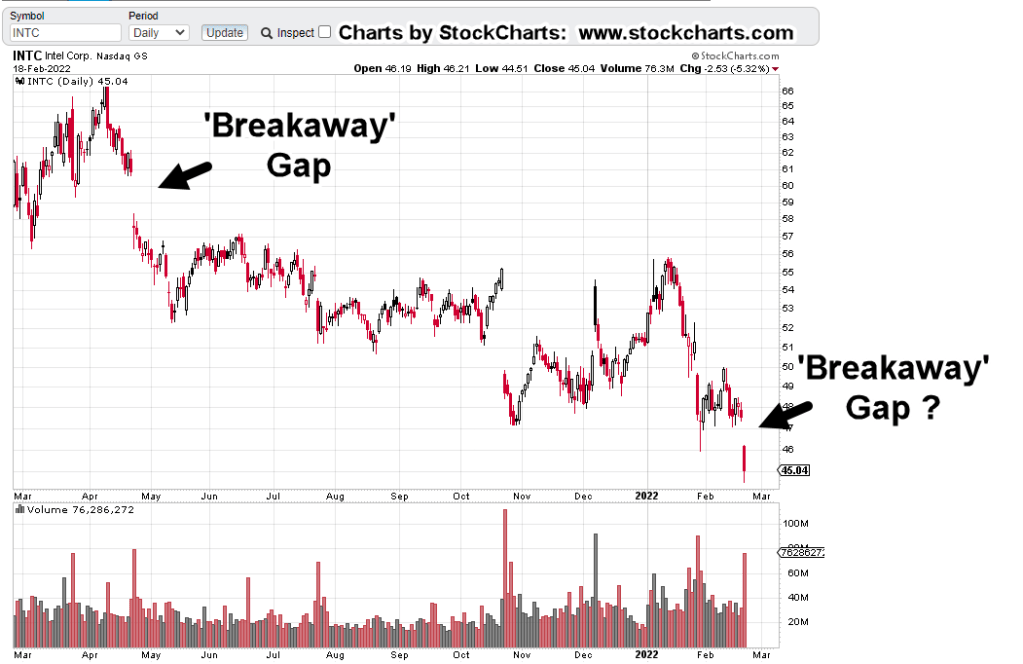
Intel INTC, Daily
For a viable Put trade, at least two criteria need to be met (with downtrend already established) and those are: Option time bleed, and what’s called ‘price instability’ or a ‘test’.
The daily close of INTC, shows a prior set-up (‘Test’) and now, at the far right of the chart, forecasted action.
A possible time for the ‘test’ if it occurs would be this coming Wednesday as that makes it ‘Day 13’ from the high on February 3rd.
That day would also coincide with the Fed minutes being released at 2:00 p.m., EST.
Note: When Fibonacci time counts are involved, it was determined years ago (by my firm), when the U.S. market is closed for a holiday and the rest of the world markets are open, it can (and sometimes does) count as a Fibonacci trading day.
Therefore, with world markets open this Monday, and the U.S. closed, it may still count as a Fibonacci trading day.
That in turn, could make this Tuesday ‘Day 13’ (not advice, not a recommendation).
Note: Posts on this site are for education purposes only. They provide one firm’s insight on the markets. Not investment advice. See additional disclaimer here.
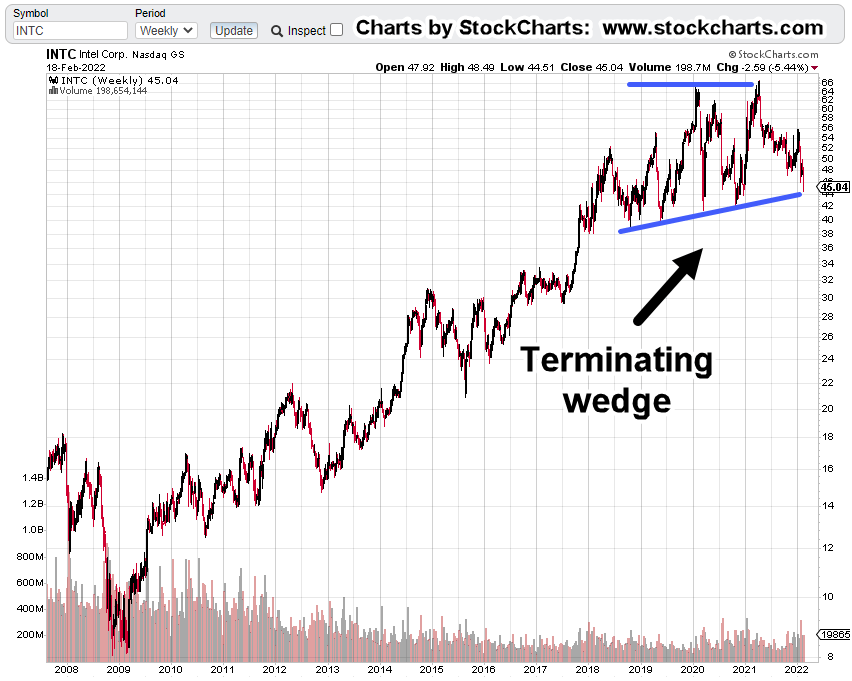
A massive four-year top, along with the latest ‘road-map‘, has this one going down; most likely, for good.
While other chip makers, have gone to near stratospheric levels such as Nvidia, with its 23,960% gain from 2009, lows, Intel has languished.
The rest of the markets, S&P, Dow, QQQs, have pushed on higher while INTC, has spent the last four years, in a trading range.
A sideways market is a bear market.
Intel never recovered its luster after the Dot-Com mania of the 2000s. Price action spent eight years heading sideways-to-down before bottoming out in early 2009.
After that, it’s been a long struggle to current levels.
Now, the markets have reversed and the economy’s collapsing. We’ve likely seen market highs that won’t be repeated in the lifetimes of anyone reading.
Friday’s announcement may be the kick-off for sustained price action to the downside.
INTC, Chart Analysis
The daily chart shows at least one breakaway gap and possibly two.
The next chart is on the weekly timeframe and identifies the long, multi-year, topping pattern.
When looking at these patterns, be reminded about the scale of what’s happening.
This wedge is massive … at least four years in the making.
Note: Price action finished the day right at the lower support. There could be a rebound on Tuesday (market’s closed Monday) or we could just keep going lower.
The SOXX Connection
Intel’s fifth in market cap of the SOXX, with Taiwan Semiconductor (TSM) at the top of the list.
Even the leader TSM, may not be immune to trouble.
Here are Fab locations for Taiwan Semi, located just off the coast of mainland China … nothing bad going to happen there, right?
In the case of the ‘wave’ analysis, if it proves correct, we’re possibly in for a sustained ride lower.
The daily chart of SOXX, shows each analysis point where a reversal lower was projected.
It’s clear from the chart and documented links, both methods nailed it … to the day.
Elliott was earliest and caught the exact point of inflection.
Wyckoff caught the test of the up-thrust.
Here’s the important part:
Wyckoff is a practical, bread and butter method. It looks at what the market’s saying about itself … is price action showing pressure to the upside or down?
Elliott Wave looks at where the market could be or is going.
If we’re really in an Elliott Wave Three down, it’s likely to be a decline like no other.
There are other indicators not market related, giving us hints, a massive collapse is ahead.
A Decline of ‘Biblical’ Proportions
Warning:
The following contains scriptural references.
Those who are in ‘it’s all a myth and fairy tales’ crowd, feel free to scroll to the ‘Summary‘.
For the rest of us, the secular world calls it ‘systems collapse’. The spiritual world calls it ‘judgement’.
Stated many times on this site, ‘the church’ is corrupt. Here’s just the latest salvo proving that point.
Along with the corruption, we now have the strong delusions prophesied over 2,000 years ago.
In reference to a Stew Peters broadcast, linked here, on the numerous media lies, is this comment (emphasis added):
“The only people to blame for this Stew are the ones who put on the mask, who distanced, who took the shot, who harassed other people and who advocated for my freedoms being taken away. Without doing five minutes of research.”
It’s not too much of a stretch to say, those who voluntarily injected themselves were (or are) in a place of delusion.
“And for this cause God shall send them strong delusion, that they should believe a lie:”
However, the injections are no lie … but the reasons for those injections are false.
Can this (spiritual assessment) really connect with what’s happening in the markets? How does it relate to actual price action?
Obviously, it can’t and shouldn’t be said that any specific price movement has been prophesied.
However, we can use the scriptural references to point us to the probability of events; the big picture, the situation at hand, the signs of the times.
The probability that we’re at some kind of major inflection point of Biblical proportions, seems exceedingly high.
Summary
Both Elliott Wave and Wyckoff Analysis, support the probability of lower prices ahead for the SOXX.
Because Intel (INTC) has been a laggard in the sector for years, suggests it may be one of the downside leaders.
As if to confirm the assessment we’re past the pivot, that generational highs have been reached, we have this just out, on ZeroHedge.
At the very bottom of the article, is a quote.
No, they’re not quoting from the King James Bible of 1611; they’re quoting from Shakespeare’s Richard III, of 1594.
Note: Posts on this site are for education purposes only. They provide one firm’s insight on the markets. Not investment advice. See additional disclaimer here.