If it’s frustrating for the bears, it’s got to be frustrating for the bulls as well.
Pulling back and looking at GDXJ action without emotion, it’s clear we’re still in the ‘test’ (as we’ll see below) that’s been the topic of discussion over the past several updates.
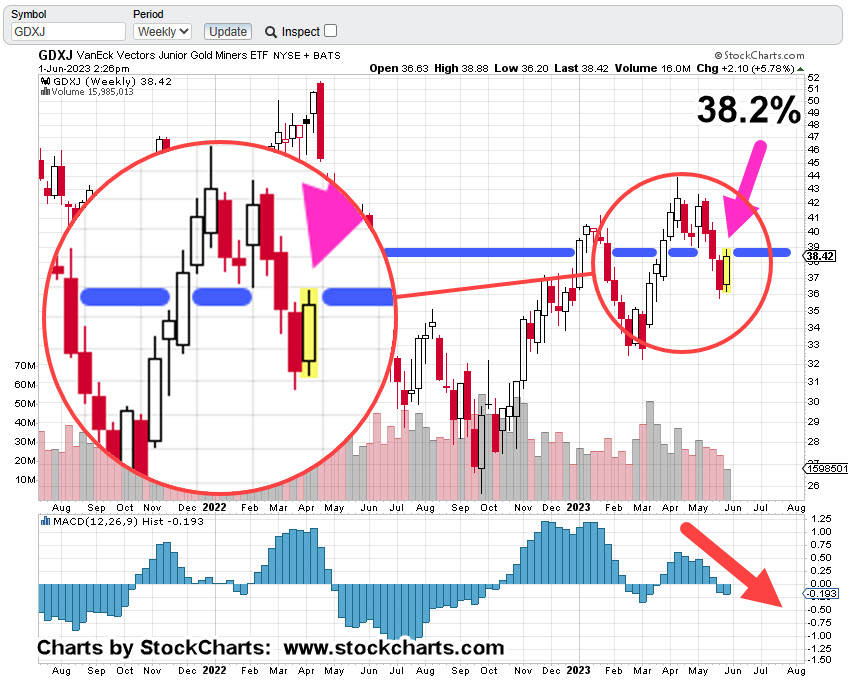
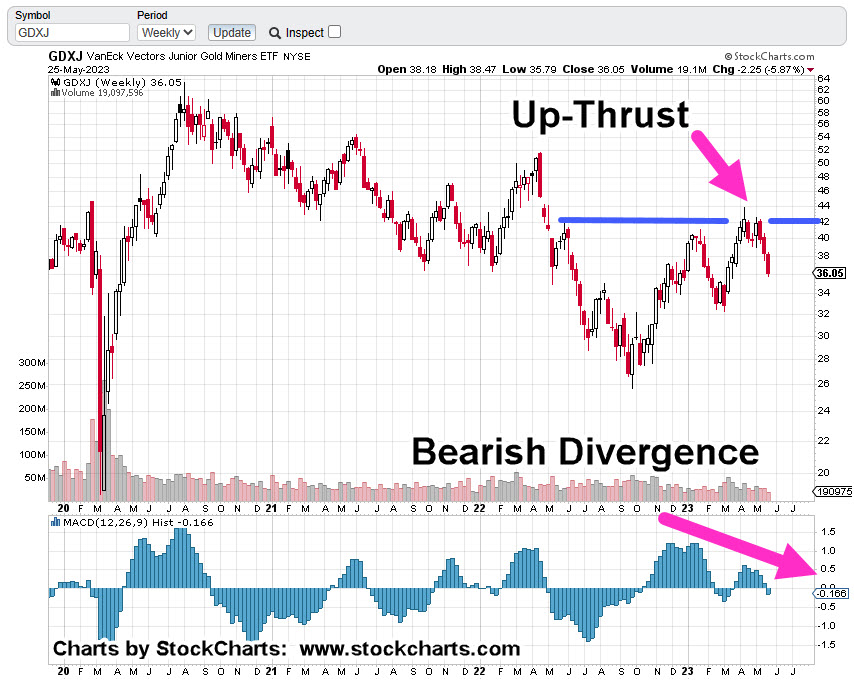
The weekly chart of GDXJ, shows that even with today’s (as of 3:04 p.m., EST) retrace and test, we’re still in a negative divergence on the MACD (orange arrow).
Junior Miners GDXJ, Weekly
The horizontal blue line is not only an axis/resistance line, it’s also the Fibonacci 38.2% retrace of the GDXJ down move, April 13th, to May 25th.
We’re about an hour before the close and price action’s starting to erode from the highs.
If the downtrend is to continue, this may be a low-risk area for the shorts via JDST (not advice, not recommendation).
Note: Posts on this site are for education purposes only. They provide one firm’s insight on the markets. Not investment advice. See additional disclaimer here.
The ‘Artificial Intelligence’ (AI) clown show’s in full swing with a ‘predicted‘ single quarter target of $11-Billion, from NVDA.
That’s not to be confused with the budget clown show just ended in Washinton D.C.
And where does that leave Tesla? They seem to be left out of the latest round of cult-like insanity.
Back in the day, Dr. Alexander Elder stated, professionals don’t look for the ‘challenge’ in the markets (trying to figure out the NVDA, top), they look for the ‘money’ … there’s a huge difference.
Junior Miners GDXJ, Weekly Candle
As of 12:35 p.m., EST, from a technical perspective, even though we’re up for the day (so far), MACD momentum’s increasing to the downside (magenta arrow).
Nobody seems to be paying attention to gold and silver; all eyes are focused on the next shiny object.
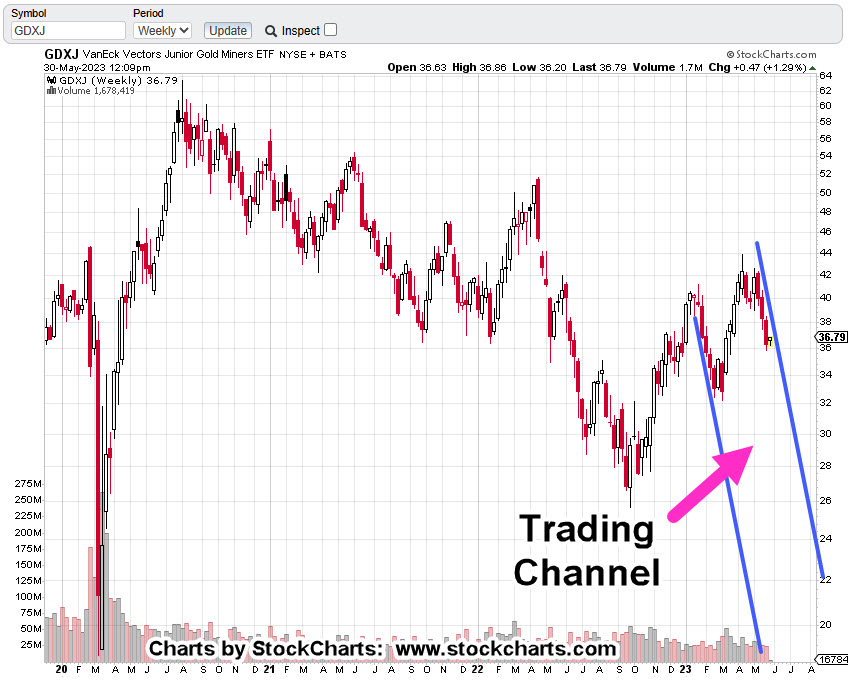
Pulling out a bit farther on the weekly, there’s no question we’re in a channel.
The question is, are we (GDXJ) going to say in that channel or reverse from here?
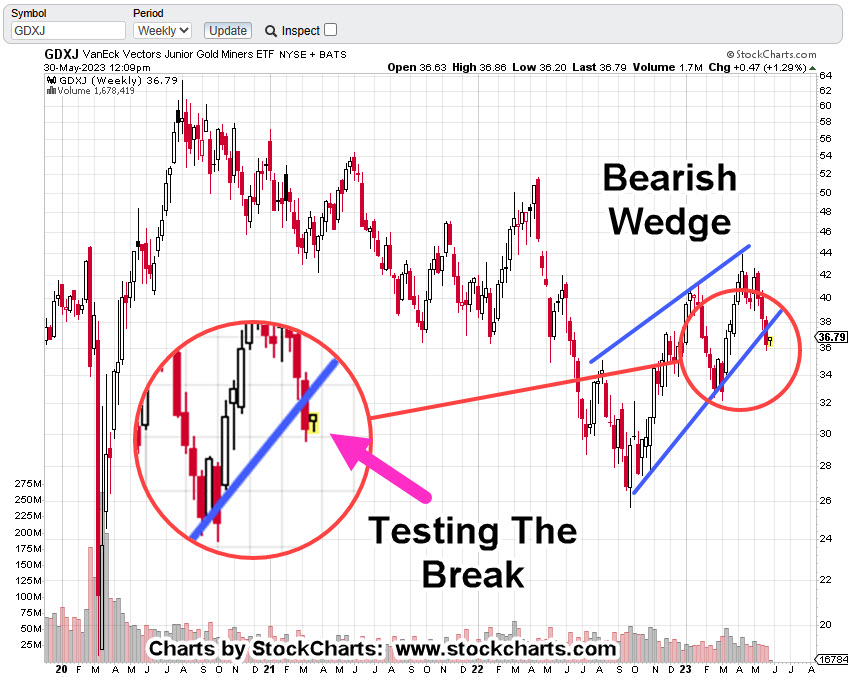
The last update said we’d likely be testing the wedge break and that’s what’s happening.
A ‘test’ will take however long is needed. It’s either pass or fail. Pass in this case is resumption to the downside.
Technical conditions (MACD, wedge break) favor the downside (not advice, not a recommendation).
In addition, we need to keep in mind there’s a new circus in town; the miners may be well on their way to more downside before anyone steps out of the big-top to notice.
Note: Posts on this site are for education purposes only. They provide one firm’s insight on the markets. Not investment advice. See additional disclaimer here.
For the current down-leg starting April 14th, the lowest risk point to go short the miners (via JDST) was at this post (not advice, not a recommendation).
Did I do that?
No, but I did the next best thing.
That was, aggressively position short at this post (not advice, not a recommendation).
An initial position was opened via JDST on May 15th with a hard stop at the session low; that position was doubled in size the next day when it was obvious, we’re in a reversal.
Too Late?
What happens now?
We’re about fifteen minutes before the regular session and GDXJ, looks to open slightly higher.
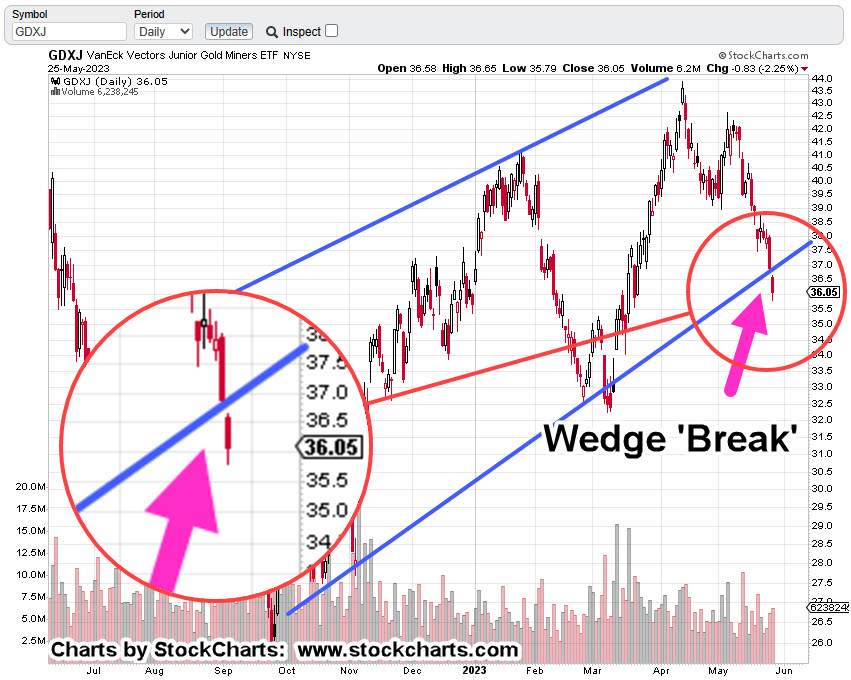
The Daily Chart of GDXJ below shows a penetration of the wedge with the market in position to test that break.
Junior Miners GDXJ, Daily Candle
The zoom moves in closer to show the detail.
Note: The last push below the wedge trendline resulted in a reversal higher. Will that happen this time?
If we use the ‘rule of alternation’, that what happened last time is not likely to happen this time, probabilities favor a test and continuation to the downside (not advice, not a recommendation).
Is this an entry opportunity? Maybe.
Is it as low risk as the prior two pivot points? Probably not.
Then again, the bulls may be stunned at this point and usure what to do. Therefore, huge short positions may not (yet) be in play that don’t need to be squeezed out.
Note: Posts on this site are for education purposes only. They provide one firm’s insight on the markets. Not investment advice. See additional disclaimer here.
Dutch government puts the death knell on their economy … others will likely follow.
While the i-phone crowd is so easily distracted with AI and NVDA being their savior, back at the ranch, economies are being systematically destroyed.
Besides copper, one of the best indicators of robust economic activity is silver (SLV).
Since January, this site has highlighted the potential for a significant, sustained reversal in the precious metals; specifically, gold and silver.
Now, both the charts of GLD, and SLV, have weekly bearish MACD divergences (not shown); having just crossed the zero line with one more trading day to go.
Using a recent weekly bearish divergence as an example, natural gas (UNG), shows us the possibility; UNG is now down – 82%, (at the lows) in just 37-weeks.
Junior Miners GDXJ, Weekly
If gold and silver decline relentlessly from here, the sector most likely to take the biggest hit, is/are the ‘Juniors’, GDXJ.
Once the public figures out en masse, they’ve been fooled into ‘stacking’ instead of securing their food supply, precious metals are likely to accelerate to the downside (not advice, not a recommendation).
Note: Posts on this site are for education purposes only. They provide one firm’s insight on the markets. Not investment advice. See additional disclaimer here.
You would think with all the handwringing, mental machinations, ‘debt ceiling’, we’re all going bankrupt, YouTube gold grifters et al, gold (GLD) would be in a monstrous rally.
Instead, we have what appears to be exhaustion and non-confirmation.
Gold (GCM23), is the only monetary metal (gold, palladium, platinum, silver) anywhere near its all-time highs.
Old-timers would call it a huge non-confirmation. The other metals are not on board with the ‘inflation’ narrative.
Time and again, we’re back to actually reading price action and having it tell us what’s real, not the mainstream.
So, trading ‘kabuki’ seems to be straightforward; just read the chart. Here’s one explanation from an unlikely source on why that simple task is so difficult: absolute, total, unrelenting focus.
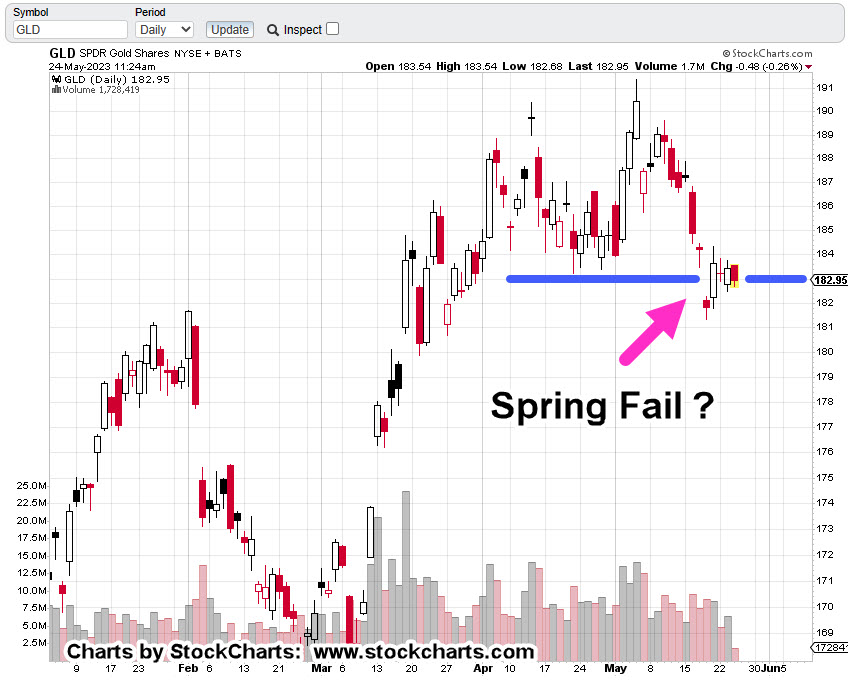
Gold (GLD), Daily
When we look at gold (as of 12:05 p.m. EST), from a technical standpoint, it’s in Wyckoff spring position; a set-up to move higher.
The difference in this set-up as opposed to the one on November 3rd, of 2022 (not shown), price action’s ‘hugging the lows’ as David Weis used to call it.
We’re not springing higher.
The miners on the other hand (GDX, GDXJ) have already made their decision, moving decisively lower during this session (not advice, not a recommendation).
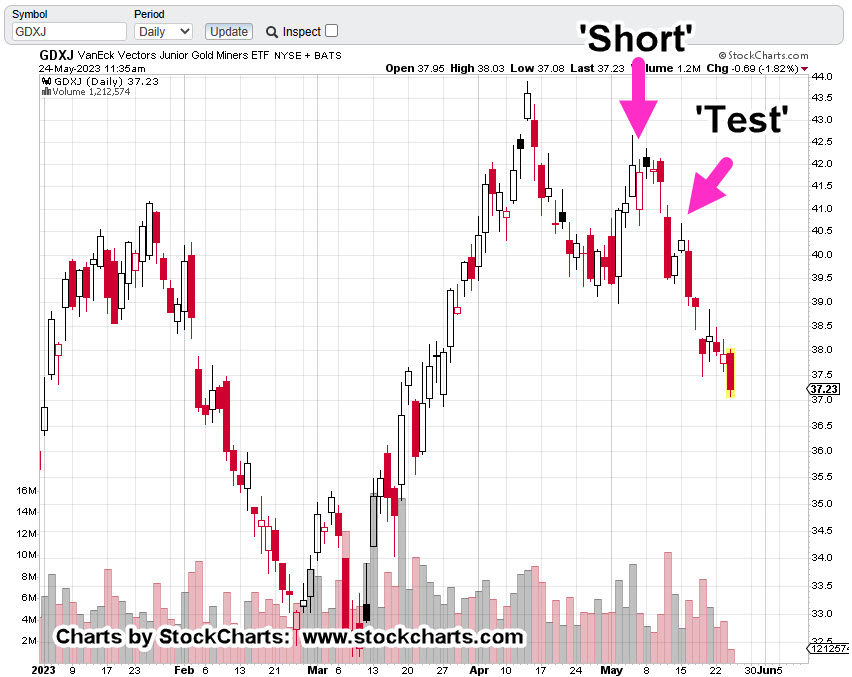
Junior Miners GDXJ, Daily
The chart below has two locations identified.
The first is this post identifying GDXJ, as a potential short opportunity.
The second is this post identifying the ‘test, reverse’ of the up-thrust with high probability of more downside (not advice, not a recommendation).
We can see the result.
Even though gold (GLD) had declined modestly with silver (SLV) more-so, the mining sector appears to be responding dramatically to the downside.
This ‘elevated metals, miners collapsing’ potential has been discussed previously.
Now, it appears that strategy is coming into play (not advice, not a recommendation).
Note: Posts on this site are for education purposes only. They provide one firm’s insight on the markets. Not investment advice. See additional disclaimer here.
If gold does not go higher, it’s because of ‘manipulation’, right?
The typical YouTube gold grifter acts like manipulation is a new discovery.
It’s the ‘go-to’ excuse when their forecasts don’t work out.
Way back in the early 1900s, Wyckoff discovered the market has always been manipulated.
His insight was, it’s up to the speculator to figure out the objective of the manipulation and then act accordingly (not advice, not a recommendation).
Livermore knew about manipulation and even engaged in it himself. He looked at things in a slightly different way; meaning, what is, not, what should.
A very key difference.
So, let’s look at what is happening with gold (GLD), and where it may head from here.
It took gold (GLD) several weeks to labor higher on ever shortened thrusts before finally exhausting itself and rolling over into a reversal … where we are now.
Is price action hesitating before heading higher or is this a significant downside move in the making?
It probably won’t be long before we have the answer.
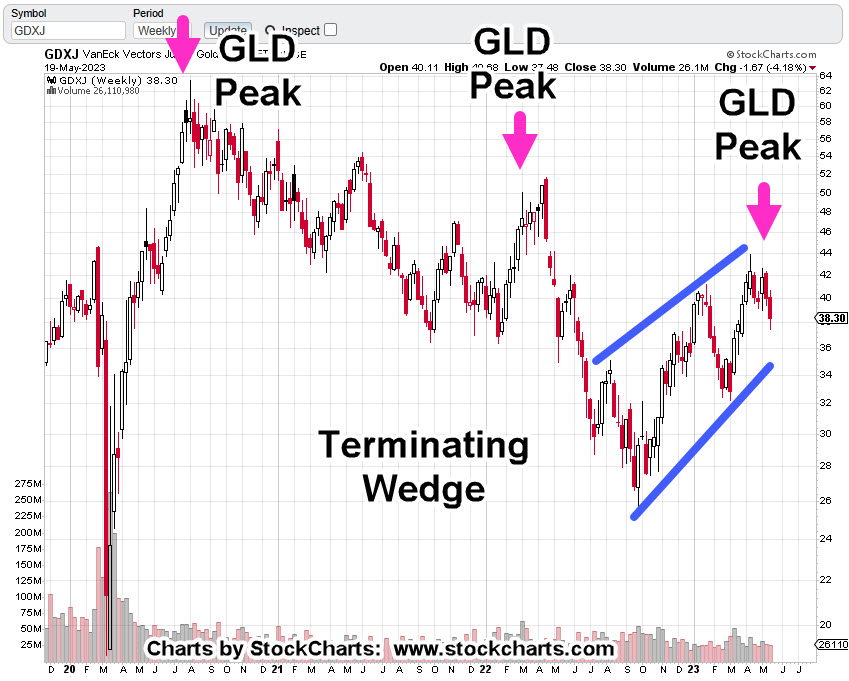
Junior Mining Sector GDXJ, Weekly
The gold mining indices GDX, and GDXJ, have already made their decision, reversing to the downside.
Note: Each reversal from a gold peak in the Junior Sector GDXJ below, is at significantly lower levels. This is not gold miner ‘bull market‘ behavior (not advice, not a recommendation).
It’s clear, the Junior Miners are in a bear market …
The GDXJ, is completing or has completed what is an obvious bear flag or terminating wedge.
Unless price action shows us differently, this is the current assessment; lower prices ahead (not advice, not a recommendation).
Fundamentals
From a fundamental standpoint, where’s the demand for inedible (possibly fake) metal going to come from? The consumer’s already tapped-out and borrowing money just to buy the weekly groceries.
Maybe something else is going on.
Something else that’s causing precious metals miners to anticipate another huge (economic) move lower.
Possibly completely unrelated (in a way) to the mining sector … maybe yet another ‘Speck’ event, shown at time stamp 3:40, at this link.
At the same link, time stamp 5:25, we’re back to the food supply … yet again.
“And all countries came into Egypt to Joseph for to buy corn; because that the famine was so sore in all lands.”
Note: Posts on this site are for education purposes only. They provide one firm’s insight on the markets. Not investment advice. See additional disclaimer here.
If this is the ‘big one’ that everyone’s talking about, the miners have a long way to go to the downside (not advice, not a recommendation).
When there’s a viable, bearish (or bullish) divergence, then price action has the potential to go much farther and the move last much longer than anyone would expect.
Junior Miners GDXJ (as well as GDX), have posted a bearish MACD divergence on the weekly time frame … very significant.
That divergence is shown below:
Junior Miners GDXJ, Weekly Candle
Price action goes one way (i.e., up) while MACD goes the other … down.
Other posts have already covered details of the current set-up, now reversal, links here and here.
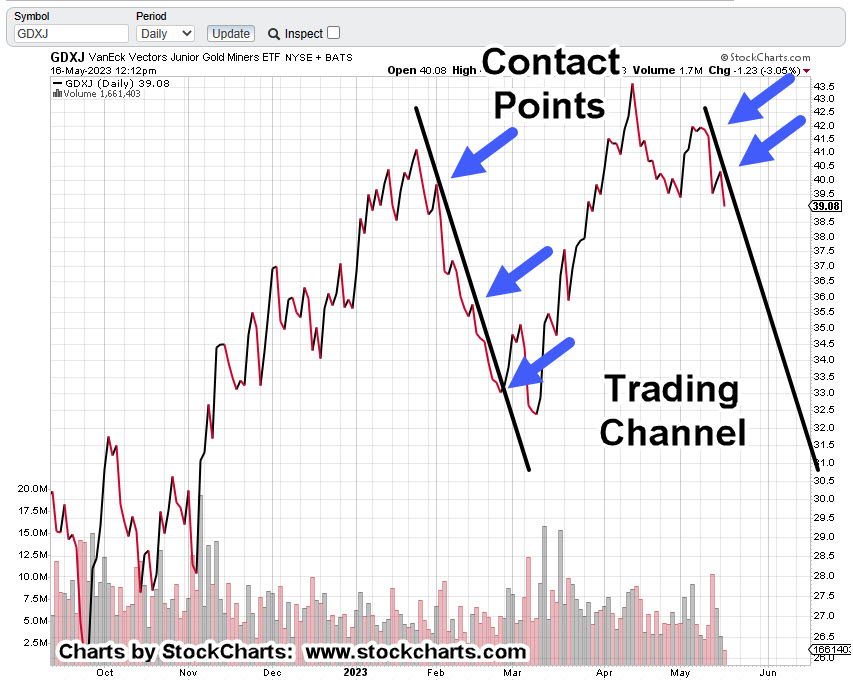
Not covered yet, is the apparent repeating trendline and potential trading channel.
That is shown on the daily close chart of GDXJ, below:
Junior Miners GDXJ, Daily Close
At the minimum, on the right side of the chart we have a down trendline. An upside break of this line would negate any short positions … (not advice, not a recommendation).
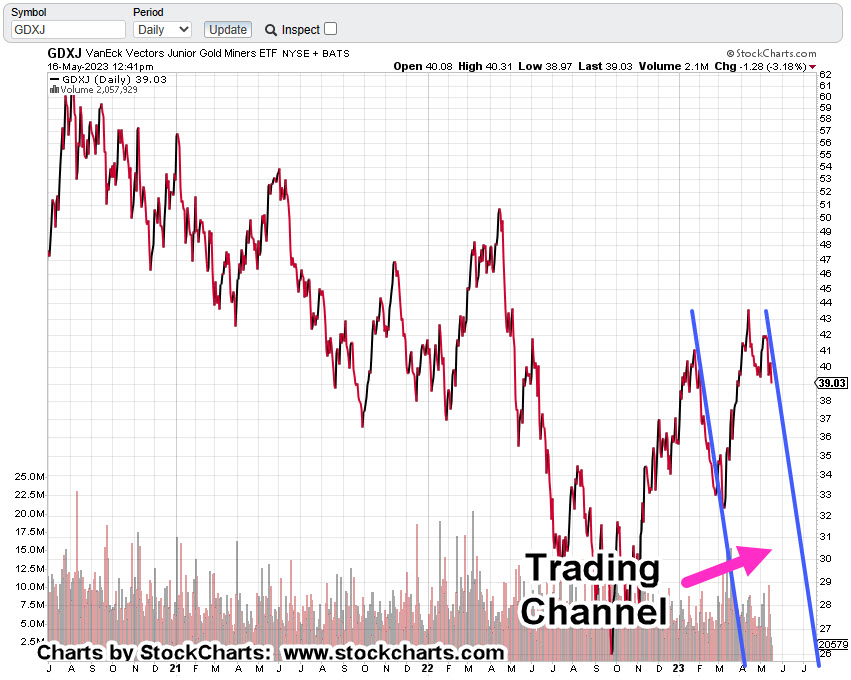
The compressed chart of GDXJ (below), shows the potential.
As of this post (12:57 p.m., EST) GDXJ, continues to move decisively lower. Gold (GLD) and silver (SLV) have reversed to the downside.
Gold’s reversal potential has been discussed previously here, and here.
No one expects a significant reversal in gold …. no one.
Note: Posts on this site are for education purposes only. They provide one firm’s insight on the markets. Not investment advice. See additional disclaimer here.
The last update on the Junior Gold Miners GDXJ, said they were hanging by a thread.
That update even included a forecast which turned out to be wrong and right at the same time (not advice, not a recommendation).
The miners have reversed … it just did not happen the next day as shown on the forecast chart.
The decisive rejection of the resistance (and test) level happened four days later.
Today, continued a slight retrace of that down-move as shown on the daily close chart below.
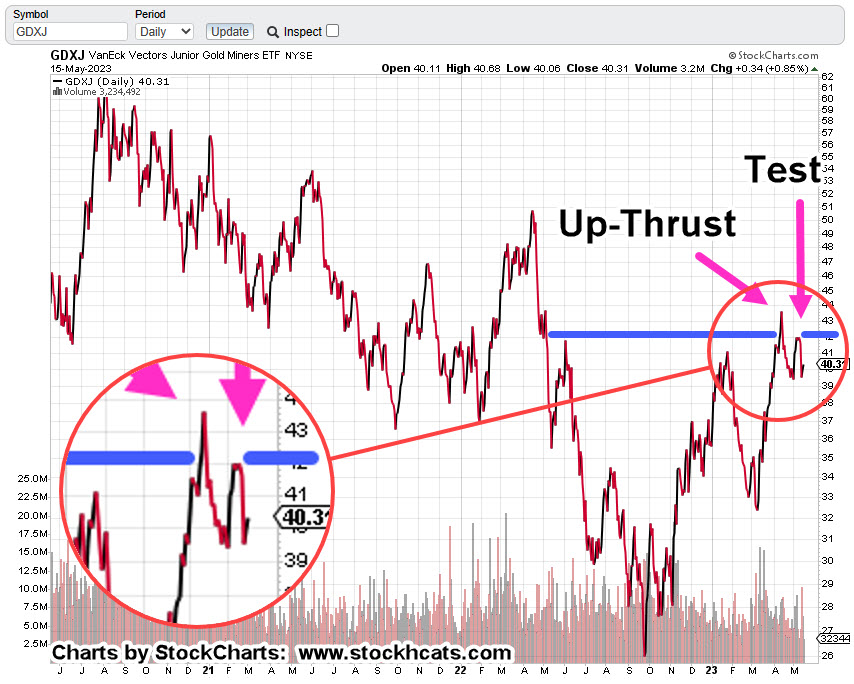
Junior Miners GDXJ, Daily Close
The attempt to push above known resistance (blue line) has failed. Price action had a false breakout (Wyckoff Up-Thrust), then a test and subsequent failure of that test.
The zoom of the reversal area shows more detail.
Last Friday’s session closed higher as did today … however today’s volume (i.e., commitment) was down – 49.4% when compared to the prior session.
The buyers are pulling back … price action is drifting higher.
On a weekly basis, we still have a bearish MACD divergence (not shown). Probabilities at this point indicate lower prices ahead (not advice, not a recommendation).
Note: Posts on this site are for education purposes only. They provide one firm’s insight on the markets. Not investment advice. See additional disclaimer here.
We’re not in Kansas anymore and to expect things to operate ‘normally’, is a strategic error (not advice, not a recommendation).
The last update on Nat-Gas, specifically the futures, warned of new lows before a significant reversal:
“The Nat-Gas futures contract for May (NGK23), needs to post above 2.383 soon (in the next day or so), or the contract is at risk of pressing to new lows.”
Well, we’ve moved on from the May contract to the June contract and that contract indeed posted a new low this past Friday, the 5th.
Just Because …
Just because nat-gas is down, does not mean that it has to go up. That type of thinking is another error, typically called a ‘mind trap‘.
A better way to think about the situation, is to figure on a ‘disruption’ of some type, resulting in either a destruction of supply or excess demand over the usual conditions for the season (weather) at hand.
So, let’s see if the charts agree with that premise from a Wyckoff analysis standpoint.
Nat-Gas UNG, Weekly
Each significant downward thrust is becoming shorter in net distance traveled.
The horizontal blue lines tell the story. We’re nearing the end of the down move (not advice, not a recommendation).
Now, on to the daily. Price action penetrated support and has reversed … it’s in Wyckoff ‘spring’ position.
Natural Gas, UNG Daily
Of course, what happens next is the question.
Just as this post said we’d revisit it towards the summertime, showing there’s no Fed ‘pivot’, we can also propose there’s likely to be a severe disruption in the supply of nat-gas (not advice, not a recommendation).
Housekeeping & The Junior Miners, GDXJ
The expected lower open in the GDXJ did not happen.
So far, it’s been a narrow range day (as of 10:47 a.m., EST).
Price action is oscillating around unchanged and there appears to be no urgency to move either direction.
Standing on the sidelines for now (not advice, not a recommendation).
Note: Posts on this site are for education purposes only. They provide one firm’s insight on the markets. Not investment advice. See additional disclaimer here.
If we’re at the downside pivot for gold and the miners, there’s only one right answer for the next market session.
That answer is:
Lower open, lower high, lower close.
Not advice, not a recommendation.
However, it is an assessment of where we are in the market cycle for gold and the miners.
The focus is on the Juniors GDXJ, as they are the weakest of both gold GLD, and the Seniors GDX.
If GDXJ, does not open lower, there’s something else happening; that would mean the downside reversal potential is in question and/or it could morph into more testing at the Axis Line, previously discussed.
Here’s a close-up of the sector.
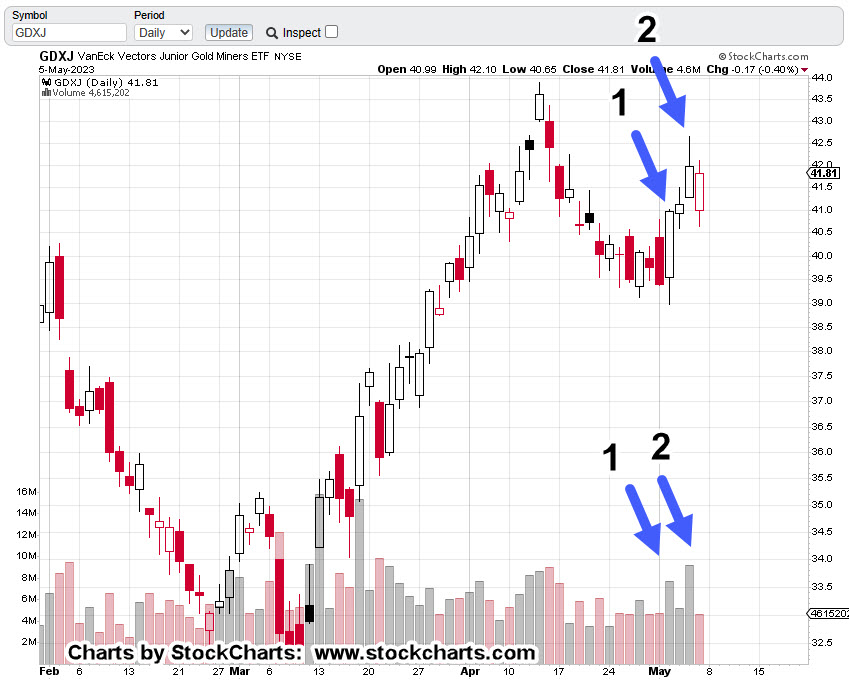
Junior Miners GDXJ, Daily
Volume bar No. 1, corresponded with a solid up move for that session; shown as Price Bar No. 1.
Volume Bar No. 2, is where it gets interesting.
Specifically, higher volume, more narrow range (net distance) and a close well off the high.
Wyckoff called this: ‘effort vs. reward’.
Lots of effort (volume) with less reward (distance) than the previous move.
The next session confirmed that assessment by opening gap-down and then spending the entire day attempting to close higher … which did not happen.
That day (last Friday) may have been short covering. If so, we’re about to find out.
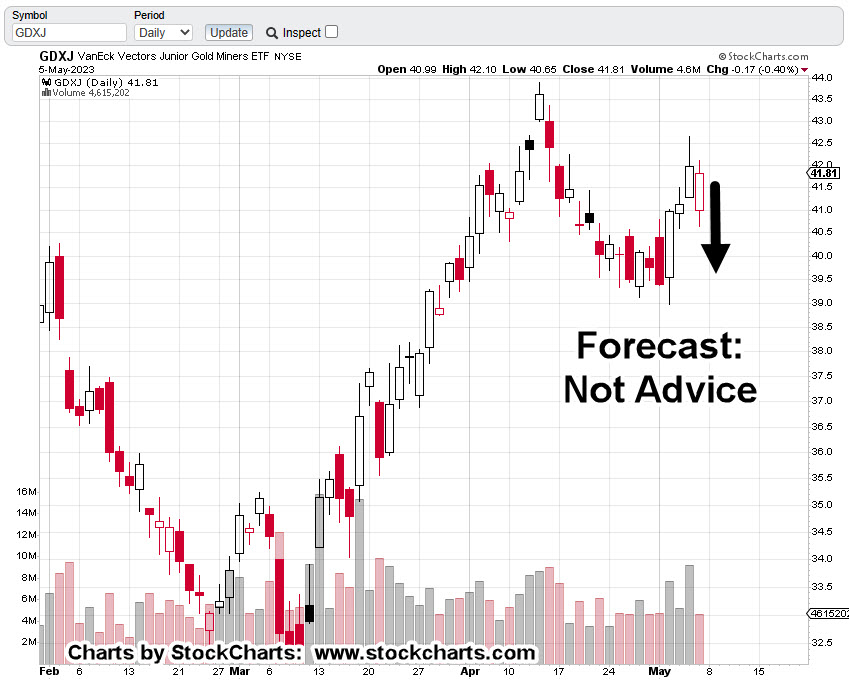
Junior Miners, GDXJ, Daily (forecast)
If we’re in a reversal (a big if), then we’ll get some variation of the price bar (black arrow) as shown (not advice, not a recommendation).
For the bearish option to remain intact, GDXJ needs to open lower and close lower for the day.
However, it does not need to post a new daily low, although that would help the case for more downside.
Anything other than what’s just described, would indicate a more complex price action environment.
Note: Posts on this site are for education purposes only. They provide one firm’s insight on the markets. Not investment advice. See additional disclaimer here.