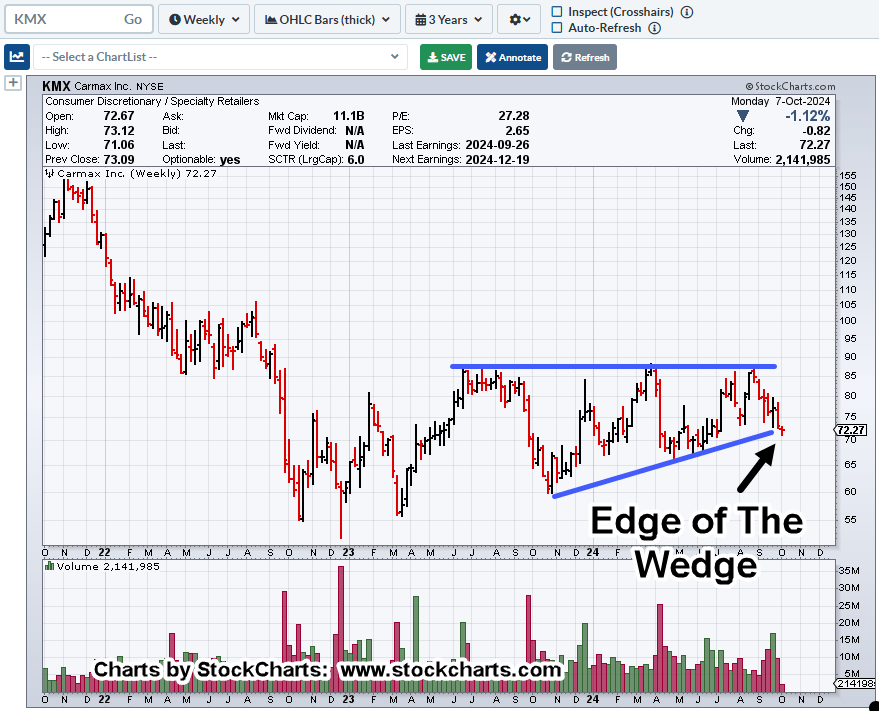
Massive Wedge Pattern

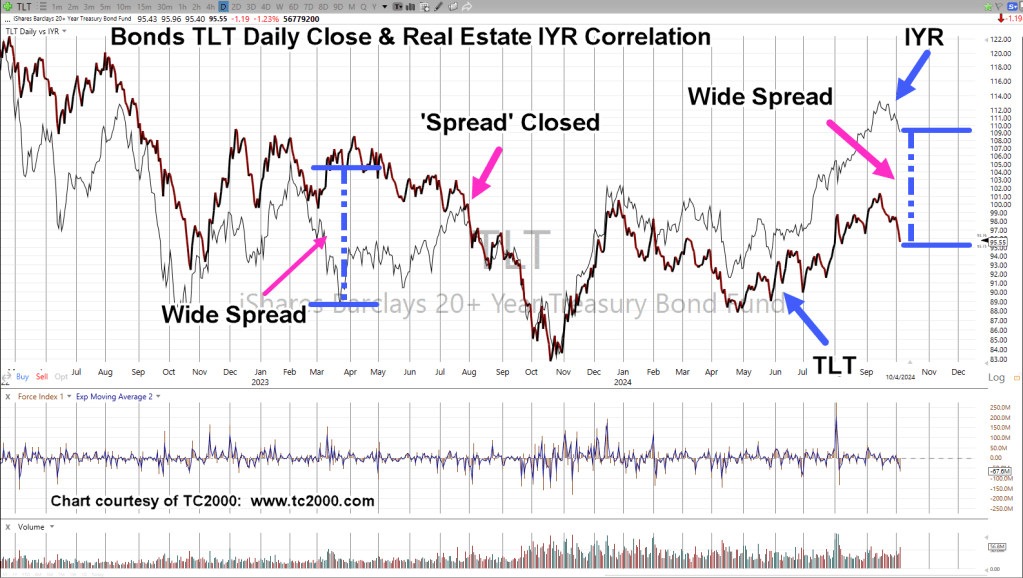
Bonds (TLT) reversed on 9/17/24, the day before the Fed ‘cut’ and never looked back.
Rates continue to rise.
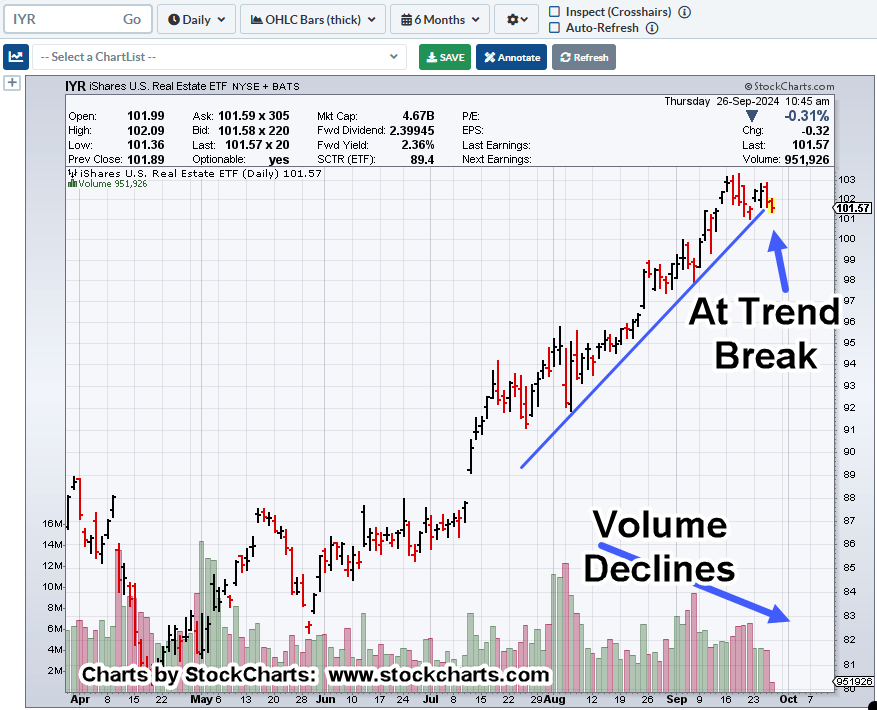
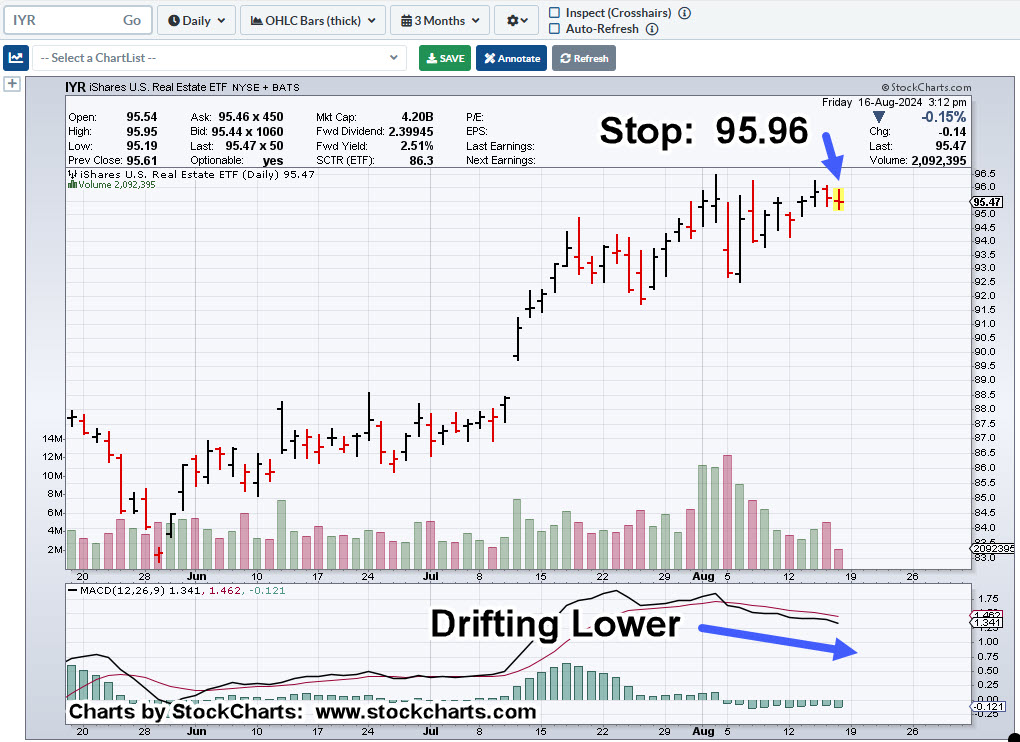
Meanwhile, real estate (IYR), has been whistling past the graveyard; that is, until now.
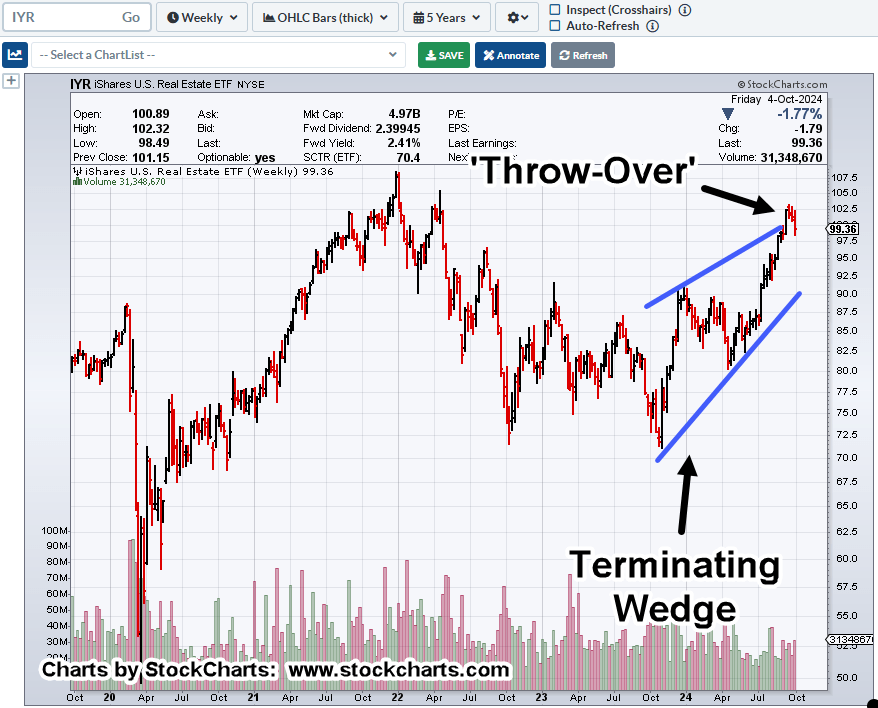
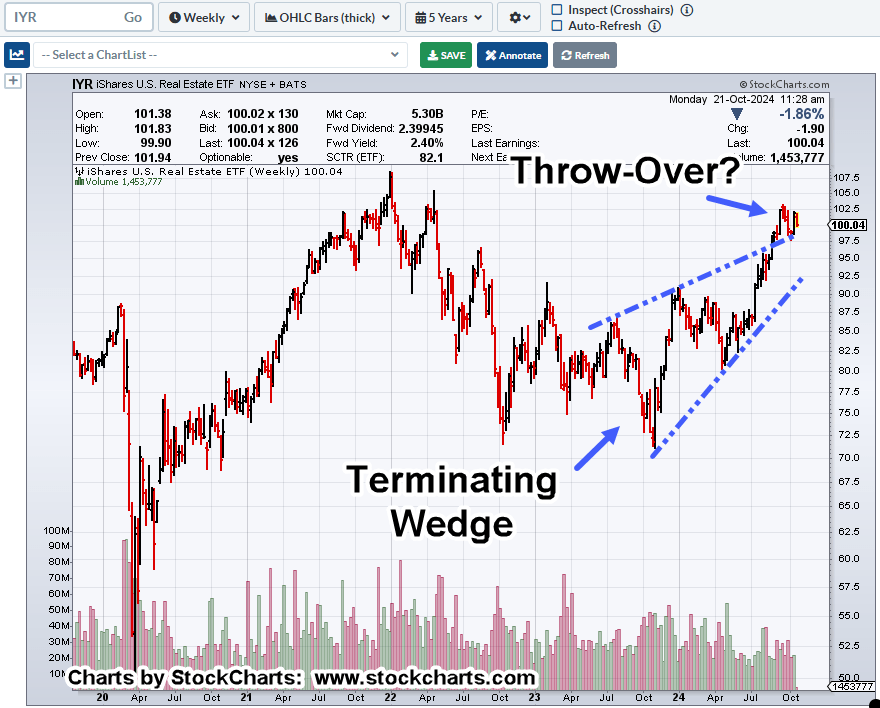
Real Estate IYR, Weekly
If the wedge is in-effect and we’re in a throw-over about to return into the pattern, it signals a very bearish condition (not advice, not a recommendation).
Even the illustrious financial press is starting to catch on that something’s not quite right. 🙂
Of course, you have to ‘subscribe’ for information like this.
As for this site, the current (bond) reversal was first identified and discussed, here.
Back then …
“Looking at the Fed calendar, link here, it’s a very interesting date; ‘the day after’ November 5th.
Let’s see if the ‘rate cut’ is immediately reversed (not advice, not a recommendation).”
Stay Tuned
Charts by StockCharts
Note: Posts on this site are for education purposes only. They provide one firm’s insight on the markets. Not investment advice. See additional disclaimer here.
The Danger Point®, trade mark: No. 6,505,279