Downside For Both?

The ‘bubble’ is obvious, Artificial Intelligence.
The ‘beast’, not so much, but revealed below.
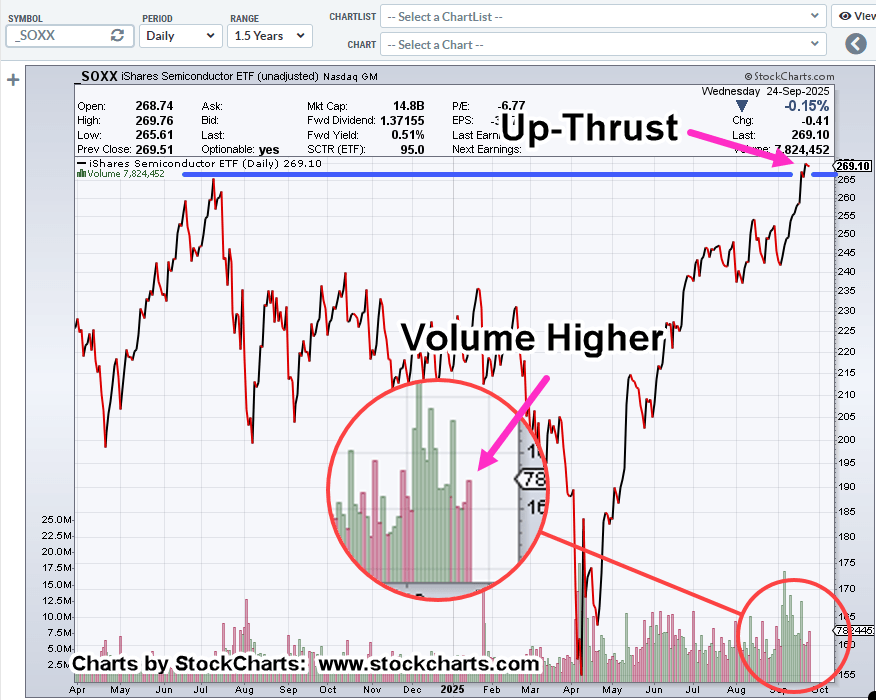
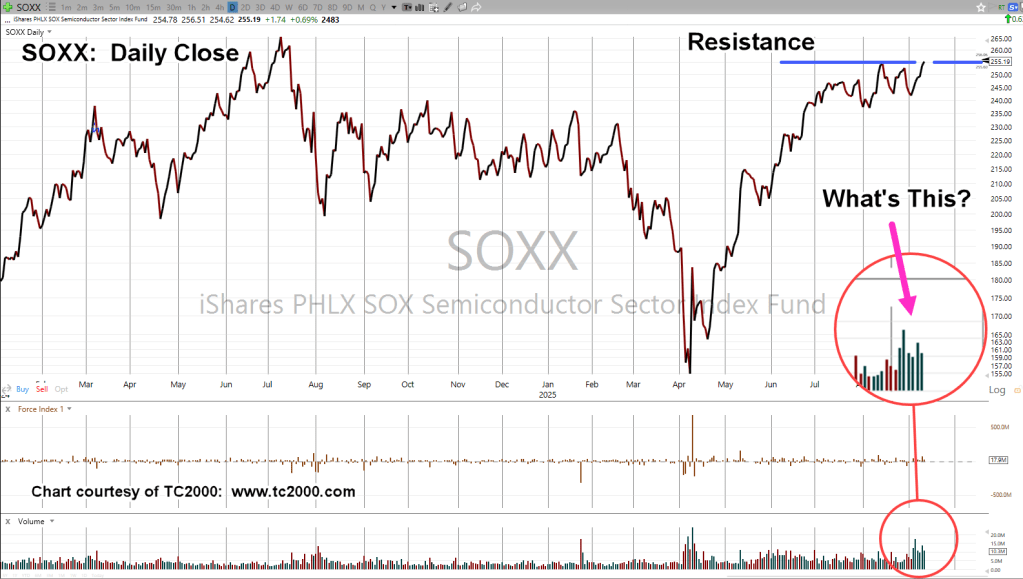
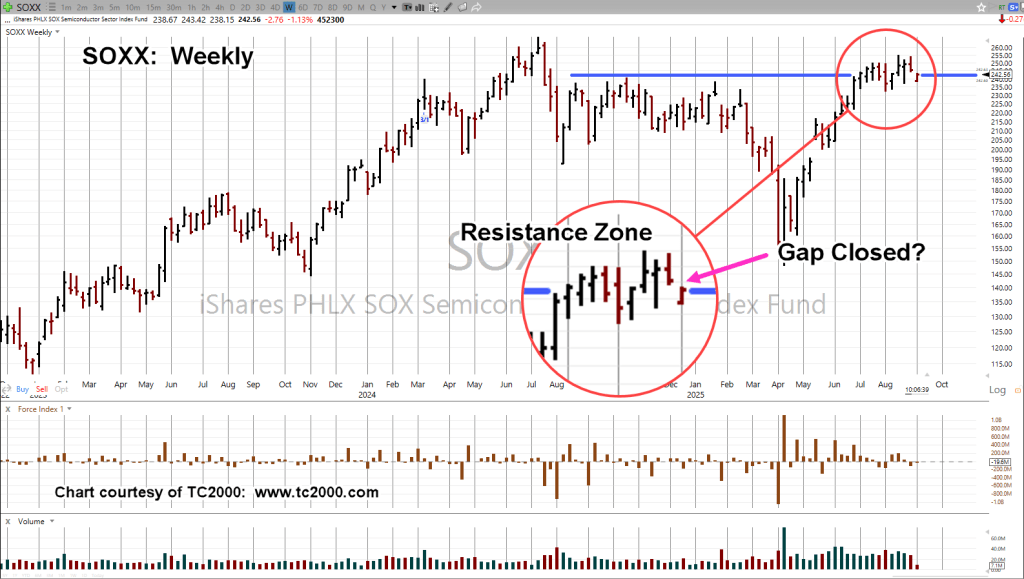
The last update, presented a case for the SOXX top, a proxy for A.I.
Note: If the SOXX, has made its final high, it’s still very early in the reversal:
Wyckoff said a century ago, ‘It’s as if the weight of a feather can move the market in either direction’.
That’s where we are now.
For biotech (IBB, XBI), different forces are at work.
Biotech IBB, Weekly
The 38.2%, retrace from 9/19 high, to 9/25 low, is in the vicinity of 140.90 (magenta dashed line).
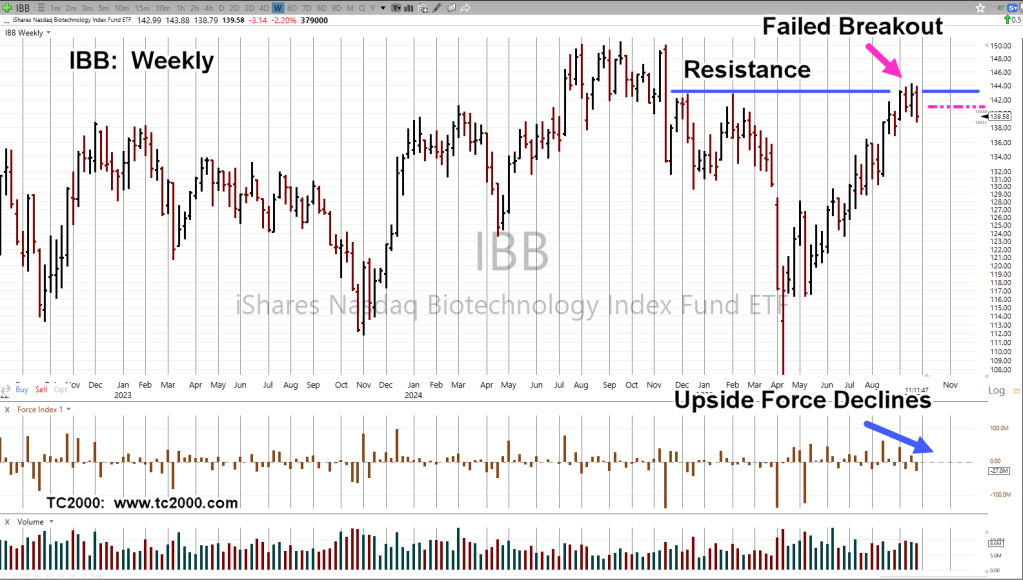
Fridays are typically biased to the upside.
There’s a possibility IBB, may test (upward) throughout the session, heading to (at or near) 38%, by the end of the day (not advice, not a recommendation).
Stay Tuned
Charts by StockCharts
Note: Posts on this site are for education purposes only. They provide one firm’s insight on the markets. Not investment advice. See additional disclaimer here.
The Danger Point®, trade mark: No. 6,505,279