Note: Posts on this site are for education purposes only. They provide one firm’s insight on the markets. Not investment advice. See additional disclaimer here.
The ChatGPT craze lasted just long enough to ramp Nvidia and the SOXX, to stratospheric levels.
In the coming weeks and months, we’re likely to see who ‘cashed-in’ (a la Elon Musk) and for how much.
When a bull market nears the end of its lifecycle, it tends to thin-out.
As the smaller cap stocks fall away and underperform, they’re sold and that capital’s funneled into the ‘last man standing’; in this case, Nvidia (NVDA).
Broadcom (AVGO) is there as well, but it’s a distant second at 1/3rd, the market cap of NVDA.
Short Positioning
We’re short this sector via SOXS (not advice, not a recommendation) with entries shown in the prior update.
There was a third entry on 7/6 (not shown), but it’s minimal size when compared to the others.
Now, on to the charts
Semiconductor Leveraged Inverse Fund, SOXS
The following chart has the current hard-stop progression and soft-stop (trader discretion) locations.
Moving in closer with the zoom version.
The ‘AI’ bulls are in their brain stem (un-thinking), enabled in their fantasy by articles like this one and this one.
Of course, there’s more like here and here but we get the picture.
Taiwan Semi (TSM) Earnings Date
At the time of this update, TSM earnings date was an estimate, now confirmed as July 20th, before the open.
Note: Posts on this site are for education purposes only. They provide one firm’s insight on the markets. Not investment advice. See additional disclaimer here.
The top in the SOXX, was correctly identified, here.
The potential completion of the downside test and reversal was discussed, here.
After that last post, the SOXX limped higher for one day, before reversing, today.
In fact, today’s session lows took out the daily lows of the prior two sessions.
This update will be brief.
A short position (via SOXS) was initiated on Friday June 30th, then increased by 20%, this past Monday, July 3rd (not advice, not a recommendation).
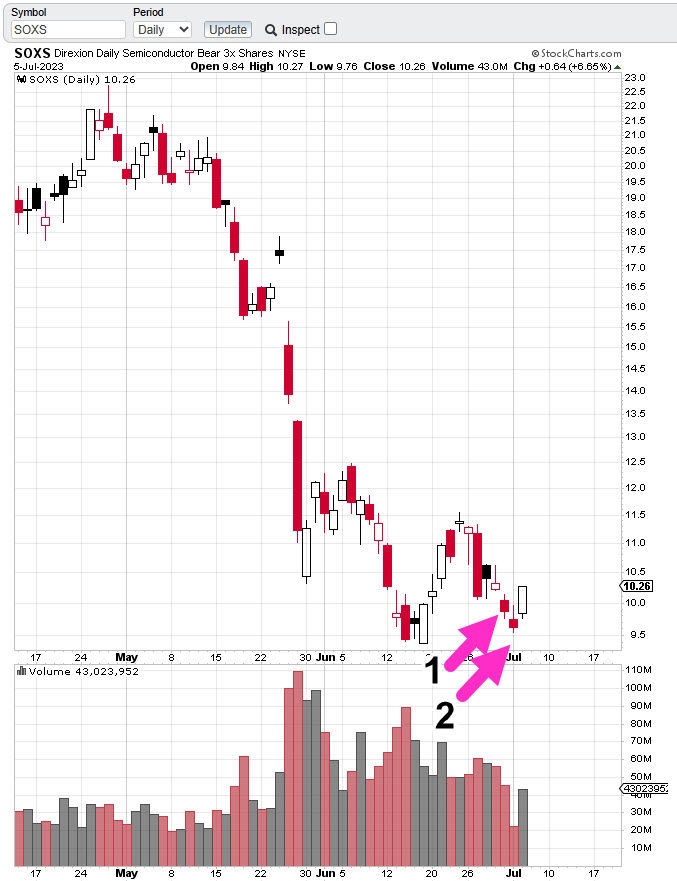
Semiconductor Leveraged Inverse Fund SOXS, Daily
Entries are shown as Arrow No. 1 and No. 2
An original soft stop (trader discretion) and hard stop were given of 9.75, and 9.48, respectively.
Price action on Monday pushed through the soft stop and trader discretion was to maintain the position.
As a result of today’s action, the hard stop has been moved up to SOXS 9.54, with a soft stop at today’s SOXS low of 9.76 (not advice, not a recommendation).
Note: Posts on this site are for education purposes only. They provide one firm’s insight on the markets. Not investment advice. See additional disclaimer here.
Note: Posts on this site are for education purposes only. They provide one firm’s insight on the markets. Not investment advice. See additional disclaimer here.
From a strategic standpoint, this past Friday was the end of the Quarter and possibly the lowest risk spot to short the semis (not advice, not a recommendation).
‘Low risk’, does not mean, ‘no risk’.
We’ll look at the chart below for the SOXX, but first some housekeeping on the Junior Miners, GDXJ.
As stated in the last update, if there was more GDXJ, upside, shorts (via JDST) would be exited. That’s what happened with an overall gain of + 3.57%, on the series (beginning 6/16/23).
Now, on to the next circus … Artificial Intelligence; more specifically, NVDA and its cohort, the SOXX.
Where’s The Money?
With the quarter over, money managers have dutifully shown they’re like everyone else, ‘investing’ in AI.
That’s out of the way, so let’s move on to the specifics:
Referring back to the excellent investigation done by The Maverick, in his view, the $11 Billion, is “Fantasy”.
The tricky part from a chart standpoint, is to identify when or if that fantasy is going to be exposed.
Semiconductor SOXX, Weekly (Inverted)
We’ve taken the weekly chart of SOXX, and inverted it as if going long the leveraged inverse SOXS (not advice, not a recommendation).
Downside force dissipating with each major thrust.
Last week was an ‘inside week’; price action could not make a new weekly low.
Couple that with end of quarter, potential ‘window dressing’ and this past Friday, may have been the lowest risk point, for shorting via SOXS (not advice, not a recommendation).
Analysis … not Advice
This site cannot and will not give advice.
What it can do, is provide analysis and strategy so that you can make your own determination on the market.
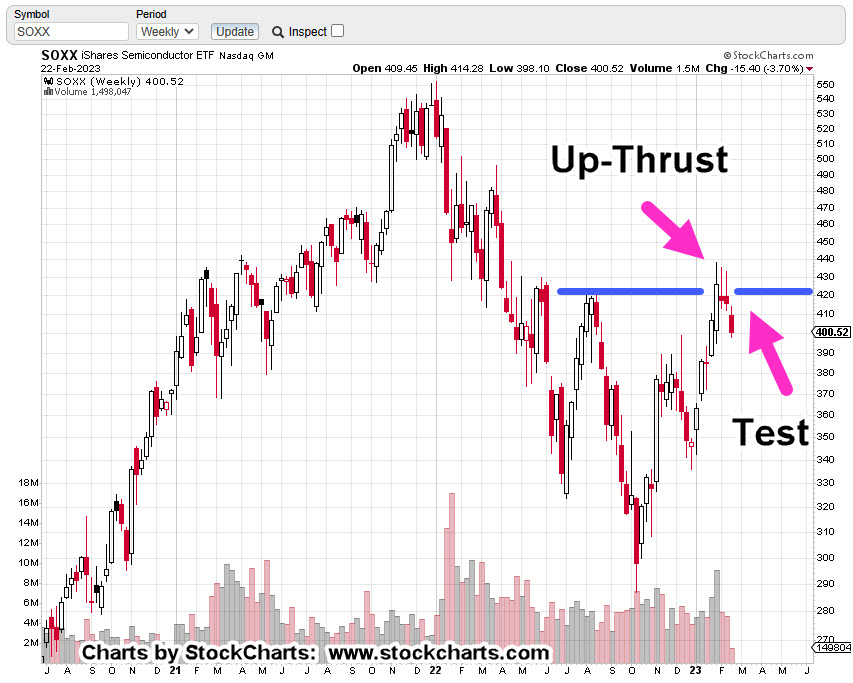
With that said, the ‘heads-up’ for a top in the SOXX, was posted on June 17th, link here.
Since that time, the SOXX reversed down and has now come back to test.
Positioning
On Friday, the SOXX, was shorted by entering long the inverse fund SOXS, at 10.01.
Soft stop (trader discretion) for the position is the session low at 9.75, and hard stop (no excuses exit) at all-time low of 9.48 (not advice, not a recommendation).
The coming weeks may prove interesting. All eyes will be on that ‘$11-Billion’.
Note: Posts on this site are for education purposes only. They provide one firm’s insight on the markets. Not investment advice. See additional disclaimer here.
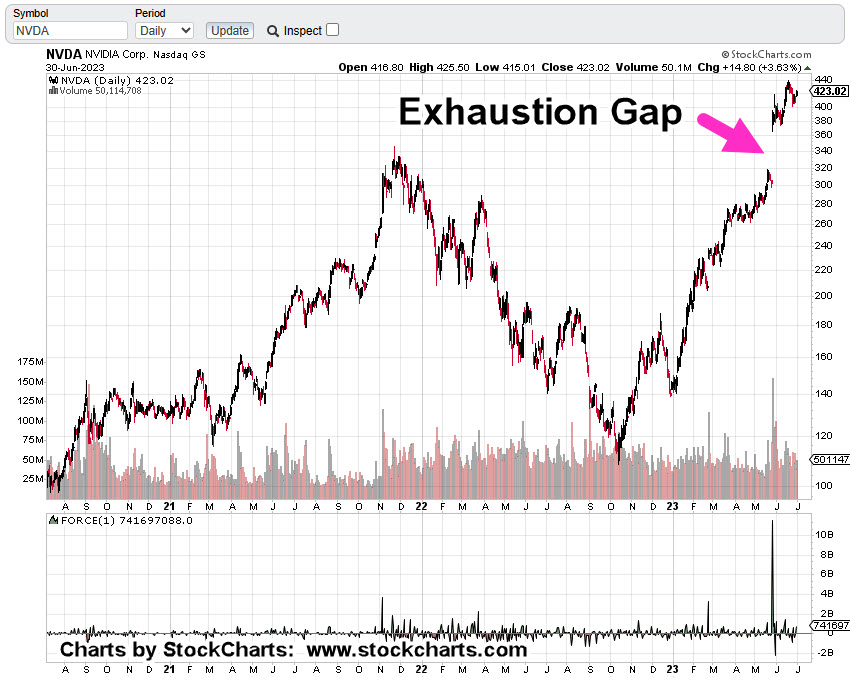
Beginning at time stamp 6:24, at this link, The Maverick goes through an investigation into NVDA, projections.
‘Something doesn’t add up here ….’
That report was three weeks ago. What’s happened, lately?
As of the close this past Friday, NVDA, the largest in the SOXX, was at $1.1-Trillion, market cap. A distant second, is Taiwan Semi (TSM) at $545.5-Bln.
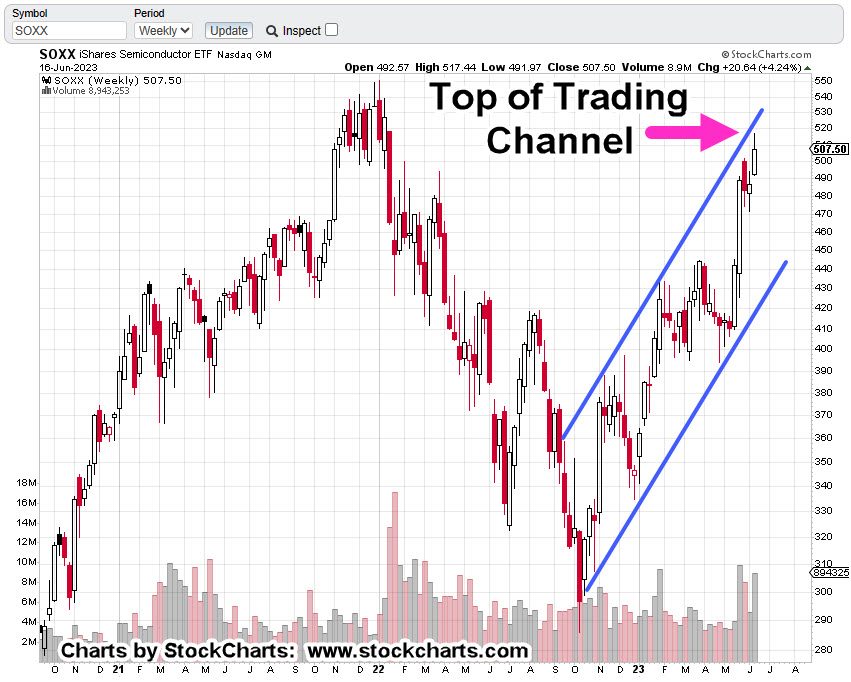
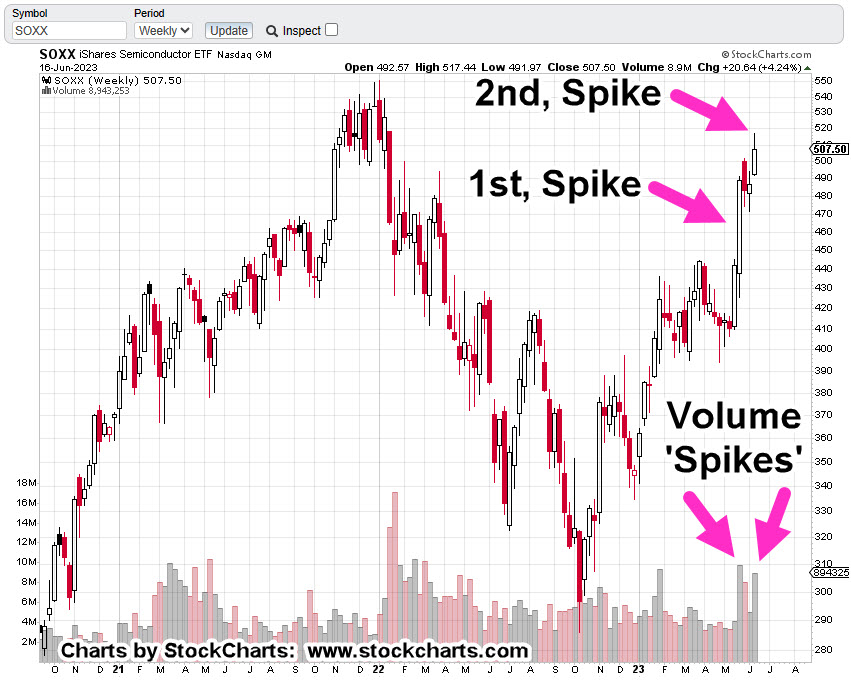
Below, we have a confluence of events for the SOXX.
Semiconductor (ETF), SOXX, Weekly Candle
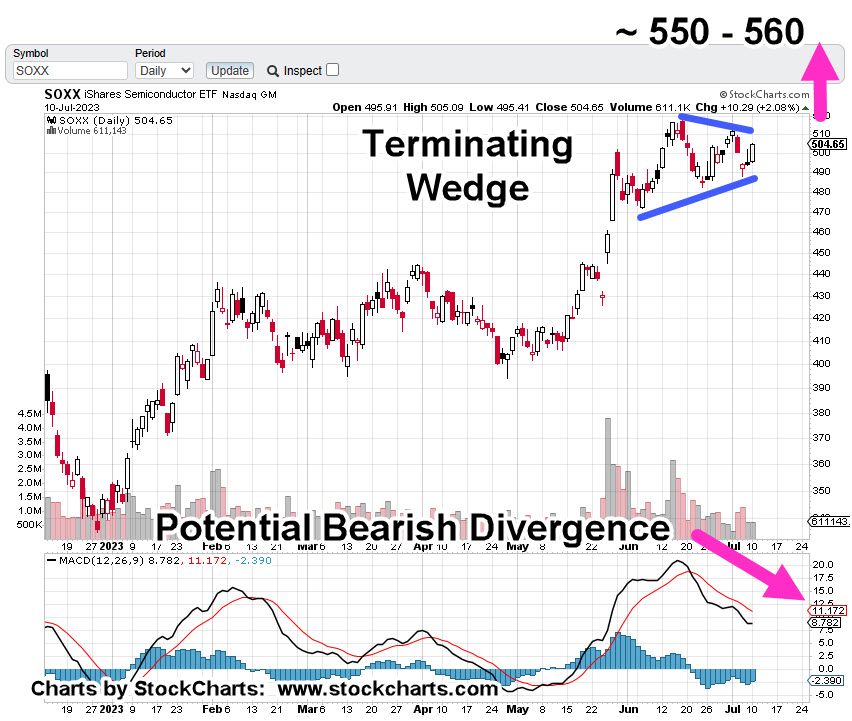
We’re at the top of a trading channel.
We’re in Wyckoff ‘Up-Thrust’ (reversal) position.
A lot of volume expended with less (net) upward progress than previous volume spike; ‘effort vs. reward’.
Getting down to the daily, we see a terminating wedge that’s coupled with reduced volume.
Semiconductor Index SOXX, Daily Candle
So, what does that mean?
The ‘probabilities’ for more upside are, or have been, reduced significantly (not advice, not a recommendation).
Note: Posts on this site are for education purposes only. They provide one firm’s insight on the markets. Not investment advice. See additional disclaimer here.
Note: Posts on this site are for education purposes only. They provide one firm’s insight on the markets. Not investment advice. See additional disclaimer here.
Was that the day where irrefutable evidence like this is going to stick?
Price action of Biotech Sector IBB, has posted a long awaited and anticipated reversal signal (not advice, not a recommendation).
We’ll look at that below.
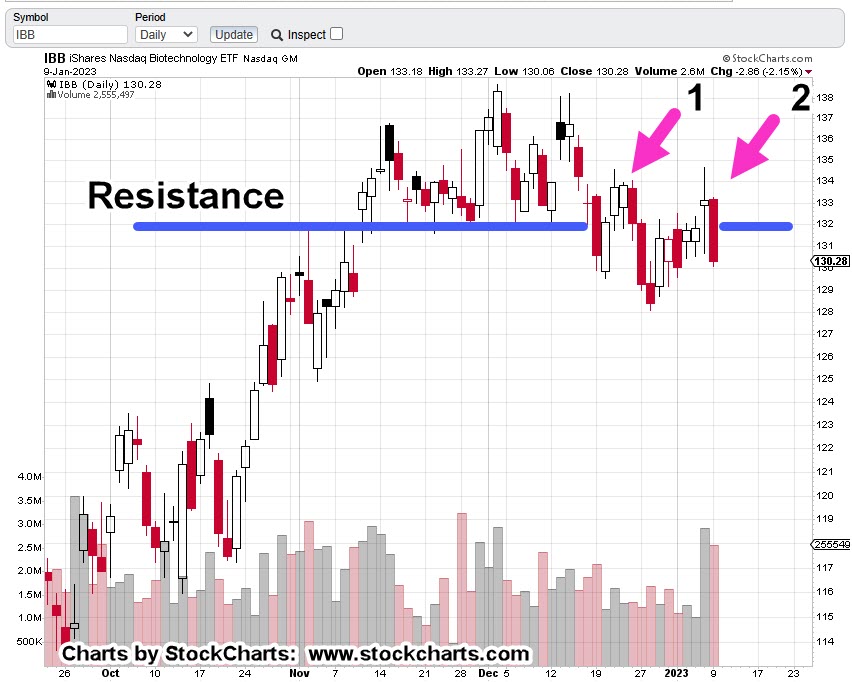
The IBB, Up-Thrust & Reversal
As a reminder, in Wyckoff terms, an ‘up-thrust’ is where price action struggles above known resistance for some period of time and then reverses to the downside.
In the case of IBB, that ‘struggle’ lasted an incredible seven-weeks.
Biotech IBB, Weekly
Price action attempted to break above resistance for nearly two-months, before reversing lower.
Then we had an initial test during the week of 12/23/22 (on the daily for three days), and a secondary test last week.
Biotech IBB, Daily
The daily shows more detail on the struggle.
Point No. 1, was the initial test. Point No. 2, was the secondary test which appears to have decisively failed.
Pre-market action shows IBB, set to open slightly lower.
If it does, then expectation is for some (brief) attempt to rally as a test of the breakdown.
The Driving Force
For years, this site has not wavered in the assessment, what’s happening in this sector, will be the driving force for the entire market on a go-forward basis (not advice, not a recommendation).
Anything can happen.
It’s unknown if yesterday was ‘the day’.
What is known however, evidence is building on a massive scale. Every day, sometimes multiple times a day, we see the effects.
Positioning
This site presents the data, the insight and price action nuances. It does not give recommendations.
With that said, going short this sector is not as straightforward as the other major indices.
IBB, may be shorted directly but will likely result in a maintenance fee from the broker.
Of course, that puts one on the hook for the sector’s dividend payment (currently yielding 0.31%).
The other option is 2X leveraged inverse fund BIS.
However, this fund’s volume is thin … meaning it’s not nearly as liquid as the other inverse funds such as SDS, DXD, QID, SOXS and so on.
It’s up to the trader/speculator to participate or not.
We’re about fifteen-minutes before the open. Let’s see what happens next.
Note: Posts on this site are for education purposes only. They provide one firm’s insight on the markets. Not investment advice. See additional disclaimer here.
Note: Posts on this site are for education purposes only. They provide one firm’s insight on the markets. Not investment advice. See additional disclaimer here.
Note: Posts on this site are for education purposes only. They provide one firm’s insight on the markets. Not investment advice. See additional disclaimer here.