‘Idol’ Worship

If Artificial Intelligence, really is the last of the bubble(s), isn’t it appropriate we culminate in a market top of the ages, with the desire (and delusion) that we can be like God.
Let’s ask ‘AI’ how to get rid of spike protein … see what it says.
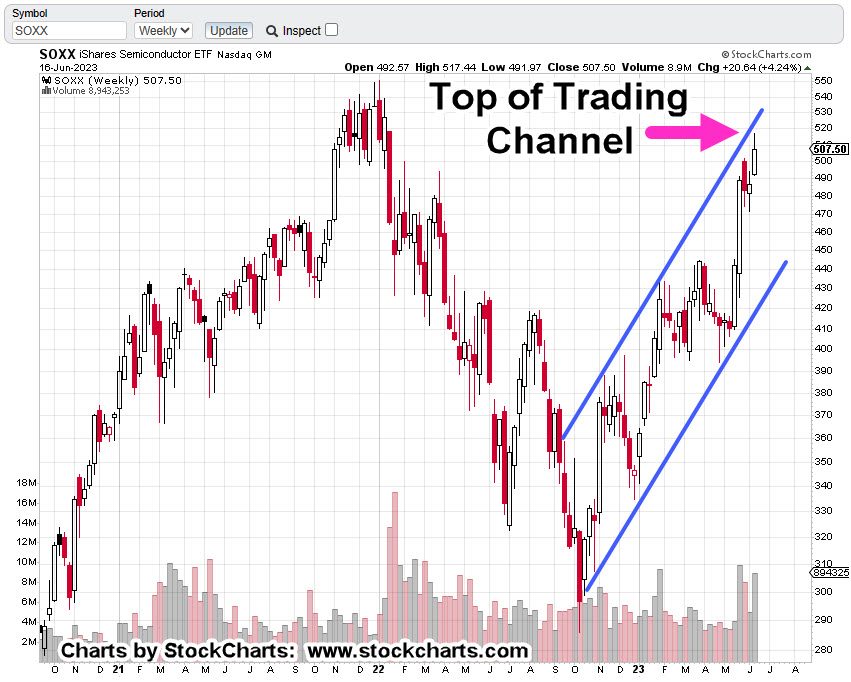
We’re around mid-day; the SOXX, is raging a bull/bear battle inside the range of yesterday’s session.
Tuesday’s session was not able to post a new high or low. With that said, the Fibonacci count from the last update remains intact.
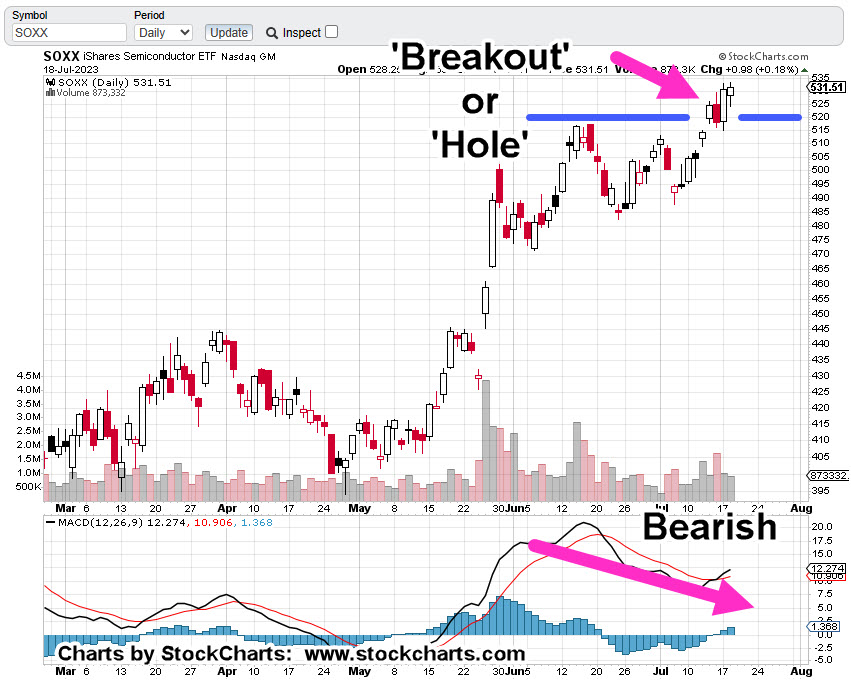
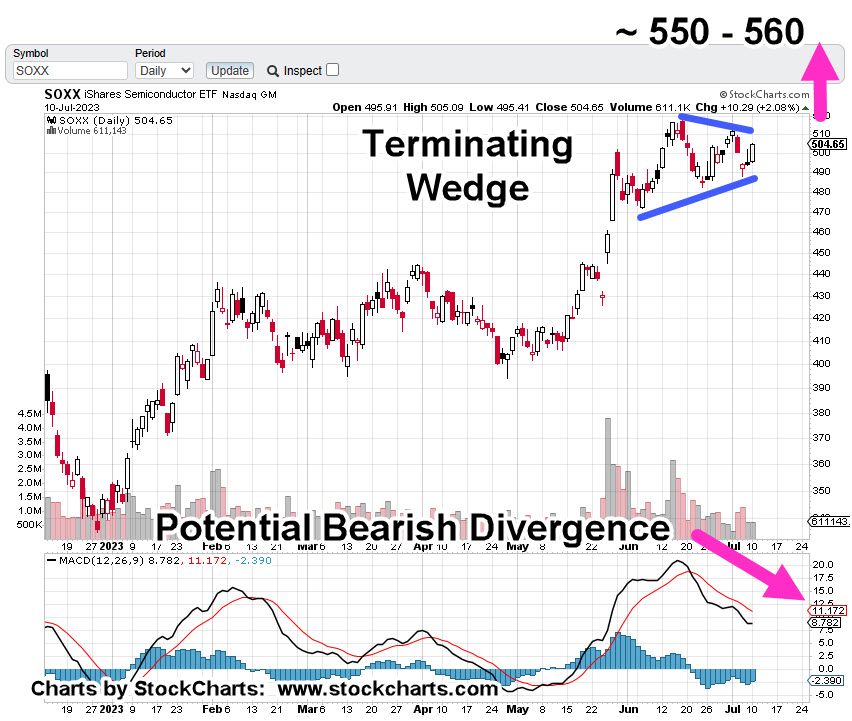
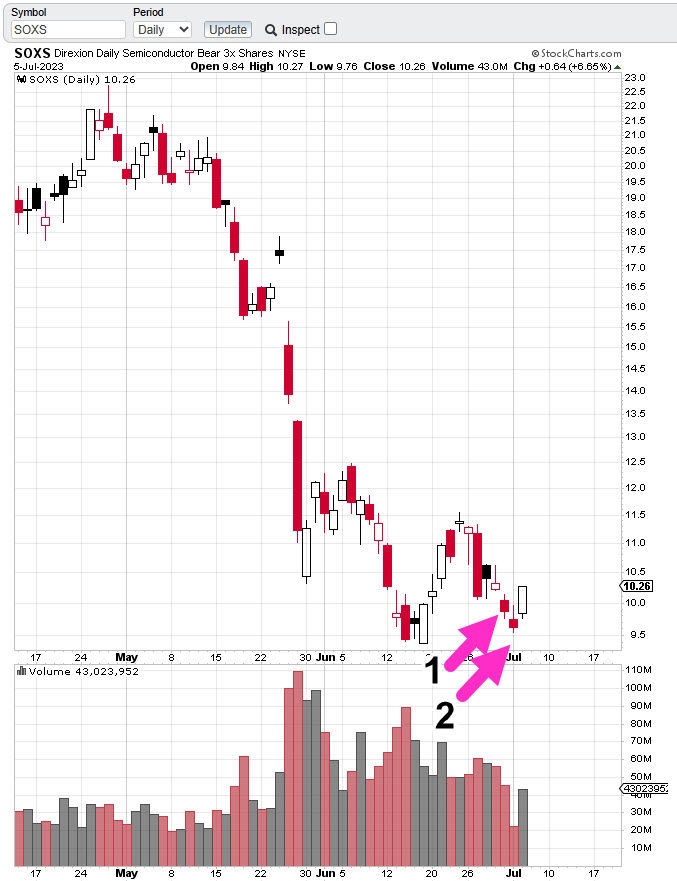
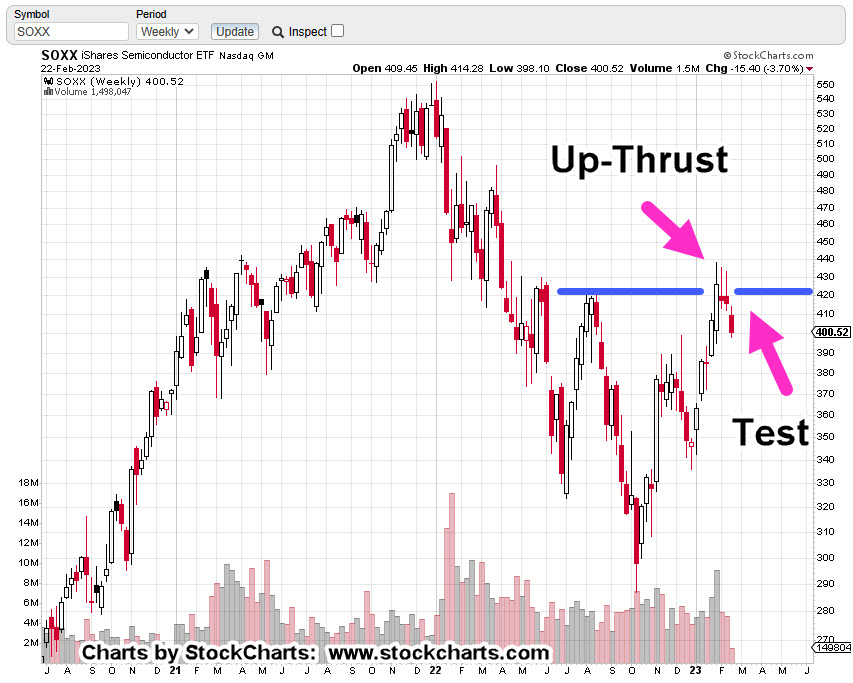
Semiconductor SOXX, Daily
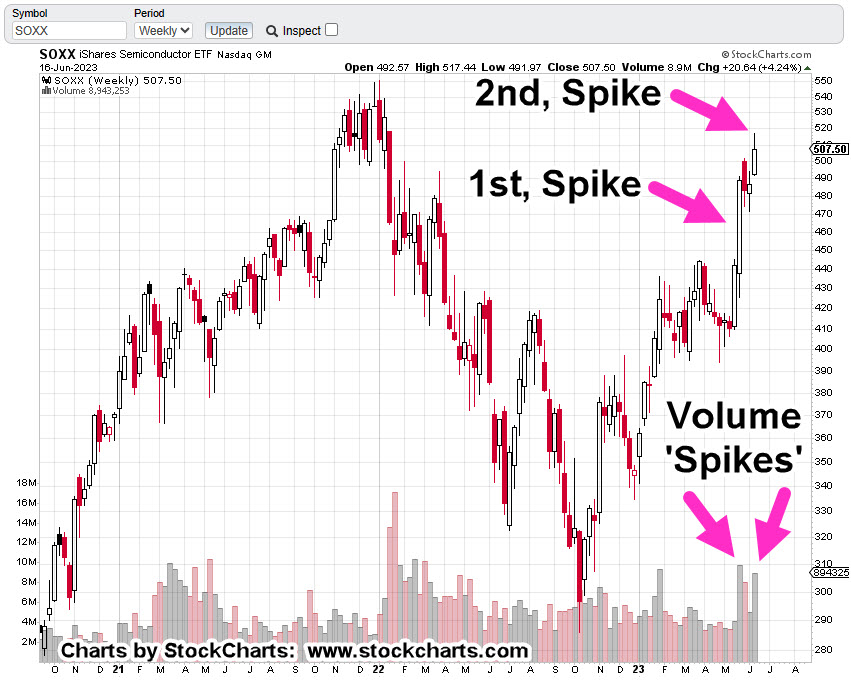
The chart shows upside pressure (volume) is dissipating.
As of this post, the MACD (not shown) is flat, waiting to tick lower; not yet confirming the bearish divergence.

A penetration of the prior session low, SOXX 524.11, would give a classical analysis sell signal (not advice, not a recommendation).
Tomorow’s TSM Earnings
Anything can happen.
SOXX, could spike higher to the previously identified 550- 560, area.
Or, we could have an immediate ‘sell the news’ event.
Either way, it’s up to the speculator/trader to decide for himself whether to take action, or not.
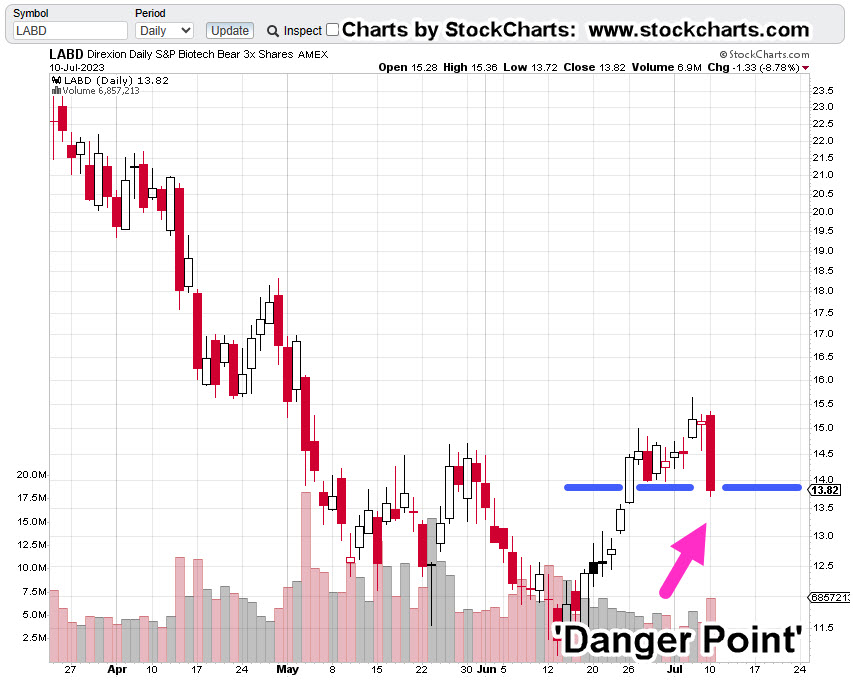
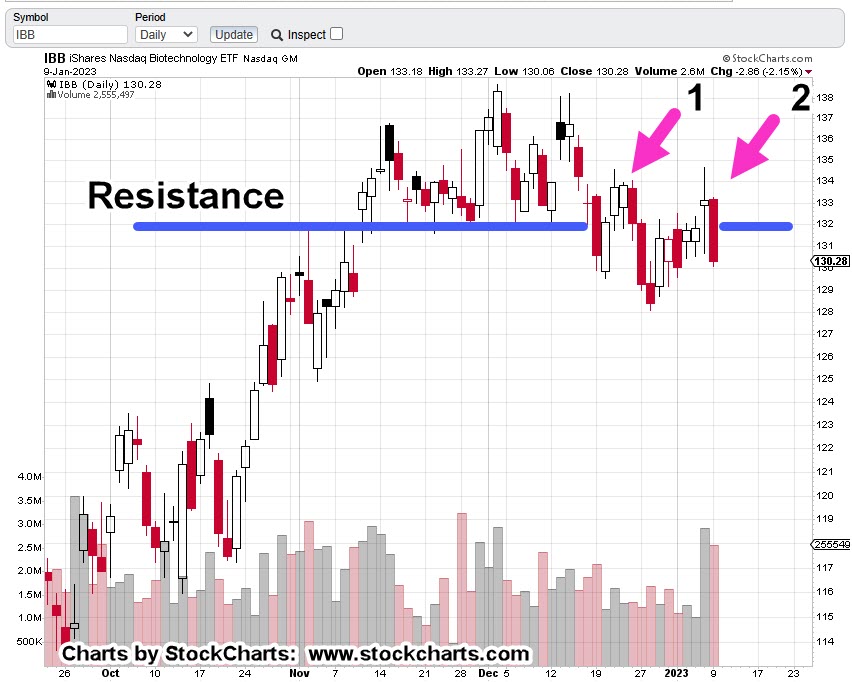
Biotech Short
Separately, the biotech short via LABD, has been exited with a – 7.9%, loss. So, there’s that.
On to the next trade (not advice, not a recommendation).
Stay Tuned
Charts by StockCharts
Note: Posts on this site are for education purposes only. They provide one firm’s insight on the markets. Not investment advice. See additional disclaimer here.
The Danger Point®, trade mark: No. 6,505,279