Note: Posts on this site are for education purposes only. They provide one firm’s insight on the markets. Not investment advice. See additional disclaimer here.
If it’s not behaving as expected, then it’s obviously doing something else.
In the case of biotech XBI, that something else, may be working its way to the next set-up.
Strategy First
Until price action proves otherwise, the overall long term reversal assessment of the sector has not changed (not advice, not a recommendation).
We’ve had a potential long-term up-thrust (reversal) that’s been covered here, and here.
That second link contains a 3-Day chart analysis.
Looking at the current price action and having it dictate what chart to use, we’ll switch to a 2-Day, which shows the potential more clearly.
Biotech XBI, 2-Day
The sector has failed to break below support in the 92 – 93, area. Instead, it has decided to bounce in what looks to be a possible minor spring-to-up-thrust.
We can see there’ve been two ‘hits’ on the upper resistance line. One, immediately after the up-thrust breakdown and one later … 4-bars later.
These hits essentially confirm the area, in effect, setting it up for potential penetration.
One has to think about where the stops are located.
If I was short this sector (I have been, but not currently), where would I place my stop?
Naturally, I’d put it right above the resistance (blue) line, exactly where everyone else has put theirs 🙂
Years ago, Martha Stokes wrote an update on why everybody gets stopped out of their trades, paraphrasing from this link:
‘The Market Makers don’t know you are there; they’re not interested in your tiny little stop order.
If your order does get taken out, it’s because too many small traders put their stops at the same location.
There’s an order imbalance. The market’s response is essentially automatic … take out the stops.’
With that, let’s see what happens next.
There’s no guarantee XBI, will penetrate the resistance area but if it does, we won’t be surprised.
Note: Posts on this site are for education purposes only. They provide one firm’s insight on the markets. Not investment advice. See additional disclaimer here.
YouTube content creators have noticed the public’s inability, refusal, and denial to recognize (or accept) the truth:
Michael Bordenaro; ‘everybody’s so weak, so sensitive, they can’t handle the facts.’
Patera, Appalachia’s Homestead; discussing her lineage (Cherokee) and history, seeing the similarities of today, applying the lessons; some are more concerned about her hair and makeup.
Then, Uneducated Economist; ‘no amount of wishing is going to bring events back to the way it was. It’s effectively a new construct.’
Interest Rate Ruse
The 40-year bull market in bonds is over; rates are not going lower, they’re going higher (not advice, not a recommendation).
Ignoring or refusing to recognize this (highly probable) truth when analyzing markets, is a potential strategic error.
The longer the ruse goes on, the more violent the reaction may be when the masses (finally) ‘awake’.
All of which brings us to biotech, XBI, SPBIO, $SPSIBI.
Biotech Truth
Truth about biotech is brutal; described here, here and here.
Exactly how this will all hit the mainstream in force, is unknown. However, let’s not forget, ‘when price action goes south, bad news comes out’.
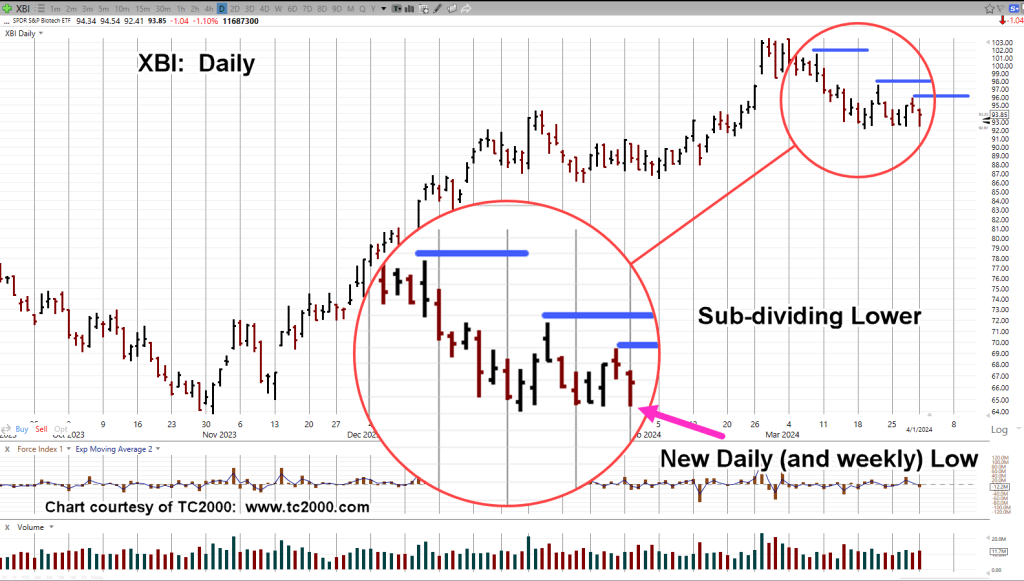
Biotech XBI, Daily
Heading south at this point, is biotech XBI.
Market test of the Wyckoff up-thrust (reversal) appears complete; previously discussed here, here and here.
As of 1:40 p.m., EST, XBI is trading back into congestion (92 – 96) and looks to have formed a trading channel.
Left channel contact line shown as No. 1, is supported by this post, potential long-term reversal.
Note: Posts on this site are for education purposes only. They provide one firm’s insight on the markets. Not investment advice. See additional disclaimer here.
The financial press will always come up with some kind of ‘reason’ why the markets went up or down.
However, getting to the truth of price action is sometimes boring and also requires a focused amount of thinking.
That thinking requirement, puts it ‘right out‘ (as the Brits would say) for any kind of media consideration. 🙂
Therein lies the opportunity; case in point, biotech, XBI.
The sector did not move higher today as a result of any type of ‘good news’ for potential rate cuts; cuts that so far have yet to materialize (waiting now, for over a year).
No, XBI went higher today to ‘test’ the underside of resistance after its own break through that resistance.
Biotech XBI, 3-Day
As stated in the prior update, it’s going to take some kind of extra demand to get the sector back to bullish.
For now, it’s right below resistance and testing.
Obviously, what happens tomorrow, is important.
If we’re in a test, and not a new leg higher, the expectation is for very limited upside price action … if any.
Note: Posts on this site are for education purposes only. They provide one firm’s insight on the markets. Not investment advice. See additional disclaimer here.
Tomorrow’s the Fed interest rate announcement; anything can happen.
The way it stands now for biotech XBI (the day prior), an upside rally is against the odds.
The chart below for the sector is a busy one.
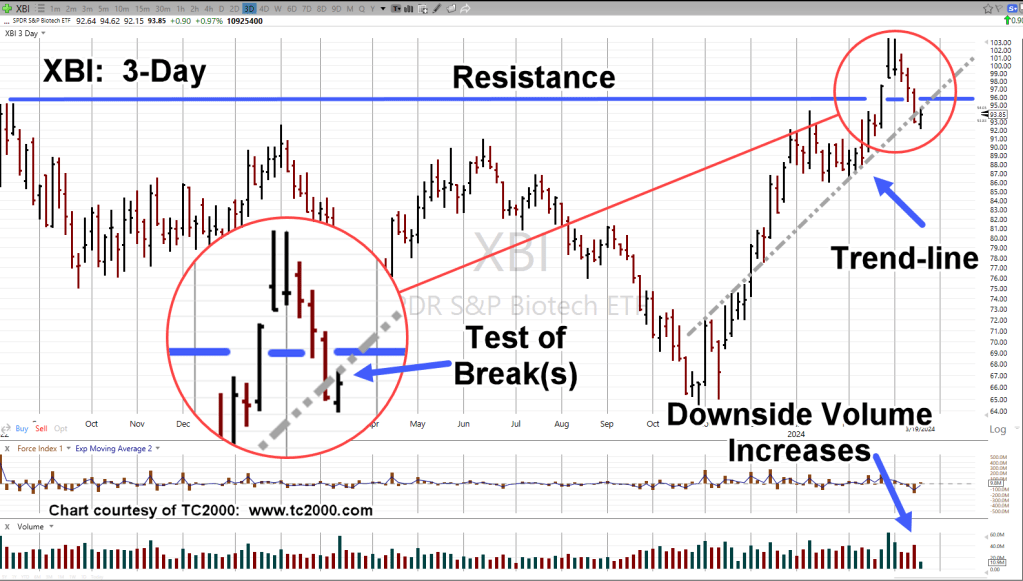
Biotech XBI, 3-Day
Price action’s below resistance (possible false breakout), has broken an upside trend to the downside (grey dashed line) and today, has come back for a test of both.
Breaking below resistance was accompanied by increased volume; bearish.
A significant amount of demand will need to show, to get this market back to the bullish side (not advice, not a recommendation).
The Fed interest rate announcement is scheduled for Wednesday, 2:00 p.m., EST.
Note: Posts on this site are for education purposes only. They provide one firm’s insight on the markets. Not investment advice. See additional disclaimer here.
It’s all quiet on the biotech front but for those paying attention, the temperature’s rising.
XBI (sector ETF), penetrated support and is now testing that breakdown.
At this juncture, anything can happen. A new lease on life, and we get a reversal higher.
However, probabilities argue against that scenario; multiple posts, here, here, here and here, present the case for significant downside (not advice, not a recommendation).
Going to the price action, we’ll use a 3-Day chart.
Biotech XBI, 3-Day
You might ask, ‘Who uses a 3-Day chart?’, ‘I don’t know anyone that does.’
Well, this may be the only place and that’s the point. 🙂
The 3-Day, for this market, at this juncture, shows support/resistance areas more clearly.
Notice on the current bar how the close (as of 3:15 p.m., EST) is below resistance, the blue line.
Then, look how the prior bar closed above the resistance area. The attempt to test this area (resistance breakout) and make it support has failed (thus far).
As a reminder, it’s the failed moves that get the attention of The Street.
Note: Posts on this site are for education purposes only. They provide one firm’s insight on the markets. Not investment advice. See additional disclaimer here.
Note: Posts on this site are for education purposes only. They provide one firm’s insight on the markets. Not investment advice. See additional disclaimer here.
Note: Posts on this site are for education purposes only. They provide one firm’s insight on the markets. Not investment advice. See additional disclaimer here.
Note: Posts on this site are for education purposes only. They provide one firm’s insight on the markets. Not investment advice. See additional disclaimer here.
Note: Posts on this site are for education purposes only. They provide one firm’s insight on the markets. Not investment advice. See additional disclaimer here.