‘Monkey See … ‘

The next ‘show’ is about to begin; let’s take our seats, get the popcorn ready.
Setting the stage, we have this, just out.
Looks like there’s another ‘Speck’ on the horizon. You know, ‘The Thing’ as The Maverick of Wall Street, likes to call it.
But we can’t have this crisis go to waste. How about a press release, letting everyone know, we’re about to make (yet) another bundle of cash.
Is that really going to happen, this time around?
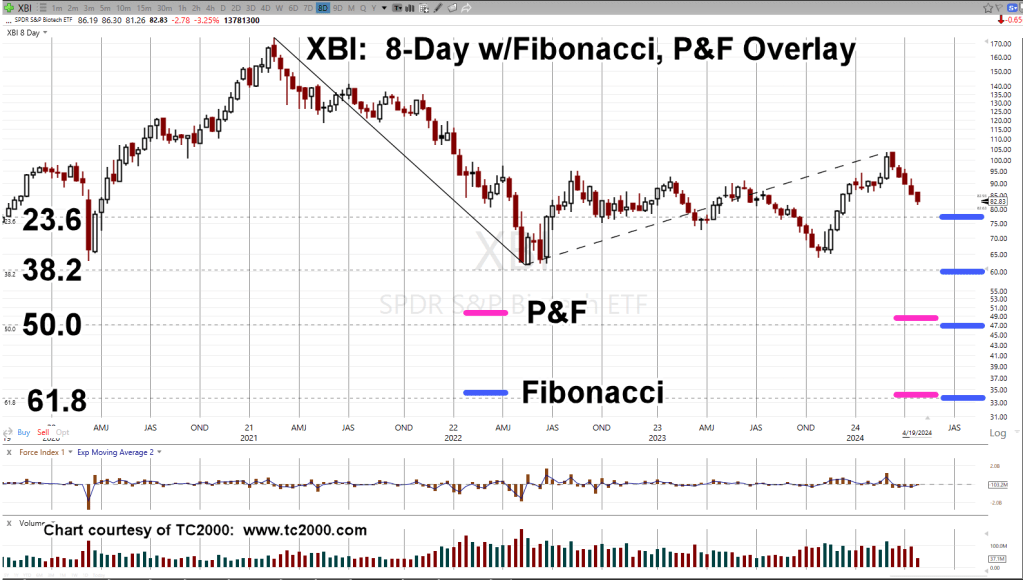
To find the answer or the probability, we’ll go to the chart of biotech XBI, and have it tell us the likely outcome.
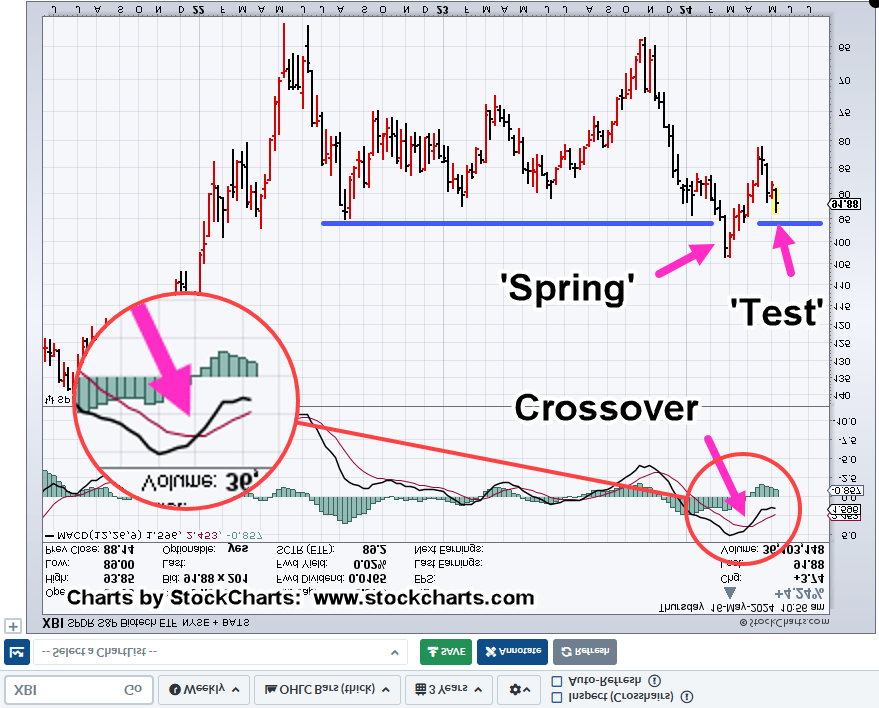
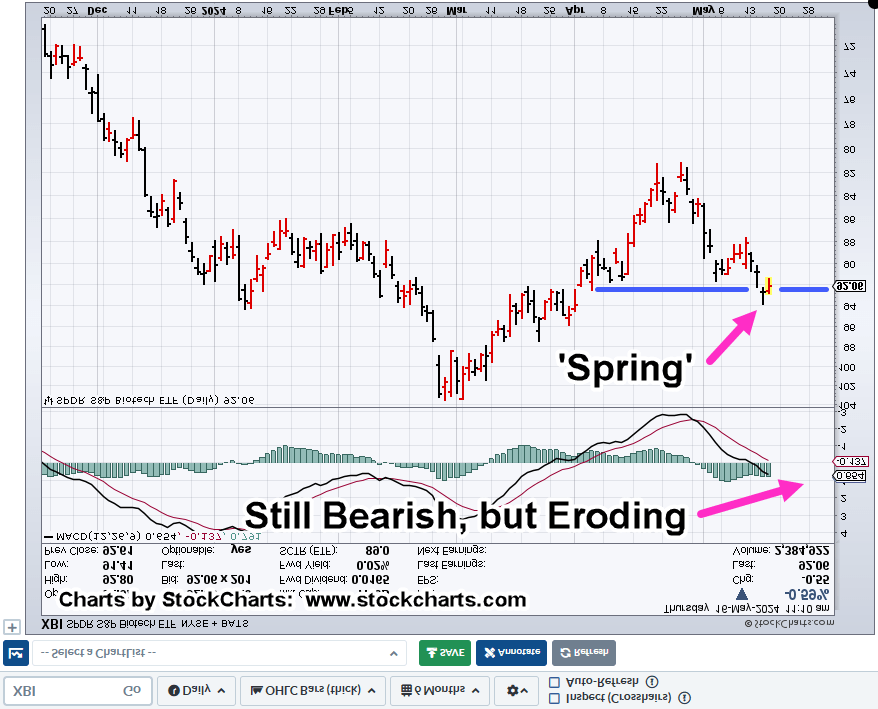
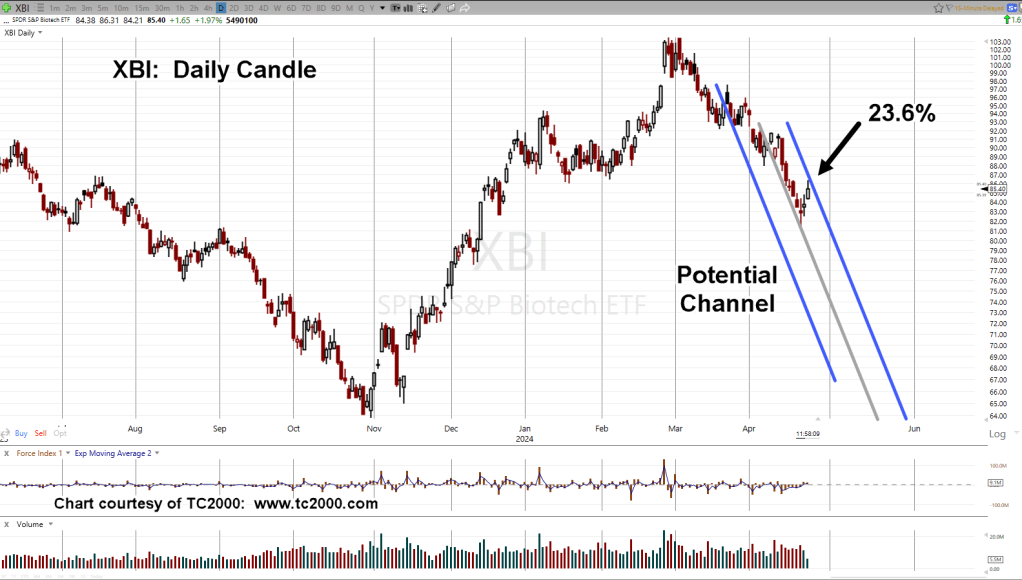
Biotech XBI, Daily (inverted)
As we’ve being doing previously, here, and here, we’re using the daily but inverting it to show bearish (LABD) potential.

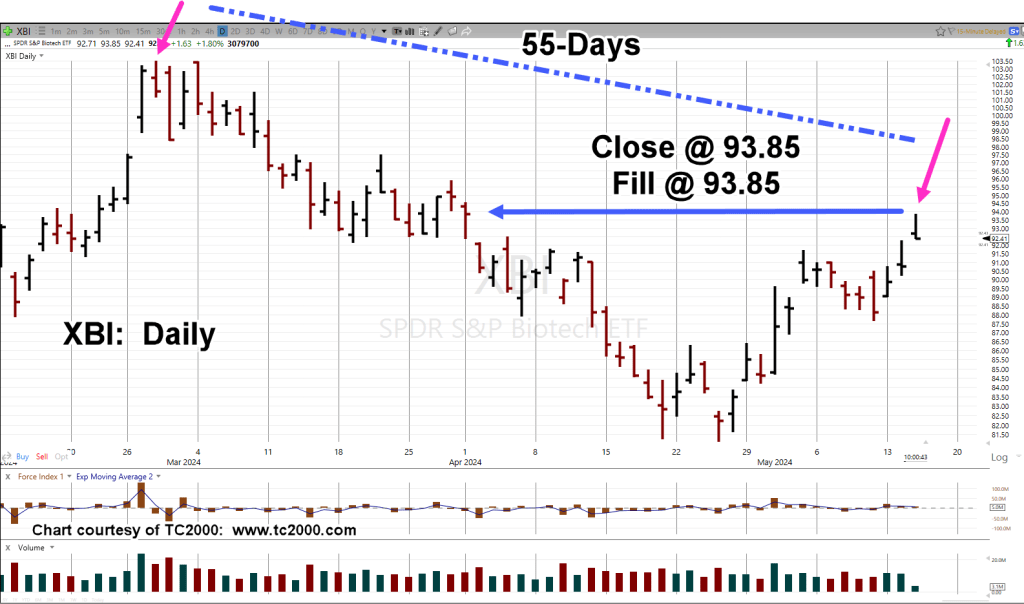
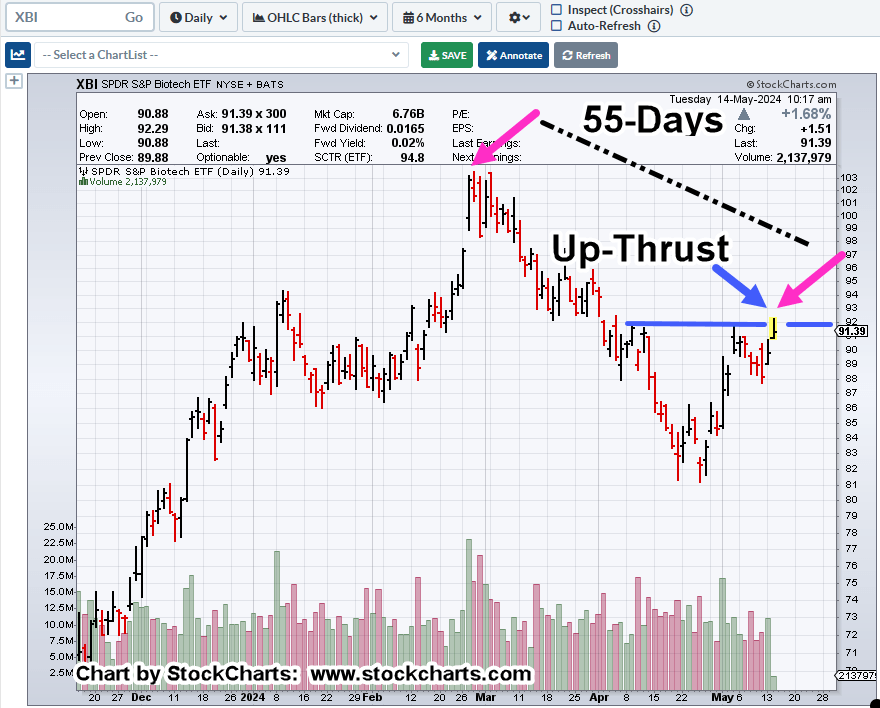
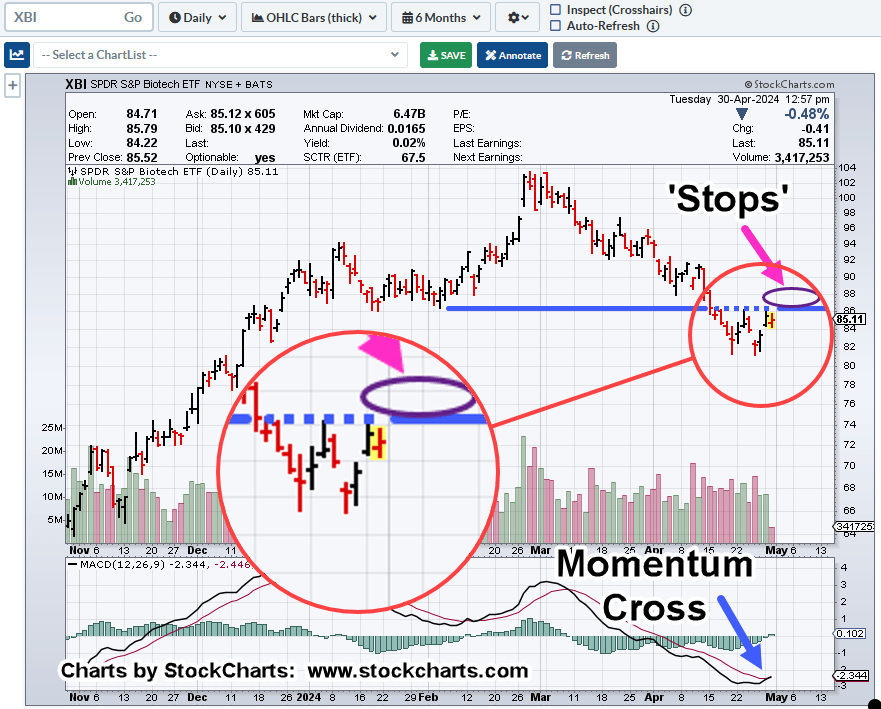
As a reminder, this update, indicated a possible stop for a short position (not advice, not a recommendation).
That location is labeled ‘Stop No. 1‘, on the chart.
Yesterday’s action presented the opportunity to move the stop; it’s labeled as ‘Stop No. 2‘.
Rule of Alternation
This ‘rule’, coming from Robert Prechter Jr., says:
‘What happened last time, is not likely to happen this time.’
That guides us to expect something different.
From the perspective of the analysis above, that ‘different’ is pointing probabilities to the downside (not advice, not a recommendation).
Stay Tuned
Charts by StockCharts
Note: Posts on this site are for education purposes only. They provide one firm’s insight on the markets. Not investment advice. See additional disclaimer here.
The Danger Point®, trade mark: No. 6,505,279