Evidence of a Top: IYR

Losing power with each attempt to move higher.

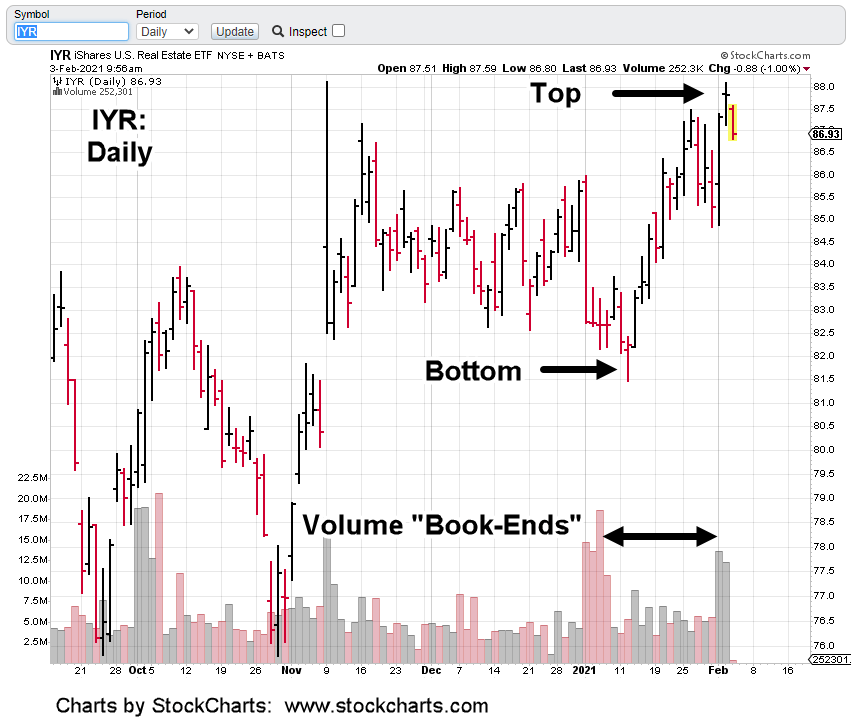
The daily charts show it’s clear there’s no more energy left to lift prices significantly higher.

Zooming in on the daily (below), momentum dissipation is evident:

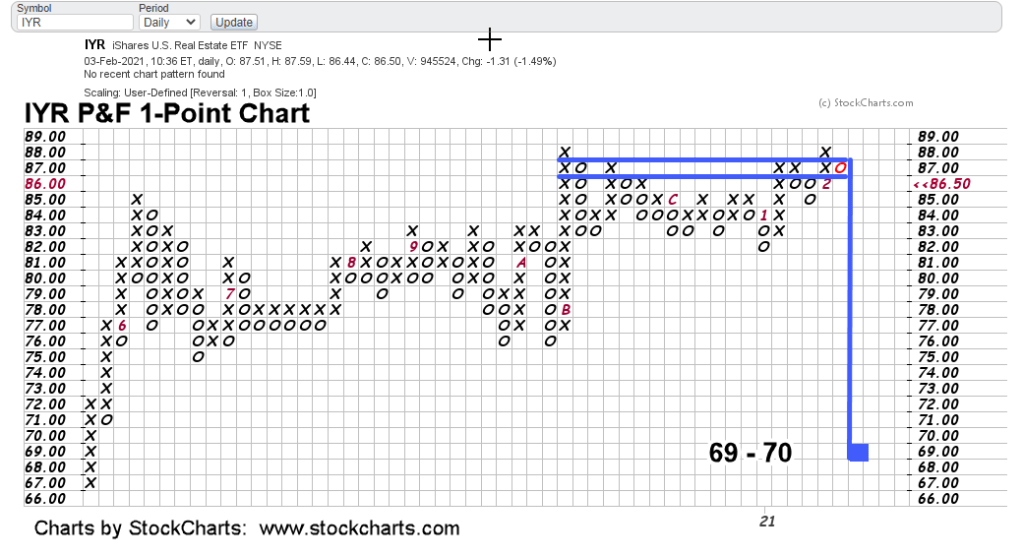
Yesterday’s update said unless IYR posts a new daily high, it’s in reversal.

Price action came back late in that session to close the opening gap … but there was no new high.

The sector’s a juggernaut. When it reverses for good, downside action is likely to be as persistent as the upside.

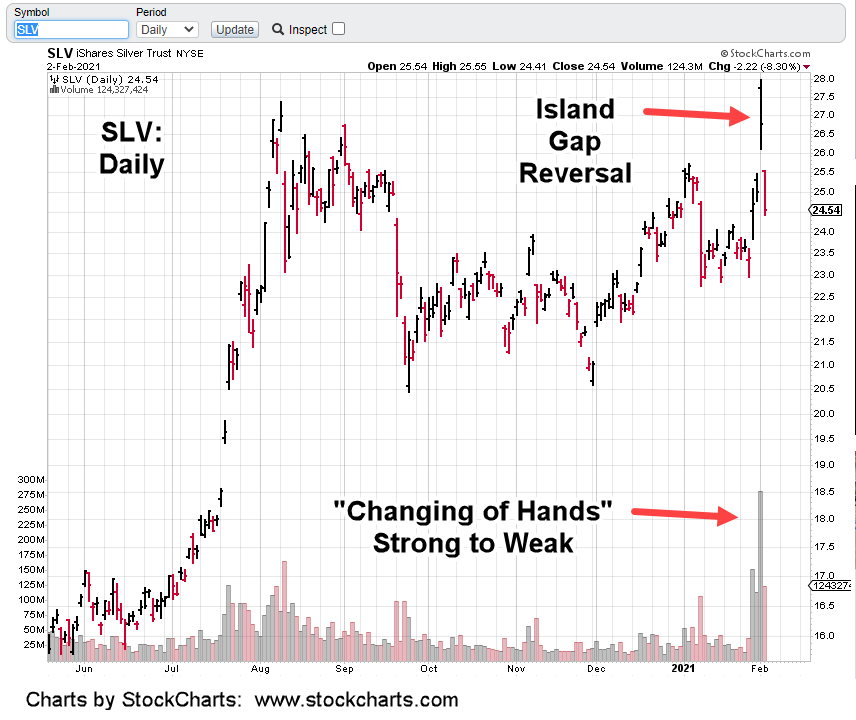
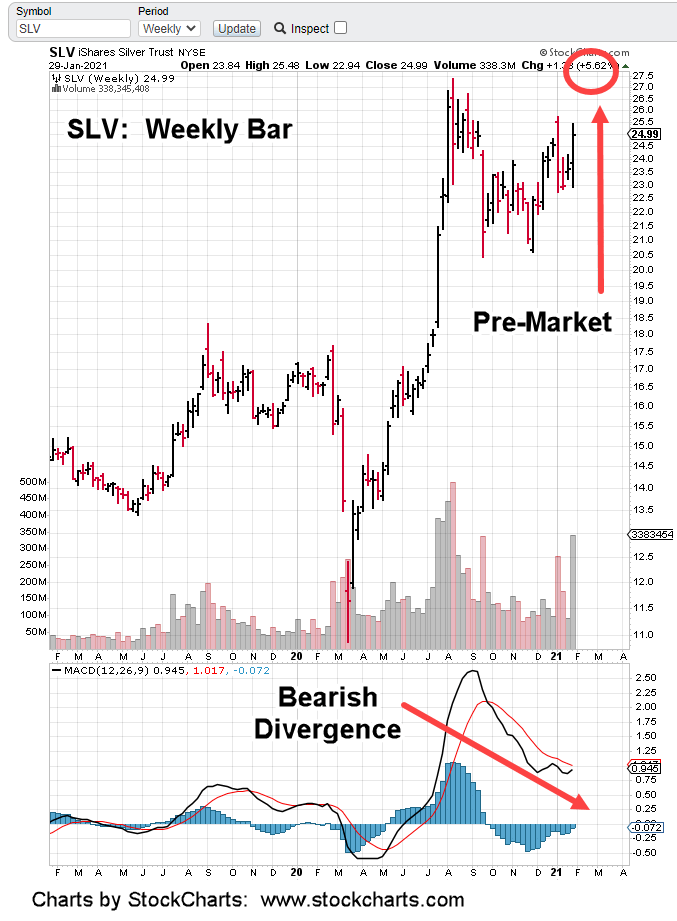
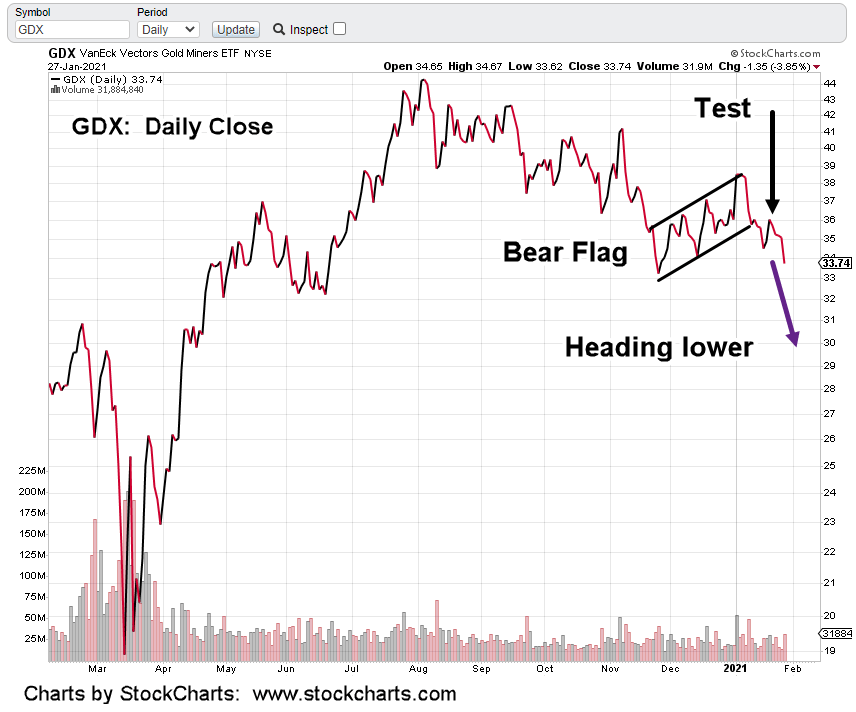
In other but related markets, the dollar continues its upside reversal while gold and silver continue the downside.

The island gap-trap in silver, has now entered the disillusionment stage.

Retail ‘traders’ disillusioned about getting some tip in a widely followed ‘chat room’ that’s somehow going to make them rich by making only one decision (go long) and having little, or no experience.

Prechter said it well years ago: ‘Be sure to lose your fortune(s) early in life, so you have time to recover.

Even Van Metre’s getting heat and losing subscribers; the bond market’s not providing the necessary ‘good feelings’ for the inexperienced crowd to maintain a position longer than a few blips on the screen.

No matter the market, whether it’s bonds, gold, dollar, or real estate, the big money’s in the big move.

The most frequent condition of the market professional is one of ‘discomfort’.

If you need it, here’s a good source for help on mastering the emotions necessary to be consistently successful in the markets.

Stay Tuned

Charts by StockCharts

Note:  Posts on this site are for education purposes only.  They provide one firm’s insight on the markets.  Not investment advice.  See additional disclaimer here.

P & F Forecast: IYR

Unless IYR posts a new daily high, it’s in a reversal.

P&F chart forecasts an ‘initial’ target: 69 – 70 range.

Initial target because as (and if) IYR moves down, it generates even lower targets having posted prior congestion in the 76 – 82, chart area.

Charts by StockCharts

Note:  Posts on this site are for education purposes only.  They provide one firm’s insight on the markets.  Not investment advice.  See additional disclaimer here.

Real Estate Reversal

Volume’s the clue for real estate, IYR.

Just like book-ends. Volume showed the pivot higher (just over three weeks ago) as well as the pivot lower today.

For those following these updates, it’s no secret I’ve been positioning my firm, short the sector (over the past two weeks) via DRV; not advice, not a recommendation.

Everyone has their own style. I’d rather be early, than late.

Now, it appears IYR has reached its extreme and heading lower. With what looks to be an obvious reversal, position size will be increased as the market dictates.

Downside potential is absolutely massive but not guaranteed.

Price action posting higher has changed the Point & Figure projected targets. Forecast updates will be forthcoming.

Charts by StockCharts

Note:  Posts on this site are for education purposes only.  They provide one firm’s insight on the markets.  Not investment advice.  See additional disclaimer here.

Silver on an Island

The silver hype couldn’t even last for a single day.

Price opened gap-higher on Monday and then steadily eroded to close lower; posting a reversal bar on massive volume.

The next day, yesterday, the trap is shut. Island gap reversal.

Way back in Livermore’s time, in his (fictionalized) biography, he says the big players can’t get in and out whenever they want.

Their positions are so large, entering and exiting would cause huge moves in the market. They need to have an “event” with massive volume so as to hide their actions (entering or exiting).

The pre-market update on Monday proposed the whole kabuki theater with GME, then SLV could have just been a ruse for big players to establish massive SLV (or futures) short positions; or just plain exit out entirely.

That idea doesn’t sound so far fetched now.

We’ll have to see if it’s true at the next commitment of trader’s report.

Either way, it’s not really important to dive into the minutiae. We can just look at the chart.

As Prechter likes to call it, massive volume signifies a “changing of hands”. Most likely from strong to weak (i.e. from professional to retail).

The significance probably invisible to the public, this may be the inflection point.

Now that SLV’s at a potential long term pivot, we could be at the cusp of a deflation impulse.

Commodities (like oil) along with real estate, one of the most illiquid of all markets, get crushed in a downturn.

Stay Tuned

Charts by StockCharts

Note:  Posts on this site are for education purposes only.  They provide one firm’s insight on the markets.  Not investment advice.  See additional disclaimer here.

DUG Moving Higher, Fast

Inverse Oil & Gas, DUG is trending higher at +3,400%, annualized.

As long as the trend holds, DUG is an excellent play (not advice, not a recommendation) to the short-side.

The last report on DUG had the trend at approximately +2,200%. Additional price action has adjusted that number higher as shown.

Charts by StockCharts

Note:  Posts on this site are for education purposes only.  They provide one firm’s insight on the markets.  Not investment advice.  See additional disclaimer here.

SLV Up 10%, Can it Hold?

The short answer is, probably not.

Is anyone looking at the technical condition? No, it’s all about ‘putting it to the man’.

In all of Wyckoff’s writings, he never once proposed the idea of taking the large controlling entities for a ride.

He was totally immersed in figuring out what those entities were trying to accomplish; then getting on the right side of the trade.

For all we know, the whole hedge fund blow-up, kabuki theater could have just been a sacrificial lamb (an inside job) targeting silver for a massive short opportunity.

How’s that for strategic thinking.

Right now, in the pre-market, SLV is right at new recovery highs.

The real question should be, ‘how long can the hype last?’

Can it finish the week at new highs and post a bearish divergence on the weekly MACD?

Price action itself will decide. What we do have, is risk being removed on the short side.

Inverse fund ZSL is down a stiff -21%. If there is a short, that’s the one to watch (not advice, not a recommendation).

It’s important to note, GLD is nowhere near a +10% move. It’s a non-confirmation on silver.

Separately, the overall markets are trading higher but appear to be under their prior session (daily) highs … indicating a short position in those markets is still viable.

Charts by StockCharts

Note:  Posts on this site are for education purposes only.  They provide one firm’s insight on the markets.  Not investment advice.  See additional disclaimer here.

CORN: Breakout Ready

Price action in futures tracking fund CORN, is congesting in a tight range; ready for breakout to the upside.

This is not about inflation.

Frequent visitors to this site already know the entire food supply chain, from field to market, is being systematically destroyed.

Probably the best source of documentation is at ice age farmer.

For years, ‘ice age’ has been reporting step by step plans and events in place to choke-off food production and distribution.

Digressing for just a bit: The firm managing this site, presenting its analysis of markets and corollary events, is constantly searching for additional information or new data sources.

If a new market analysis (or other news) source is located, then that ‘source’ says there’s food price inflation because of dollar devaluation, it’s eliminated as being reliable or aware of actual events: DONE.

At this point, everyone should know exactly why food prices are rising.

Whenever we get the next ‘Black Swan’ event, there’ll be no time to vet out information sources. That should’ve been done long before there’s another market or world upset.

The recent Game Stop (GME) event may just be a blip; a side detour in the overall plan.

Van Metre calls the whole short squeeze “brilliant”. So it was.

We can rest assured, that hole in the dike (a proletariat uprising) will be plugged ‘tout de suite’.

Food is the key. It’s the choke point. End of digression.

Getting back to CORN. Price action may congest more before a sustained breakout. There may even be a head-fake to the downside to flush out any weak longs.

From an investment or trading standpoint, price is at the point where political events could cause action to become unreliable … think Jimmy Carter and the grain embargo after the Russians (Soviets at that time) invaded Afghanistan.

It’s the trader’s discretion whether or not to position long.

My firm’s action is to be aware of price and use it as a proxy for up-coming events.

Stay Tuned

Charts by StockCharts

Note:  Posts on this site are for education purposes only.  They provide one firm’s insight on the markets.  Not investment advice.  See additional disclaimer here.

Hanging by a Thread

Semiconductor SOXX, is hanging by a thread.

Did SOXX just break away during the past week or is there going to be an attempt to close the gap?

When a market closes down for the week and near its lows, there’s usually follow-through action at the next open.

SOXX may never get the chance to fill the gap.

If we look at inverse fund SOXS, it’s showing a potential trend-line. Maintaining that line will double the price (at Friday’s close) sometime in early March.

The chart below also shows the firm’s entry point; not advice, not a recommendation.

In a way, semiconductors are similar to aviation; margins are razor thin.

When there’s an economic down-turn, both get hit especially hard.

At this juncture, I have positioned my firm short in both real estate (via DRV) as well as short the semi-industry (via SOXS). Not advice, not a recommendation.

The SOXS position finished in the green by the close. DRV is showing a loss but closing that gap quickly.

Separately, and in a report planned for tomorrow, we’ll cover the food supply. The ongoing (planned) shortage is proving correct, the approach it’s ‘corn first, then silver and gold’.

If Van Metre’s GDX forecast is on target (declining to 17, or even 14), gold bugs may find themselves liquidating their positions; just so they have enough money to pay for hyper-inflated food.

In effect, gold will be irrelevant; a very possible (short-term) event.

Stay Tuned

Charts by StockCharts

Note:  Posts on this site are for education purposes only.  They provide one firm’s insight on the markets.  Not investment advice.  See additional disclaimer here.

S&P 500: Trend Break, Test

Yesterday, the S&P tested its trend breakout and then reversed.

This morning’s pre-market action is down again.

The teminiating wedge is clear. Then a decisive break with an upward test. Late in the session that test was rejected and the market headed lower.

That scenario could have easily been from 1931’s stock market action, not 2021.

Buried within the Wyckoff training course material (first published 1931), available here, is a statement to the effect:

‘When a market breaks a trend decisively and with volume, there’s nearly always some type of rally to test the break.’

That’s exactly what we got yesterday. Now, the S&P (SPY) is in a wide pre-market range but essentially trading lower.

A terminating wedge is typically the last stop in a move; whether it’s up or down.

The S&P could of course rally from here. At this point, probabilities favor lower; at lest to a measured move target in the vicinity of 368, for SPY.

Note:  Posts on this site are for education purposes only.  They provide one firm’s insight on the markets.  Not investment advice.  See additional disclaimer here.

Bear Flag … Bear Market

Bear flags post in a bear market

Bull flags post in a bull market

Right?

One would think.

It’s different though, if you’re a rabid ‘not-right-in-the-head’ gold bull.

The professional does not care which direction the market is heading. The only important thing is, and to paraphrase Livermore:

‘There’s only one side of the market to be on … and that’s the right side.’

GDX has posted and tested a bear flag.

At this juncture, it’s heading lower … possibly to test between 15 – 17, as was just mentioned yesterday, by Van Metre (time stamp 10:00).

Conversely, in the general equity markets, there’s reversal action with the S&P, Dow, Russell, all lower.

On top of that, bonds are in their own reversal (up again in the pre-market) as well as the dollar.

In the Van Metre link above, in addition to comments on gold, he also sates ‘the market is not prepared for a bond (and dollar) reversal.

When markets are sure of one thing and the other happens, it’s very ugly.

Charts by StockCharts

Note:  Posts on this site are for education purposes only.  They provide one firm’s insight on the markets.  Not investment advice.  See additional disclaimer here.