Beginning at time stamp 6:24, at this link, The Maverick goes through an investigation into NVDA, projections.
‘Something doesn’t add up here ….’
That report was three weeks ago. What’s happened, lately?
As of the close this past Friday, NVDA, the largest in the SOXX, was at $1.1-Trillion, market cap. A distant second, is Taiwan Semi (TSM) at $545.5-Bln.
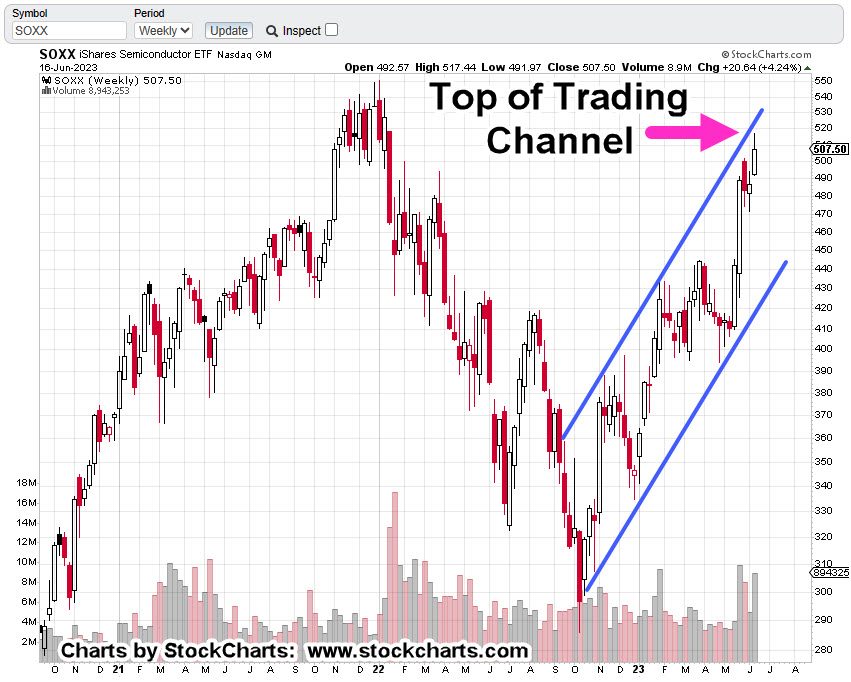
Below, we have a confluence of events for the SOXX.
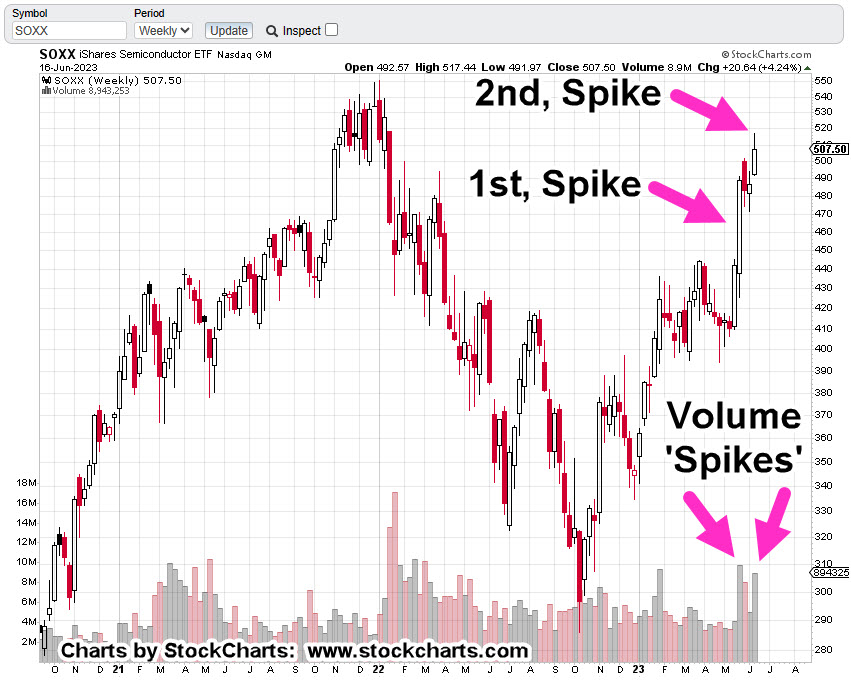
Semiconductor (ETF), SOXX, Weekly Candle
We’re at the top of a trading channel.
We’re in Wyckoff ‘Up-Thrust’ (reversal) position.
A lot of volume expended with less (net) upward progress than previous volume spike; ‘effort vs. reward’.
Getting down to the daily, we see a terminating wedge that’s coupled with reduced volume.
Semiconductor Index SOXX, Daily Candle
So, what does that mean?
The ‘probabilities’ for more upside are, or have been, reduced significantly (not advice, not a recommendation).
Note: Posts on this site are for education purposes only. They provide one firm’s insight on the markets. Not investment advice. See additional disclaimer here.
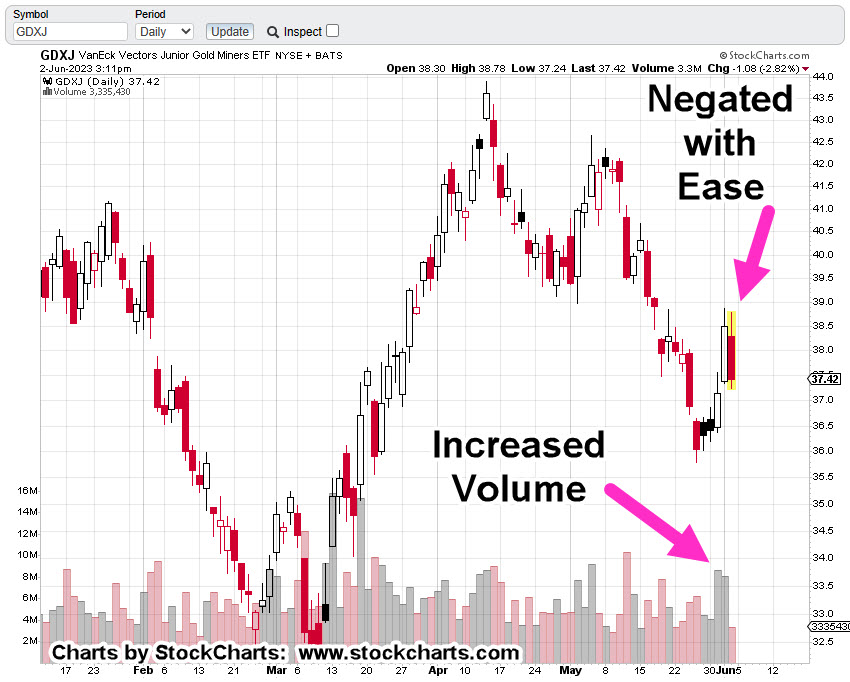
With today’s outside-down (as of 2:43 p.m., EST), that makes it two key reversals for GDXJ, in the past five trading days.
While it looks like the whole herd is focused on the new mania, Artificial Intelligence, back at the ranch, the miners are painting an ominous picture.
Rendezvous With Destiny
The first two-minutes and ten seconds, at this link, are all that’s needed to get the idea of what’s likely to come.
The market recovered (fairly quickly) from 1987 … this time, may indeed be different.
The Elephant Sleeps
Ah, yes. The elephant no one talks about … or more accurately, are afraid to talk about.
Three links here, here and here, show us the elephant may be about to awake.
From the bottom, May 25th to now, is a Fibonacci 13-Days.
Is that important?
Here’s a prior analysis on Real Estate IYR, that shows how Fibonacci can identify the pivot point, trend and/or trading channel.
Now, back to the Juniors.
The mining sector appears to be under pressure. Each attempt to rally is being thwarted.
Compressed view of the channel, below.
The Fed announcement at 2:00 p.m., EST tomorrow, may or may not have any material effect. The sector may just continue lower …. slowly, without much fanfare (not advice, not a recommendation).
Note: Posts on this site are for education purposes only. They provide one firm’s insight on the markets. Not investment advice. See additional disclaimer here.
Early in today’s session, the Junior Miners GDXJ, posted a new daily low and new weekly low. That helps the downside probabilities (not advice, not a recommendation).
As mentioned in the prior update, when price action penetrates existing lows, there’s a good chance of ‘spring’ action as a result. The market attempts to rally.
Sometimes it’s successful; other times, not.
The attempt to rally after posting new lows is what GDXJ is doing now (as of 2:15 p.m., EST).
Junior Gold Miners GDXJ, Weekly Bar
In the weekly chart below, note how the close, then open, then close and then open again, are to each other.
That ‘narrowness’ signifies either resistance or support, in this case, resistance.
Where the sector closes for the day may an important clue if we’ll continue to the downside.
Note: Posts on this site are for education purposes only. They provide one firm’s insight on the markets. Not investment advice. See additional disclaimer here.
Let’s go back to the last update on Tesla (TSLA), and see how that analysis is working out:
“Unless we reverse right here and now, Fibonacci retrace and projections (shown below) target the $260 – level for TSLA.”
That was back in early March.
Now, TLSA is currently trading (as of 11:30 a.m., EST) at 246.71, and pushing higher.
The original chart of TSLA, from the March 5th, update is below, followed by current activity.
Tesla TSLA, Daily
Original analysis.
Updated chart (11:15 a.m., EST):
From a trading perspective, TSLA, is being used as a proxy for the market.
That means, if there’s to be a reversal at or near the 259-area, it’s likely the overall market will reverse as well (not advice, not a recommendation).
The ‘Ponzi’ has already been established (the last update). We see the delusion continues with reports like this.
Note: Posts on this site are for education purposes only. They provide one firm’s insight on the markets. Not investment advice. See additional disclaimer here.
Note: Posts on this site are for education purposes only. They provide one firm’s insight on the markets. Not investment advice. See additional disclaimer here.
With less than an hour into the session, Junior Miners (GDXJ), have tapped upper resistance, pushed past by just 0.07-points, and are now eroding to the downside.
If the index continues lower, it has the classic near textbook look of ‘bump and run’.
It’s a price action response to stops placed just above resistance that get executed and then the market continues lower.
If that’s the case, it could get very serious to the downside (not advice, not a recommendation)
Short positions via JDST, have been maintained with a hard stop at today’s JDST, low of 5.974 (not advice, not a recommendation).
Note: Posts on this site are for education purposes only. They provide one firm’s insight on the markets. Not investment advice. See additional disclaimer here.
So, how’s any business going to operate profitably in an environment that’s systematically being disrupted?
Those that could come up with a plan (for their company or business) in such an environment, i.e., the ‘competent‘, are leaving in droves; letting the slackers, back-biters, corporate gossips, and the incompetent, finally have free rein.
This phenomenon likely applies to all major businesses. We already see the entrenchment.
Then, The Fed
Then, there’s the Fed. Surely, when they see how bad things are, they’ll lower rates; Right?
‘When the Fed realizes the economy’s in a recession, they’re going to lower rates‘.
That’s ‘normalcy bias’. We’re in a new construct: There’s no Fed ‘pivot’, rate lowering, or any ‘accommodation’ in sight.
On top of that, some have figured out, things aren’t quite right at the Fed; looks like different ‘forces’ are at work.
Go to time stamp 10:50 at this link (warning, contains profanity).
Then, The ‘Stackers’
So, we’ve gone from stacking toilet paper to stacking what’s thought to be precious metals.
First, it’s fake silver … and then, even the Perth Mint got into the act with ‘diluted’ gold bars.
As stated, years ago, during the Texas Freeze, when it really hits, the grid goes down, nothing’s working, it’s freezing outside, precious metals are nowhere on the list (not advice, not a recommendation).
Then, The VIX
As if all of the above was not giving us clues that something’s about to happen, there’s the VIX.
If you believe the talking heads and ‘finance’ YouTube sites that claim the debt deal will cause massive inflation, well then, let’s pose the following question.
If that was true, why are gold and silver not responding in a huge bull market with upward leaps (a la 1995, S&P) each day, then week and month?
Those close to the market always know something; their actions show up on the tape.
It could be we’ve already past the top in spending …. just by market pressures alone. It’s possible, all that extra allocated ‘pork’ may never get implemented (not advice, not a recommendation).
Lastly, The Miners
The miners GDX, GDXJ, have been in a bear market for years with all-time highs (GDXJ) during the first half of 2011.
Since then, the sector is down over 72%
It’s interesting, that this high stress, physically demanding industry with risk of danger ever present (here, here and here) reached a bear market peak in mid-2020, just as certain ‘items’ were being mandated.
Junior Miners GDXJ, Daily
As the competent leave the general workforce, would the resulting lack of accountability make itself known first in professions where stupidity causes direct effect in reduced production and/or increased accidents?
The GDXJ is at an interesting juncture.
It’s currently under resistance (blue line) that has already been tested.
At the end of the session today, we’re a Fibonacci 8-Days from the low set on May 25th.
If the index is going to reverse lower from here, this is a likely place to start.
Another attempt at resistance would indicate more upside pressure than anticipated; any existing short positions would be closed (not advice, not a recommendation).
Note: Posts on this site are for education purposes only. They provide one firm’s insight on the markets. Not investment advice. See additional disclaimer here.
Note: Posts on this site are for education purposes only. They provide one firm’s insight on the markets. Not investment advice. See additional disclaimer here.
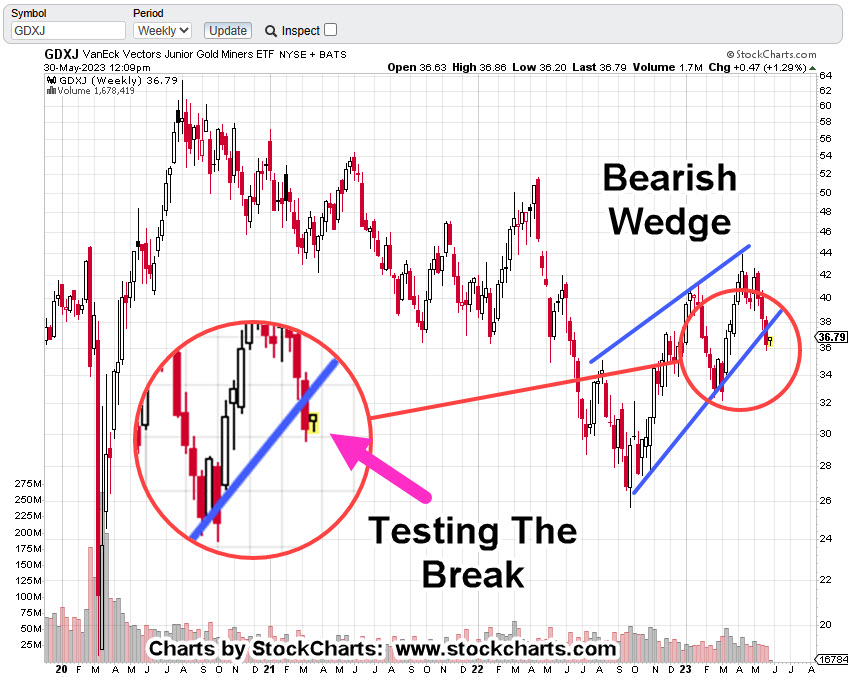
If it’s frustrating for the bears, it’s got to be frustrating for the bulls as well.
Pulling back and looking at GDXJ action without emotion, it’s clear we’re still in the ‘test’ (as we’ll see below) that’s been the topic of discussion over the past several updates.
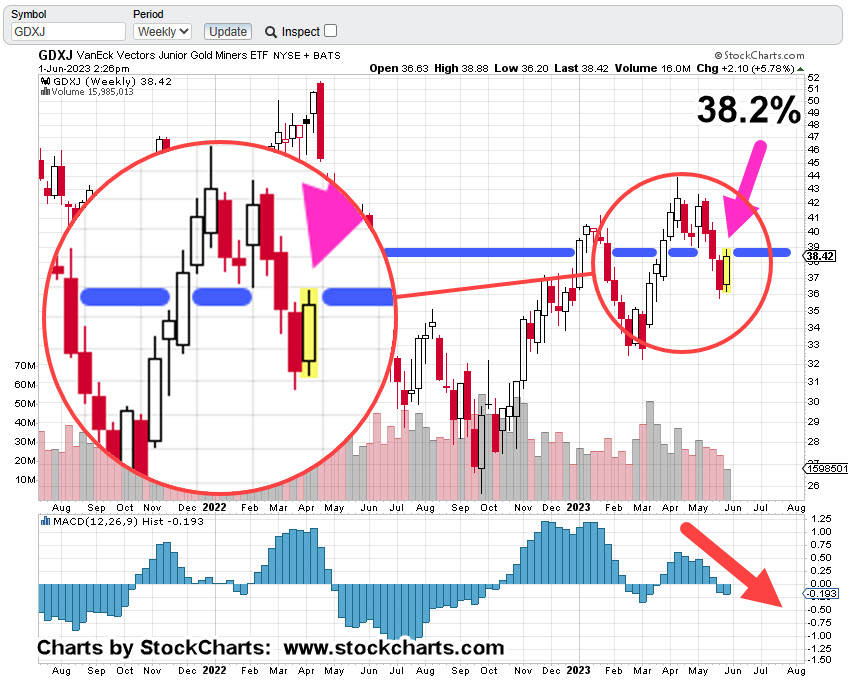
The weekly chart of GDXJ, shows that even with today’s (as of 3:04 p.m., EST) retrace and test, we’re still in a negative divergence on the MACD (orange arrow).
Junior Miners GDXJ, Weekly
The horizontal blue line is not only an axis/resistance line, it’s also the Fibonacci 38.2% retrace of the GDXJ down move, April 13th, to May 25th.
We’re about an hour before the close and price action’s starting to erode from the highs.
If the downtrend is to continue, this may be a low-risk area for the shorts via JDST (not advice, not recommendation).
Note: Posts on this site are for education purposes only. They provide one firm’s insight on the markets. Not investment advice. See additional disclaimer here.
The ‘Artificial Intelligence’ (AI) clown show’s in full swing with a ‘predicted‘ single quarter target of $11-Billion, from NVDA.
That’s not to be confused with the budget clown show just ended in Washinton D.C.
And where does that leave Tesla? They seem to be left out of the latest round of cult-like insanity.
Back in the day, Dr. Alexander Elder stated, professionals don’t look for the ‘challenge’ in the markets (trying to figure out the NVDA, top), they look for the ‘money’ … there’s a huge difference.
Junior Miners GDXJ, Weekly Candle
As of 12:35 p.m., EST, from a technical perspective, even though we’re up for the day (so far), MACD momentum’s increasing to the downside (magenta arrow).
Nobody seems to be paying attention to gold and silver; all eyes are focused on the next shiny object.
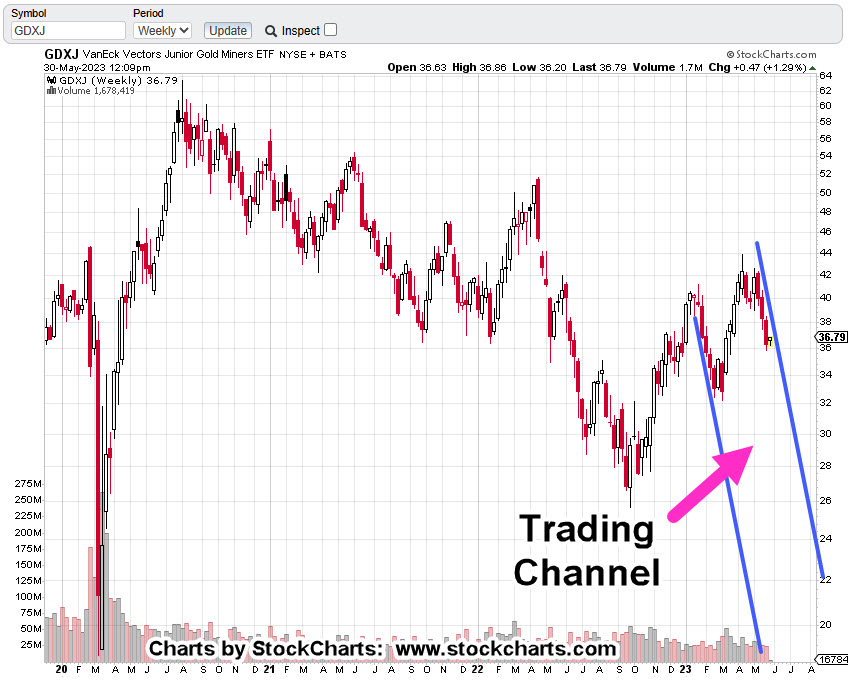
Pulling out a bit farther on the weekly, there’s no question we’re in a channel.
The question is, are we (GDXJ) going to say in that channel or reverse from here?
The last update said we’d likely be testing the wedge break and that’s what’s happening.
A ‘test’ will take however long is needed. It’s either pass or fail. Pass in this case is resumption to the downside.
Technical conditions (MACD, wedge break) favor the downside (not advice, not a recommendation).
In addition, we need to keep in mind there’s a new circus in town; the miners may be well on their way to more downside before anyone steps out of the big-top to notice.
Note: Posts on this site are for education purposes only. They provide one firm’s insight on the markets. Not investment advice. See additional disclaimer here.