Note: Posts on this site are for education purposes only. They provide one firm’s insight on the markets. Not investment advice. See additional disclaimer here.
Note: Posts on this site are for education purposes only. They provide one firm’s insight on the markets. Not investment advice. See additional disclaimer here.
Note: Posts on this site are for education purposes only. They provide one firm’s insight on the markets. Not investment advice. See additional disclaimer here.
As usual, we have the rabid gold and silver bulls, breathless; ‘This is it!’, ‘This is the big one!’, ‘Dollar collapse, imminent!’
All the while, nobody’s reporting the fact, that ever since ‘The Speck’ was introduced in 2019, and of course, Speck ‘protection‘, gold production has dropped to 2014 levels, and has not recovered (source, Statista).
Is it as simple as ‘supply and demand’? Is the ‘inflation’ narrative, just another ruse?
Even as gold and silver are rising (for now), the mining sector’s GDX, GDXJ, are far below their all-time highs.
As if to put icing on the cake, Newmont, appears to have reversed (not advice, not a recommendation).
Newmont Mining NEM, Daily (inverted)
Similar to recent biotech analysis, we’re inverting the chart to show the potential.
Note: This ‘inversion’ technique is a psychological exercise covered in one of Dr. Elder’s books (here and here).
It’s a basic fundamental for un-biased analysis.
Back in the day, while publishing on SeekingAlpha (a whole story in itself), users of that site would complain about charts being ‘upside down’. 🙂
Moving on, we have the following:
There’s a lot going on in this chart.
Price action has recoiled off the support (resistance non-inverted) and is now at a point where it may attempt to retrace for a test.
MACD has become successively bullish; now has a crossover signal.
As shown in prior updates here and here, the support level’s in the vicinity of the 23.6%, retrace.
That indicates bullishness on the chart above or weakness on non-inverted (not advice, not a recommendation).
Note: Posts on this site are for education purposes only. They provide one firm’s insight on the markets. Not investment advice. See additional disclaimer here.
Note: Posts on this site are for education purposes only. They provide one firm’s insight on the markets. Not investment advice. See additional disclaimer here.
Note: Posts on this site are for education purposes only. They provide one firm’s insight on the markets. Not investment advice. See additional disclaimer here.
Can we go further to say, a ‘set-up’ within a ‘set-up’?
With the caveat that absolutely anything can happen, let’s look at what may be a competed test on the weekly time frame while at the same time, a completed up-thrust set-up on the daily time frame.
First, the weekly using the inverted chart.
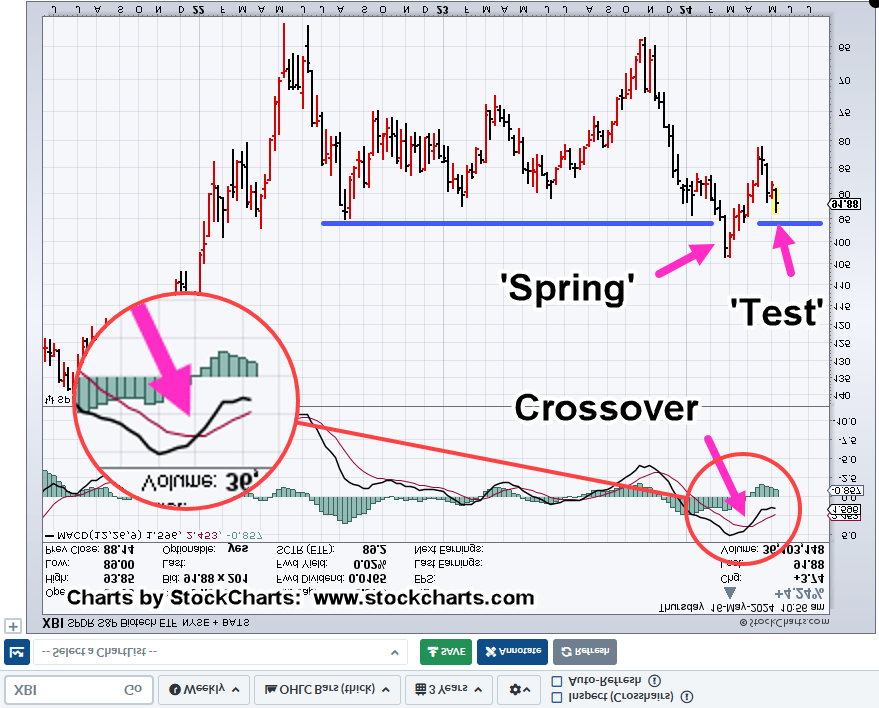
Biotech XBI, Weekly (inverted)
As a reference, here’s the link to the prior weekly chart, discussing the spring ‘test’ set-up.
Moving on to the daily we have the following. Note, the daily has been inverted as well.
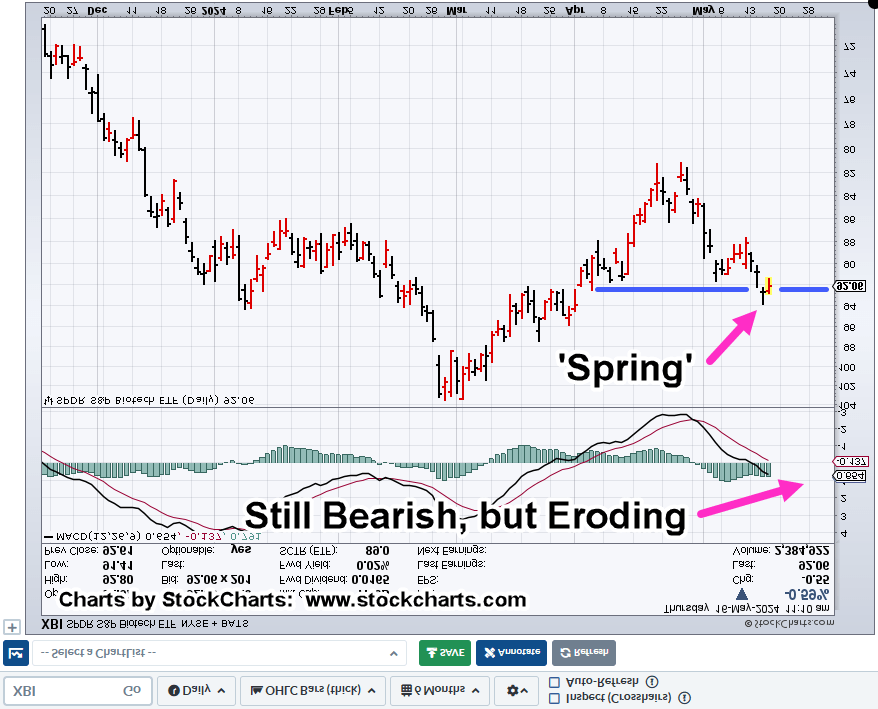
Biotech XBI, Daily (inverted)
From an MACD indicator standpoint, we’re still in bearish territory (bullish on the regular chart).
The entire trade set-up could evaporate.
So, there’s no doubt, we’re at The Danger Point®
From yesterday’s update the market itself has shown its stop level for a short position (not advice, not a recommendation).
Looking at the two charts, it’s possible to see a test of a spring on the larger weekly time frame which may itself have created a spring set-up on the daily timeframe: corresponding to up-thrust test, and up-thrust for non-inverted XBI.
Consider that this is all happening while the broader markets are making new all-time highs.
Note: Posts on this site are for education purposes only. They provide one firm’s insight on the markets. Not investment advice. See additional disclaimer here.
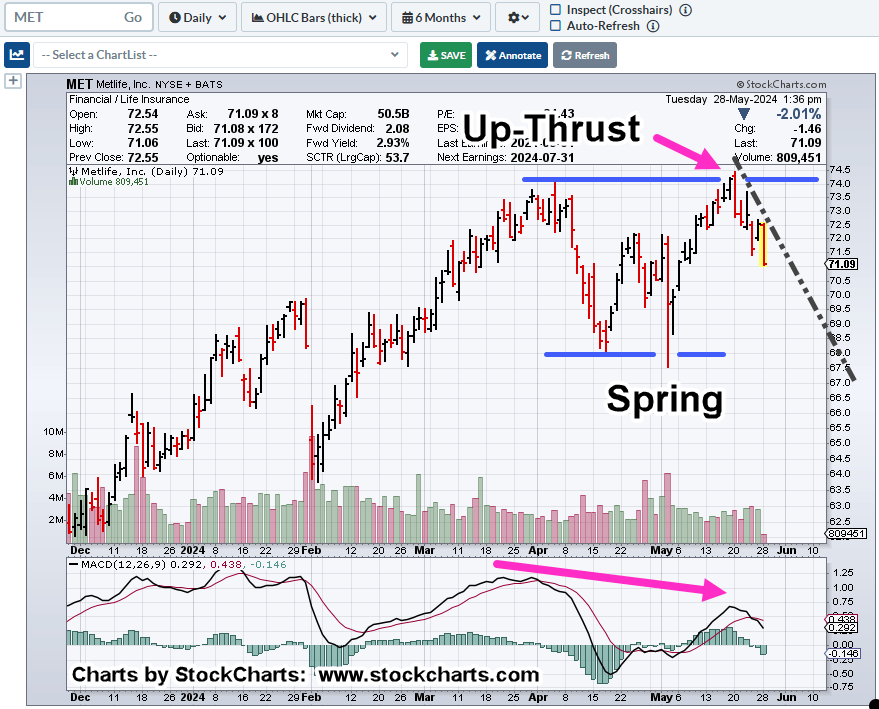
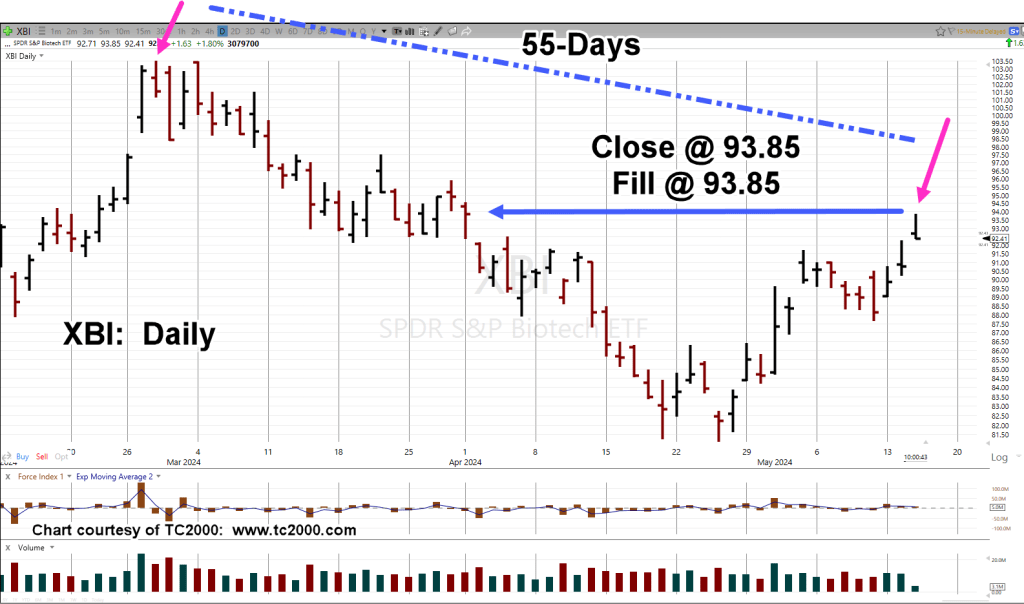
Was this morning’s launch higher in biotech a ‘gut-check’ of the up-thrust (set-up), or just filling the gap left from the April 2nd, move lower?
The Fibonacci 55-Day, count remains intact as it moves from the closing high of February 27th, to the ‘print’ high of the 28th.
As of this post (10:40 a.m., EST), XBI has already retraced back to the top of yesterday’s trading range.
As we look at the chart, it’s important to note today’s early session high was 93.85, the exact closing price of the ‘gap’ created on April 1st, and 2nd.
Biotech XBI, Daily
If this action really is just a test of the larger scale up-thrust (described here), one gets the sense a significant move lower may be at hand (not advice, not a recommendation).
We’re just over an hour into the session and XBI has posted a clean reversal bar for the first hour.
In the event there’s no significant move lower, and the set-up fails, today’s high represents a good stop level for a short position (not advice, not a recommendation).
Note: Posts on this site are for education purposes only. They provide one firm’s insight on the markets. Not investment advice. See additional disclaimer here.
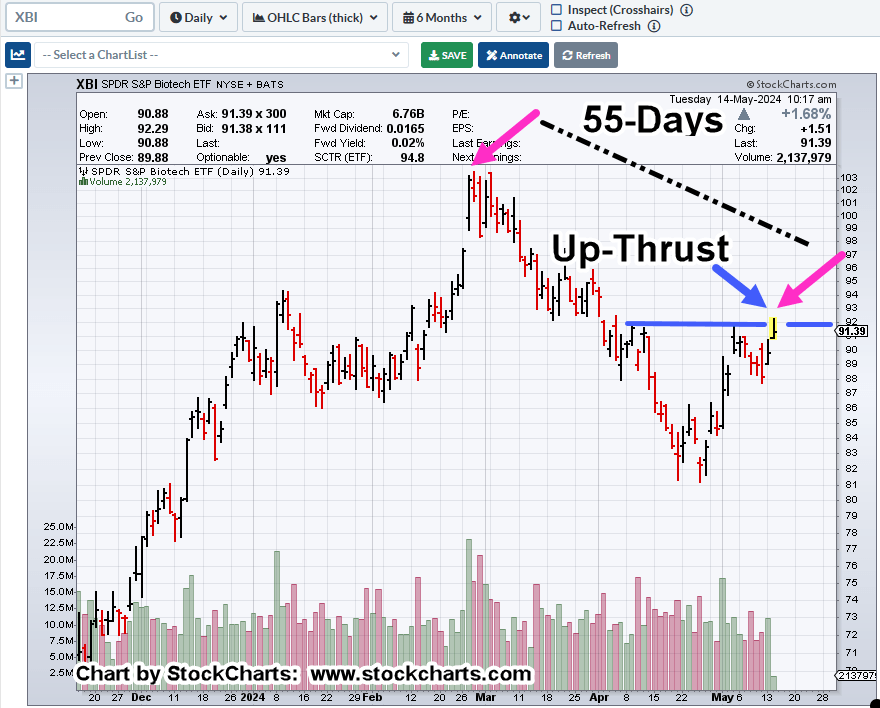
“However, it’s just a sneaky suspicion, XBI may try to inch itself past the daily highs of April 9th, and April 11th (not advice, not a recommendation).”
Fast forward to now and here we are.
We’re at Fibonacci 55-Days, from the closing high on February 27th; today’s price action opened the session by penetrating highs of April 9th and April 11th.
Doing so, puts XBI in up-thrust (potential reversal) position.
Biotech XBI, Daily
We can say, XBI is at The Danger Point®
As this post is being created (10:34 a.m., EST) price action appears to be eroding from the early session push higher.
The typical market characteristic for XBI, is to retest in the second hour or so of trading; in this case that would mean a move back to the highs.
If that does not happen, it adds weight to the potential reversal scenario (not advice, not a recommendation).
Note: Posts on this site are for education purposes only. They provide one firm’s insight on the markets. Not investment advice. See additional disclaimer here.
Note: Posts on this site are for education purposes only. They provide one firm’s insight on the markets. Not investment advice. See additional disclaimer here.