Note: Posts on this site are for education purposes only. They provide one firm’s insight on the markets. Not investment advice. See additional disclaimer here.
From a Wyckoff and David Weis analysis perspective, wide high-volume, price bars tend to be tested.
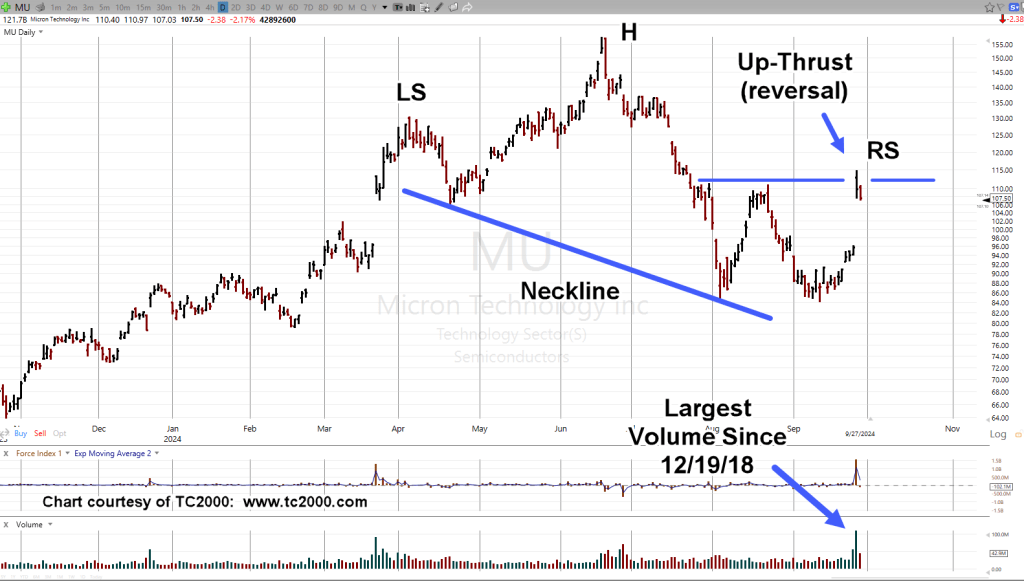
What does that tell us (to anticipate) with Micron’s huge gap-up with volume?
When we go to the chart, we see more … a lot more.
Frist off, let’s not forget, Micron’s Number Nine, in market cap within the SOXX, tracking ETF.
Its price action behavior (significantly) affects the index.
Micron Technology MU, Daily
We’ve got a (possible) Head & Shoulders. with an Up-Thrust, precipitated by good news (here and here).
It’s been 70 (trading) Days since Nvidia hit all-time highs; a high forecasted, then confirmed here and here:
Back then, was this:
“With the prior update letting us know the air is going out of support for continued A.I., today’s action may be a significant reversal (not advice, not a recommendation).”
It was significant. Nvidia has not been there since.
Implications
The implication with the (still holding) Nvidia top, is the A.I. bubble has burst.
Possibly the largest asset bubble in world history.
What we’re seeing with Micron, is potentially the last gasps of short covering, with an attempt to mount a rally in an overall deflating market (not advice, not a recommendation).
Note: Posts on this site are for education purposes only. They provide one firm’s insight on the markets. Not investment advice. See additional disclaimer here.
Note: Posts on this site are for education purposes only. They provide one firm’s insight on the markets. Not investment advice. See additional disclaimer here.
Note: Posts on this site are for education purposes only. They provide one firm’s insight on the markets. Not investment advice. See additional disclaimer here.
Note: Posts on this site are for education purposes only. They provide one firm’s insight on the markets. Not investment advice. See additional disclaimer here.
If you know something’s coming, then you can keep your head when it actually happens.
Nothing seems to bring out the (dollar collapse) pundits more than precious metals and specifically silver; we can throw in Nvidia as well, but that’s another story.
Strategically, Wyckoff analysis all the way back to April, of this year has proven correct.
That is, silver is not launching into some kind of hyperinflation breakout; it would have already done so.
No, silver is either preparing for a downside reversal or sideways congestion (not advice, not a recommendation).
We have one datapoint after another, the consumer is strapped; corporations, industries using silver are collapsing, going bankrupt; bullion dealers themselves have said silver demand has evaporated and on it goes.
With that, let’s look at what silver (SLV) is telling us.
Silver SLV Tracking ETF, Weekly
As of this post (10:45 a.m., EST), silver (SLV) is nearing yesterday’s high of 29.44
We’ve got a weekly bearish divergence that will be in effect if there’s a breakout and downside reversal (not advice, not a recommendation).
Of course, the question is, what happens if/when we get a breakout?
One thing is almost for sure, the ‘dollar collapse’ pundits, YouTubers et al., will be out in force. 🙂
Note: Posts on this site are for education purposes only. They provide one firm’s insight on the markets. Not investment advice. See additional disclaimer here.
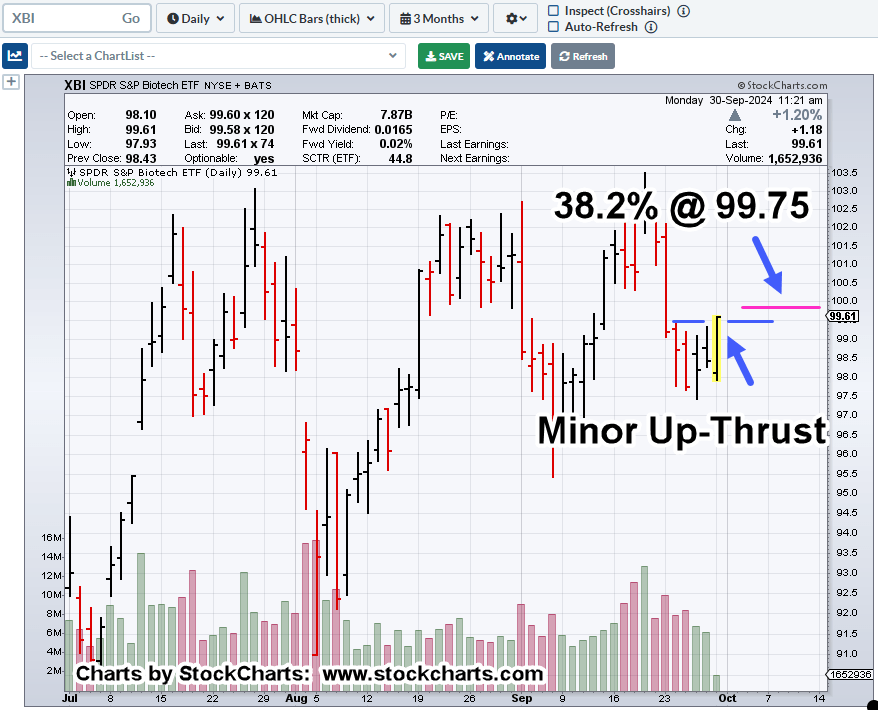
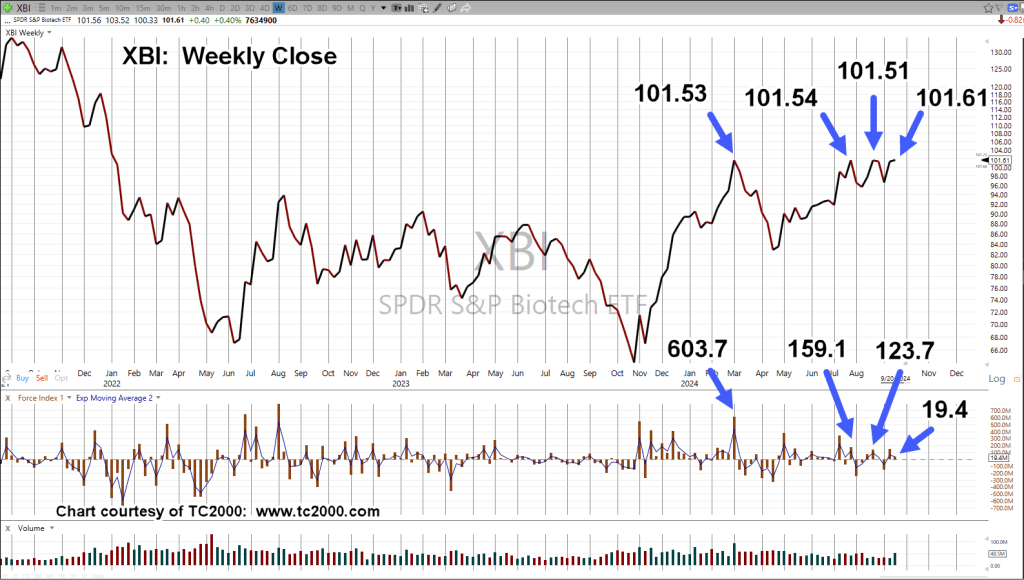
Wyckoff (tape reading) analysis identified the potential reversal in XBI.
In the past two days of trading, biotech XBI, is decisively lower (not advice, not a recommendation).
However, there’s more to this story.
As we’ll see below, Fibonacci is at work as well.
Biotech XBI, Daily Close
From closing high on 2/27/24, to closing high on 9/19/24, was a Fibonacci 144 days (minus one).
Ladies and Gentlemen, it doesn’t get much better 🙂
The black lines show resistance penetration, up-thrust and reversal.
Livermore, Wyckoff & Loeb
The trading methods of the three market masters above, can be summarized as:
Strategy, Tactics and Focus.
Livermore’s method of ‘what’s going to happen in a (potential) big way’, pointed to biotech.
Wyckoff’s analysis was used to identify (to the day), the potential for a significant reversal.
Loeb, who is less known, was the former Vice Chairman of E.F. Hutton, disparaged ‘diversification’ as the ‘averaging of errors’; meaning, if you don’t know what you’re doing (in the markets), you ‘diversify.’
We can see all three at work in the selection to go short biotech via LABD (not advice, not a recommendation).
Fixing Errors
For those watching, you got to see up close and personal a trading error on shorting the SOXX; specifically, an -11.6%, hit, link here.
As of this post, four trading days later, that loss has been fully recovered and then some.
This is how should be done.
Clear the mind, look for (don’t force) another opportunity, get to back to business.
Note: Posts on this site are for education purposes only. They provide one firm’s insight on the markets. Not investment advice. See additional disclaimer here.
The (potential) big ruse, interest rates are heading lower. We have the usual suspects, spinning how soon we’ll have the next rate cut.
Well, back at the ranch, home builder Lennar Corp. (LEN), posted massive down-thrust, selling energy this past Friday, after Thursday’s post-market earnings release.
As we’ll see below, force on the move was potentially the second highest ever, in the history of trading for the company (data going back to 10/5/18).
Lennar Corporation LEN, Daily
At this point (11:27 a.m., EST) LEN is having an ‘inside day’, trading within Friday’s price action.
Inside days are typically preparation for another kind of day, an ‘outside’ day 🙂
That’s where the trend is confirmed (not advice, not a recommendation).
Note: Posts on this site are for education purposes only. They provide one firm’s insight on the markets. Not investment advice. See additional disclaimer here.
The market gives us clues, we just need to know where to look.
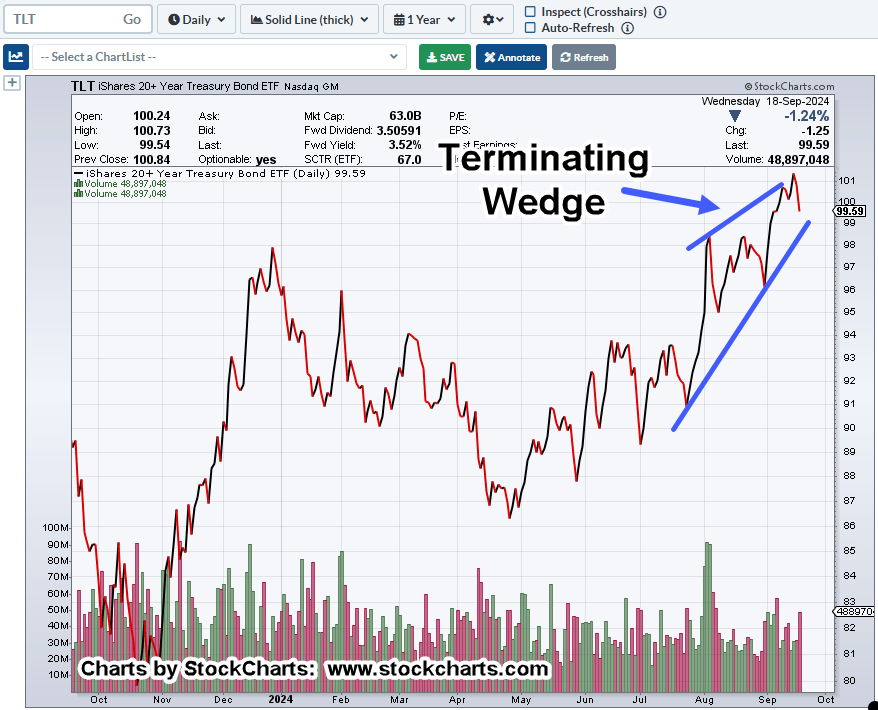
Even before last Wednesday’s Fed announcement, bonds were already heading lower (rates higher), reversing the day before.
Tuesday through Friday had successive lower closes in long bonds, TLT.
All of that, to wind up the week ‘outside down’, or posting a ‘key reversal’.
Those don’t happen often.
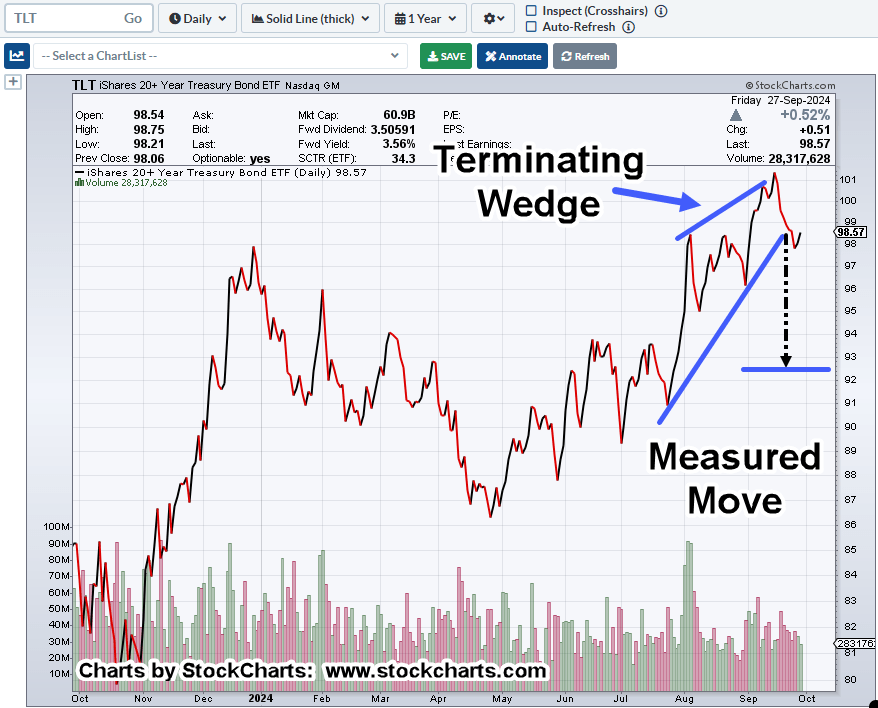
Long Bonds TLT, Weekly
The last outside-down weekly bar (in an uptrend) was over two years ago.
Bond prices declined 32%, before recovering.
In what seems to be a recurring theme, Force Index (like XBI, NVDA) is telling us there’s little-to-no-energy left to move prices higher (rates lower).
Of course, anything can happen, and reversals can themselves be reversed.
However, if bonds continue lower, it’s probably time to get the popcorn ready to see how the media paints the picture.
Note: Posts on this site are for education purposes only. They provide one firm’s insight on the markets. Not investment advice. See additional disclaimer here.
Note: Posts on this site are for education purposes only. They provide one firm’s insight on the markets. Not investment advice. See additional disclaimer here.