Note: Posts on this site are for education purposes only. They provide one firm’s insight on the markets. Not investment advice. See additional disclaimer here.
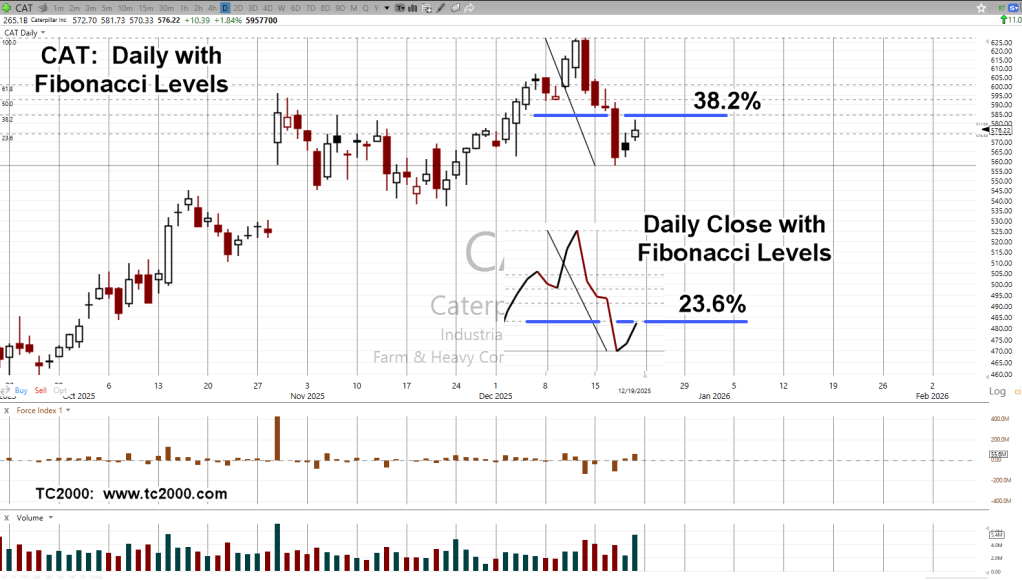
As the tagline says, we had two Fibonacci levels posted by CAT on Friday.
The chart shows a print low on the 17th, to Friday’s high, was 38.2% retrace of the move from all-time highs.
The insert shows the close version of the same chart. On a close basis, CAT retraced 23.6%.
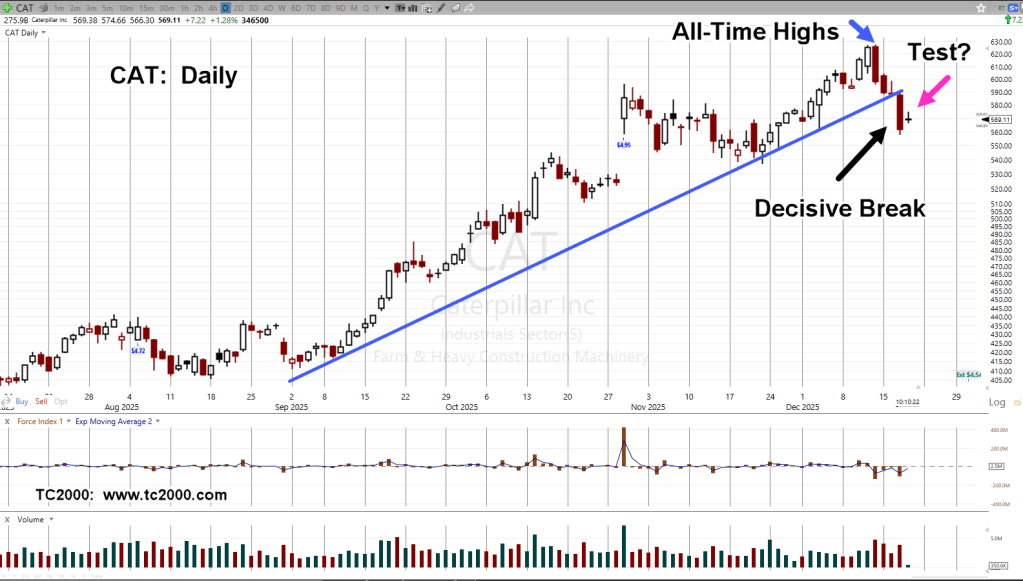
Caterpillar CAT, Daily
Note the action of the past two trading days were ‘inside’ the down bar posted on the 17th.
With the trend break from the prior update, then posting a retrace of two Fibonacci levels simultaneously, plus the large high-volume bar (on the 17th), suggests the upside test may be complete (not advice, not a recommendation).
The week ended with multiple records set, link here.
Note: Posts on this site are for education purposes only. They provide one firm’s insight on the markets. Not investment advice. See additional disclaimer here.
Note: Posts on this site are for education purposes only. They provide one firm’s insight on the markets. Not investment advice. See additional disclaimer here.
Note: Posts on this site are for education purposes only. They provide one firm’s insight on the markets. Not investment advice. See additional disclaimer here.
Note: Posts on this site are for education purposes only. They provide one firm’s insight on the markets. Not investment advice. See additional disclaimer here.
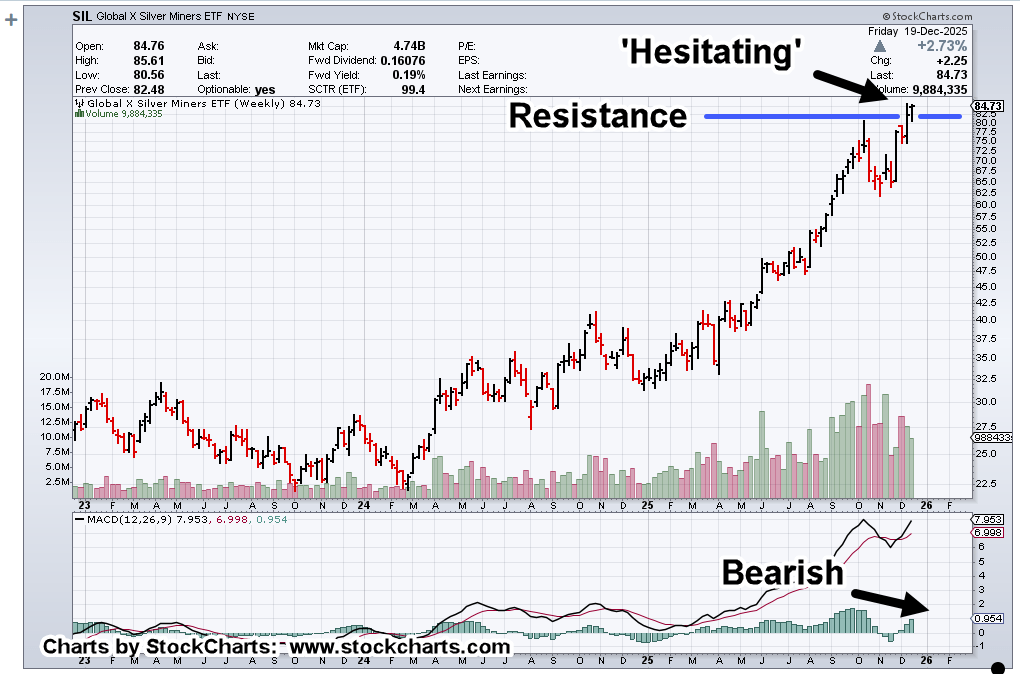
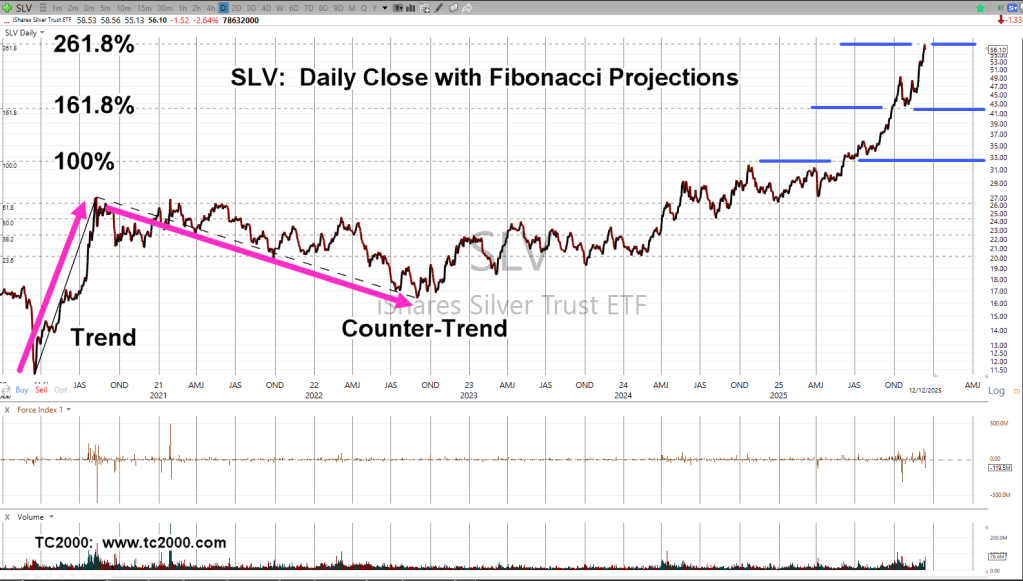
Silver miners SIL, are at highs not seen in over a decade.
We already know, silver SLV, is at a Fibonacci projection and possible pivot, link here (not advice, not a recommendation).
It’s no stretch to say the media is screaming about silver ‘breaking its shackles’.
Oh, that’s just great.
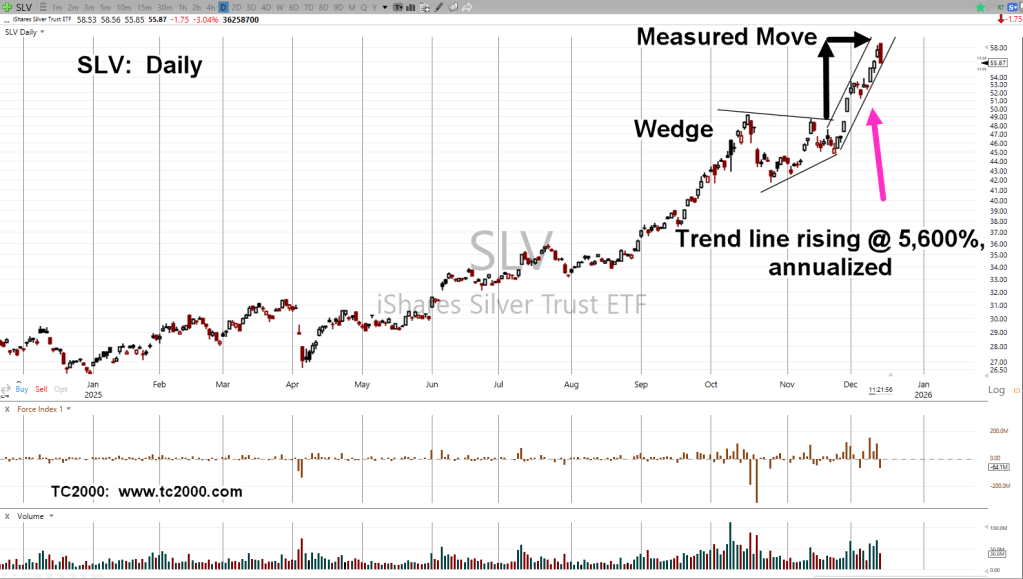
If true, and with silver being such a thin market, then those ‘shackles’ may have kept the market organized, preventing massive, high volatility, low liquidity swings over the years.
Note: Posts on this site are for education purposes only. They provide one firm’s insight on the markets. Not investment advice. See additional disclaimer here.
Note: Posts on this site are for education purposes only. They provide one firm’s insight on the markets. Not investment advice. See additional disclaimer here.
AutoZone’s down -21.48% from all-time highs with -13.78% of that, in just December, alone.
Price action posted a wide, high-volume bar on earnings, that ‘missed’.
What we’re looking for now, is a test of that wide bar; then, to see if AZO rolls over into a (sustained) decline, or if that was the end of the current down move (not advice, not a recommendation).
AutoZone AZO, Daily
At this point, there’s been no follow-through after hitting support which suggests there could be a ‘spring’ attempt.
On a weekly basis (not shown), the downthrust energy Force Index, was the second highest ever, for AZO.
Note: Posts on this site are for education purposes only. They provide one firm’s insight on the markets. Not investment advice. See additional disclaimer here.
Note: Posts on this site are for education purposes only. They provide one firm’s insight on the markets. Not investment advice. See additional disclaimer here.
Note: Posts on this site are for education purposes only. They provide one firm’s insight on the markets. Not investment advice. See additional disclaimer here.