Note: Posts on this site are for education purposes only. They provide one firm’s insight on the markets. Not investment advice. See additional disclaimer here.
No one knows if this is ‘The top’, or just ‘A top’, until it’s all over (not advice, not a recommendation).
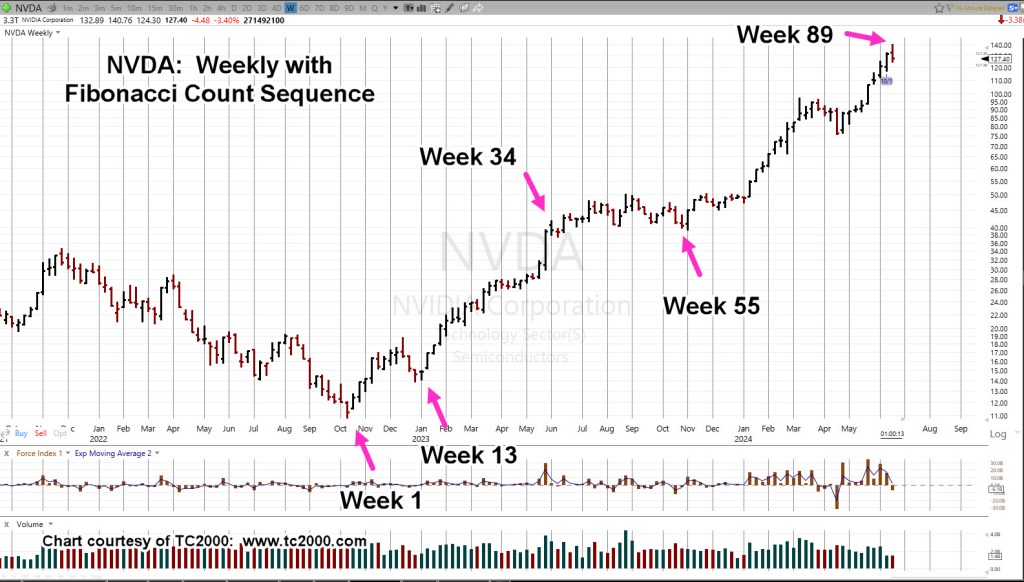
This update for Nvidia, said we’re nearing Fibonacci Week 89 (from the October ’22, lows); look for evidence of a reversal.
With three-hours left in the session, NVDA is on track (along with the SOXX) to posting a weekly reversal bar.
Nvidia NVDA, Weekly
The chart updated to show we’re at ‘Week 89’.
The fact (minus 3-hours) we’re getting a reversal bar on ‘Week 89’, is potential validation of the Fibonacci count.
The market itself is telling us where to look.
With the prior update letting us know the air is going out of support for continued A.I., today’s action may be a significant reversal (not advice, not a recommendation).
Update: 2:07 p.m., EST
Housekeeping Note:
While under no obligation to discuss trades, nonetheless, for those following the biotech short (LABD-24-12), that trade has been exited (for now) with profit (not advice, not a recommendation).
Note: Posts on this site are for education purposes only. They provide one firm’s insight on the markets. Not investment advice. See additional disclaimer here.
Markets reverse in a typical way; first is ‘sentiment’, then ‘volume’, then ‘price’.
According to this link, looks like we have sentiment aplenty; evaporating sentiment, that is.
As stated by Mr. Fred Hickey, VC (Venture Capital) funding peaked last year and has dropped over 75%, since then; that’s the ‘sentiment’ part of the equation.
A partial synopsis of his interview, in the link above:
Time Stamp:
9:15, The greatest bubble I’ve ever seen
11:15, It’s all happened before
11:40, Narrowing market
11:55, Volume decline
16:30, Honeymoon phase is over
17:50, VC spending down 75%
18:05, Everyone knows it’s a joke (except, Wall St.)
And on it goes …
Where’s The Top?
From a Wyckoff perspective, using his analysis (here and here) as a basis of speculation, that’s the wrong question (not advice, not a recommendation).
If we’re expecting some kind of massive reversal (which we are), then the objective is to look for the weakest sectors, not the strongest.
Frequent users of this site already know that work’s been done. One of, if not the weakest sector(s), is Biotech (not advice, not a recommendation).
Is Today, The Day?
With that said, as this post is being created (1:20 p.m., EST), the sector at the center of bubble attention, the SOXX, may have just completed a wedge ‘throw-over’.
Semiconductors SOXX (ETF), Daily
Any number of scenarios can be in play.
At this point, the SOXX, may be in the process of validating the terminating wedge (not advice, not a recommendation).
As Fred Hickey said, it’s the biggest bubble he’s ever seen.
By the time it becomes obvious, it’s way too late for (low-risk) positioning.
Note: Posts on this site are for education purposes only. They provide one firm’s insight on the markets. Not investment advice. See additional disclaimer here.
For a clue to the (potential) answer, we can look at what’s happening to Pfizer, link here and here.
However, let’s not get ourselves wrapped around the axle on events, forecast years ago.
Rather, let’s go straight to the truth, the price action and see what it’s telling us.
Moderna MRNA, Weekly
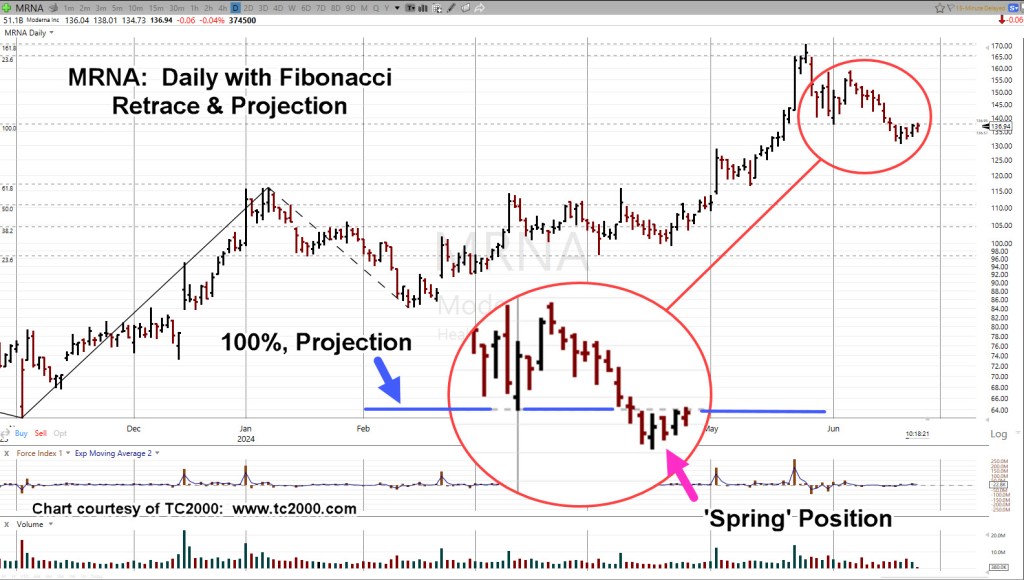
The entire move from low to highs is shown. Included on the chart, are two Fibonacci indicators.
One is the standard ‘retrace’ indicator; the other, is a ‘projection’ indicator.
The ‘projection’ is based off the ‘a-b-c’ move from the lows of November 2nd, 2023, to the highs on May 24, 2024.
The retrace and projections are hard to see, so the ‘Detail‘, arrow is where we’re headed next on the daily.
Moderna MRNA, Daily
If there ever was a chart to once-and-for-all, refute, dismiss, trash, the whole ‘Fundamentals’ argument, that earnings, interest rates or some other ‘Voodoo economics’, moves prices, this is it:
MRNA, price action hit the 23.6% retrace level (exactly) for two days before moving on to hit the 161.8%, projection (exactly) before reversing.
Note the ‘100%‘ level as well; price action confirmed this area (exactly) three times! Once on the way up and two times on the way down (third time, not shown).
A century ago, Livermore said, ‘It’s all about the numbers’.
Strategy, First
Just as Livermore was primary a strategist, so is this site’s method of analyzing the markets, i.e., Strategy, Tactics, Focus, in that order (not advice, not a recommendation).
The news has been replete with reports like this one and this one.
Another panic ahead?
Sounds like it but at least in the case of Moderna, the chart itself says (effectively):
‘There’s no money in it’.
That means, another wave like we saw several years ago, is not the most likely future event (not advice, not a recommendation).
Note: Posts on this site are for education purposes only. They provide one firm’s insight on the markets. Not investment advice. See additional disclaimer here.
The day started out with a bang; market’s up sharply on CPI print.
One could think, months of biotech (short) analysis, has been blown apart with this morning’s sharp move (not advice, not a recommendation).
Remember, this update said watch out for ‘French’ guys:
“However, just like the video snippet in the link above, what looks to be a dramatic conclusion to weeks if not months of work, could be completely derailed by a bunch of ‘French’ guys hanging out in a British castle.”
Well, here they are. 🙂
From a trading, positioning perspective, is it really that bad, what’s going on?
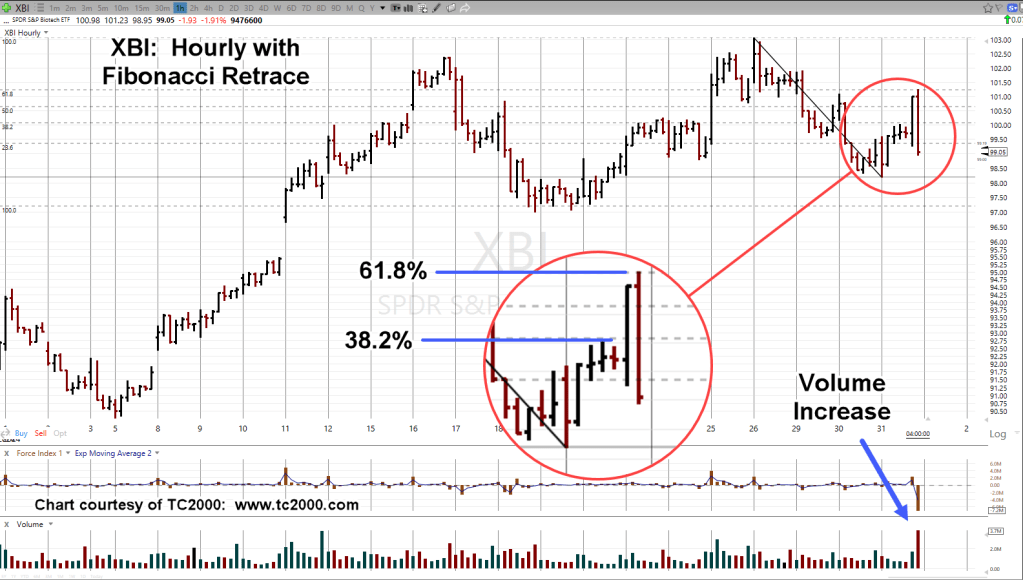
For that answer, we’re going straight to the hourly chart of 3X Inverse Leveraged Fund LABD.
Biotech 3X Leveraged Inverse LABD, Hourly
Early morning price action penetrated the stop level given in this update.
However, as can be seen, price action behavior of LABD was different than (inverse fund) SOXS, under similar conditions; it did not keep going lower but stopped dead.
It’s clear, action at this point, is pulling away from the lows.
Rate Cuts Not
Way back in January of 2023, this site proposed the ‘rate cut’ discussion was nothing more than a ruse; keeping everybody (the press, especially) busy acting like Pavlov’s Dogs, while the big rug-pull was being set-up.
With that in mind, here’s the real story of what’s going on (not advice, not a recommendation).
Positioning
In a little bit of a market ‘cheat’, LABD is currently trading above the prior stop level.
At the risk of making a gross trading error, the short position in biotech (via LABD) is being maintained (not advice, definitely not a recommendation).
However, even as this post is being created (3:15 p.m., EST), biotech XBI continues to erode back into the trading range with LABD, continuing to rise.
Note: Posts on this site are for education purposes only. They provide one firm’s insight on the markets. Not investment advice. See additional disclaimer here.
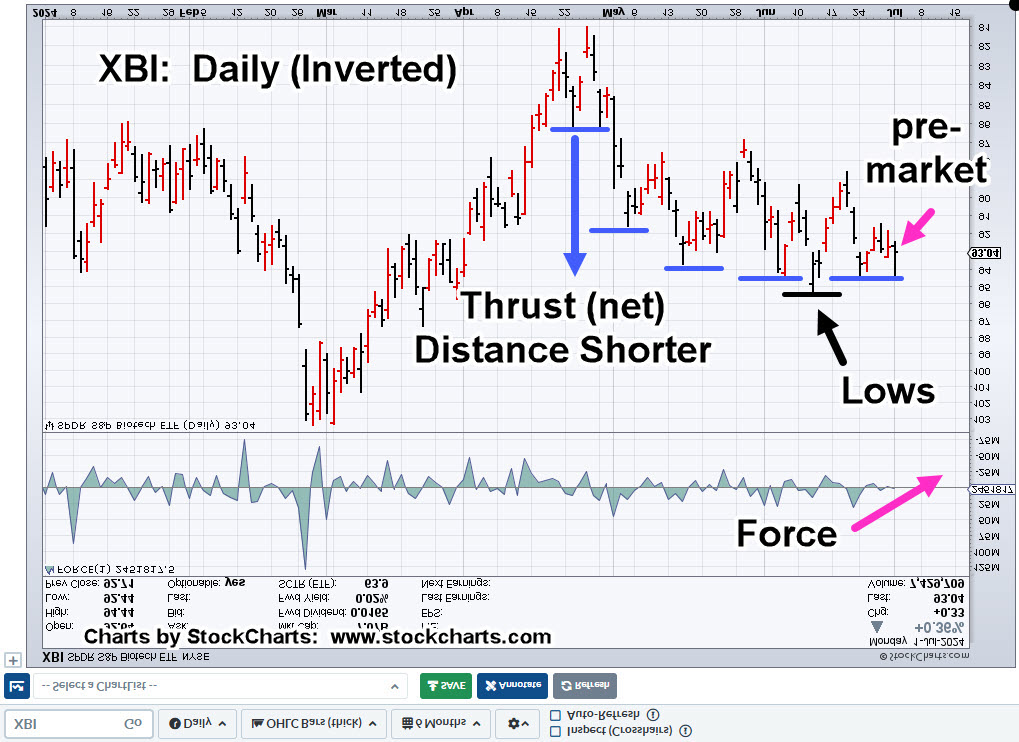
‘If, on the next pull-back, volume contracts, the spring has been tested …’; David Weis
On the chart, that’s what we have.
Today also looks to be an apparent 50%, retrace on Fibonacci Day 3, from the June 6th, reversal.
Taking it all together, the next session(s) could be very interesting.
Biotech XBI, Daily (inverted)
Is it textbook?
We have a spring set-up penetration (resistance non-inverted), a swift move upward and now, a test back to 50% (level not shown), on contracting volume.
If the test is complete, the obvious expectation is for a higher open (lower non-inverted) at the next session (not advice, not a recommendation)
Rule of Alternation
Using this update and the discussion of ‘alternation’, we can already see price action is more volatile and so far, has ‘simple’ form.
Note: Posts on this site are for education purposes only. They provide one firm’s insight on the markets. Not investment advice. See additional disclaimer here.
There are plenty of horror stories selling options. A typical example, is this one.
However, when buying options (to open), as Dr. Elder has said, you have to jump through ‘three hoops at once‘; get it right on the stock, direction, and time.
He goes on to say, working the options market is counter intuitive. Traders naturally gravitate to long-dated, in-the-money options so the trade has time ‘work out’.
His method’s the opposite; short-dated, out-of-the-money.
So, what exactly does that look like?
The XBI, Short-Dated, Put
The situation on biotech, its reversal, first covered here, is a well-known topic on this site.
Using that information, especially this update and this one, probabilities were high for downside the next session.
With that, we have the following.
Biotech XBI, 1-minute
Time stamp on the entry from the broker states: 15:35:10, shown on the chart.
Time stamp on the exit is: 09:31:43, also shown.
Note: Entry was executed as the price of XBI was rising (for nine-minutes), with option value declining.
That rise does not look like much but we’re one day before expiration; option value is fluctuating significantly.
Perfection vs. Effectiveness
After the entry, we see later, there’s a 1-minute ‘blip’ higher before that blip was reversed.
Waiting for entry could have been better from a lower price standpoint.
That blip could have easily gone the other way, option value rising rapidly, low-risk (entry) opportunity gone.
Looking at the chart, one could say that ‘it’s not perfect’ and that’s true.
However, for being in the market just 29-trading minutes, gain of +160%, one could say, it was highly effective.
Note: Posts on this site are for education purposes only. They provide one firm’s insight on the markets. Not investment advice. See additional disclaimer here.
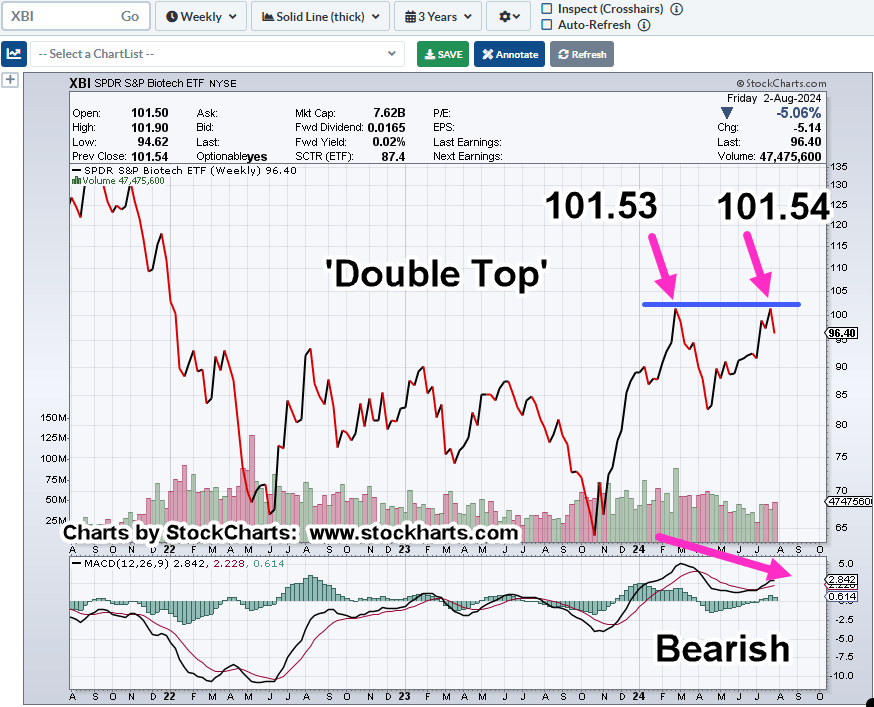
The last update presented a multi-timeframe analysis; medium to long-term (potential) bearish set-up in biotech, XBI.
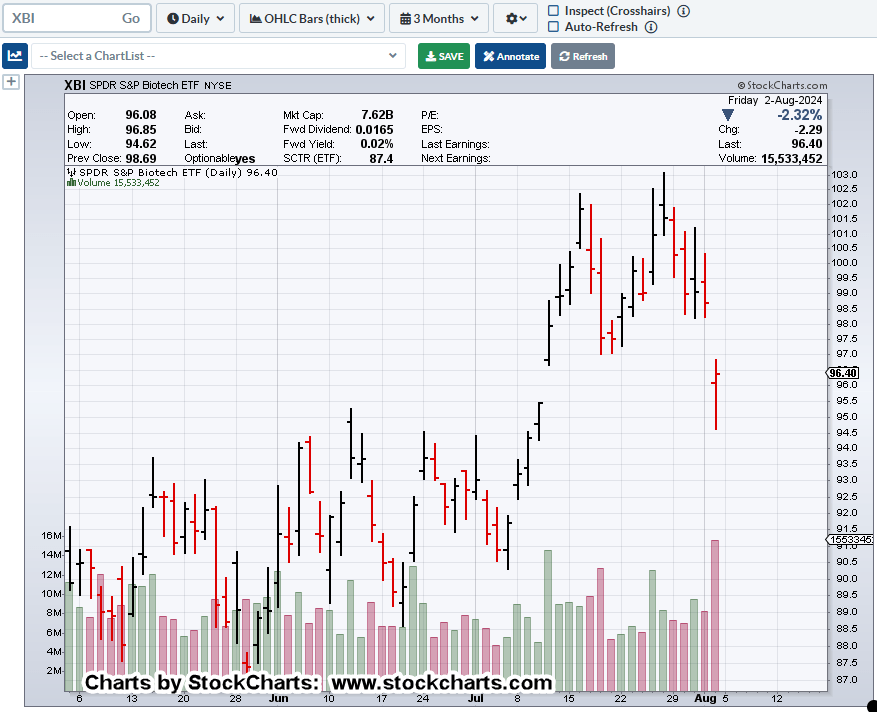
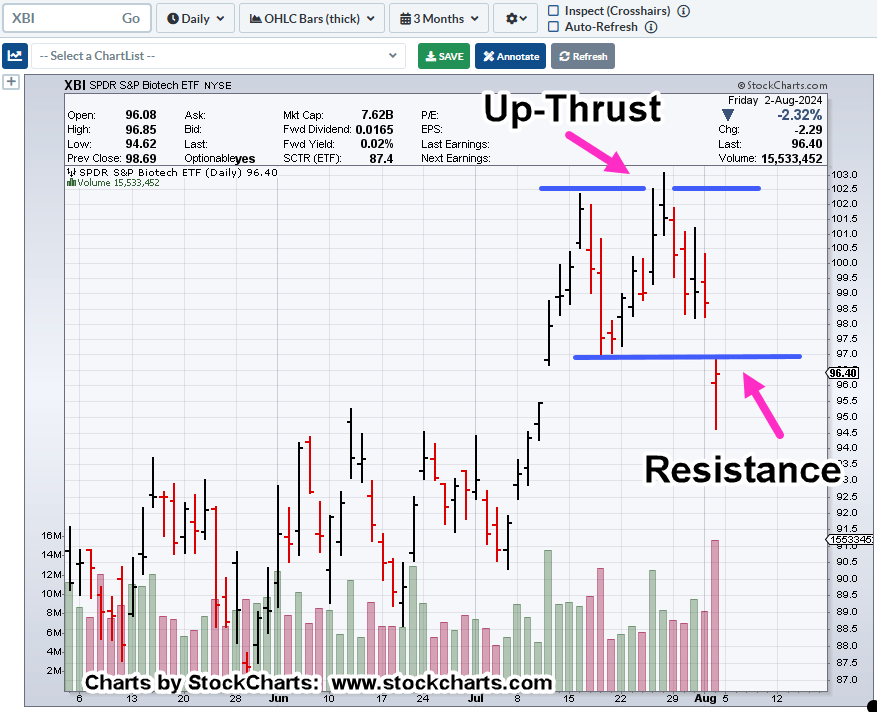
This morning’s action appears to be confirming the up-thrust potential.
Now, we’ll get into why this move may happen quickly.
Multiple Timeframes
If the premise is correct, that we’ve gone through a month-long test of the weekly (timeframe) up-thrust, testing may now be complete.
Naturally, the power behind a weekly move, has more substantial effect than daily.
Next, the topic at hand; Prechter’s ‘Rule of alternation’.
Biotech XBI, Daily
The first chart shows detail on the last up-thrust.
Price action penetrated resistance, then posted five-days of congestion before breaking lower.
We’re labeling that congestion action as ‘complex’.
Next, we have the current situation. An apparent up-thrust in its initial stages.
If what we have now, is indeed an up-thrust, taking all the prior considerations into account, it’s reasonable to expect the subsequent move will be less complex, having different form, and move more quickly (not advice, not a recommendation).
In any case, we have a ‘hard stop’ for a short position, at the session high (not advice, not a recommendation).
Our Quest, Is At An End
Like something out of Monty Python, the entire analysis of downside potential feels like the quest is at an end.
However, just like the video snippet in the link above, what looks to be a dramatic conclusion to weeks if not months of work, could be completely derailed by a bunch of ‘French’ guys hanging out in a British castle 🙂
Note: Posts on this site are for education purposes only. They provide one firm’s insight on the markets. Not investment advice. See additional disclaimer here.