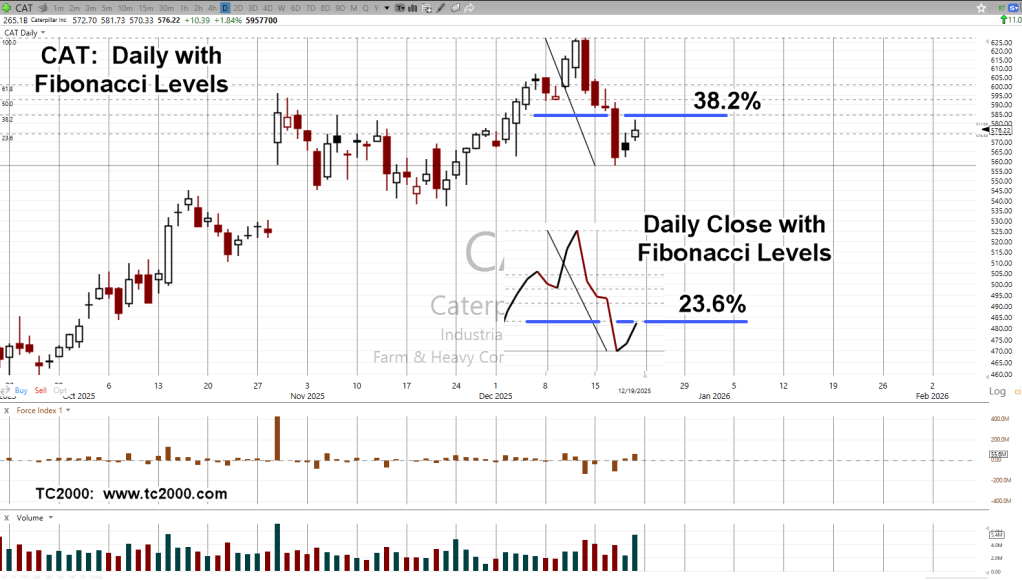
As the tagline says, we had two Fibonacci levels posted by CAT on Friday.
The chart shows a print low on the 17th, to Friday’s high, was 38.2% retrace of the move from all-time highs.
The insert shows the close version of the same chart. On a close basis, CAT retraced 23.6%.
Caterpillar CAT, Daily
Note the action of the past two trading days were ‘inside’ the down bar posted on the 17th.
With the trend break from the prior update, then posting a retrace of two Fibonacci levels simultaneously, plus the large high-volume bar (on the 17th), suggests the upside test may be complete (not advice, not a recommendation).
The week ended with multiple records set, link here.
Note: Posts on this site are for education purposes only. They provide one firm’s insight on the markets. Not investment advice. See additional disclaimer here.
Note: Posts on this site are for education purposes only. They provide one firm’s insight on the markets. Not investment advice. See additional disclaimer here.
Note: Posts on this site are for education purposes only. They provide one firm’s insight on the markets. Not investment advice. See additional disclaimer here.
Note: Posts on this site are for education purposes only. They provide one firm’s insight on the markets. Not investment advice. See additional disclaimer here.
Evidently, according to this out on ZeroHedge, stocks will be a good buy when the Fed pivots; apparently getting back to 2%, inflation.
So many lies, half-truths and pre-suppositions, all in one sentence. Let us count the ways.
Actually, let’s not.
At this point in time, one does not want to draw any undue attention.
A better idea is to see what the market’s saying about itself. This is the crux of Wycoff analysis.
Wyckoff stated a century ago (1902, to be exact), stock prices moved based on an energy of their own; at times, completely disconnected from fundamentals.
Looking at those markets and from my own tracking spreadsheet, 106, indices or equities are currently monitored.
That list will change over time but it’s typically around 100 or more ticker-symbols.
Of that number, the following are those currently in a downward sloping trading channel.
Note: Posts on this site are for education purposes only. They provide one firm’s insight on the markets. Not investment advice. See additional disclaimer here.
The narrative and the price don’t agree; at least at this point.
Over and again, we hear it’s ‘dollar destruction’ and ‘hyperinflation’.
Here is a link to one of the latest pontifications on what ‘inflation’ is doing or is going to do.
After watching that, one is so much better informed. Well, at least we know what the bit-players are saying … each reading from their own (pre-approved) script.
Let’s get back to reality and the price action at hand.
We’ll start with this quote from the last update which references shorting the gold miners using JDST (not advice, not a recommendation).
“However, something that can be done is to use that upward bias to position short at the lowest risk possible.”
That’s exactly what was done during this (past) session; let’s start first with the big picture.
Junior Miners GDXJ, Weekly
As a reminder, and for those who may be new, we’re looking for a particular price pattern that has been shown to repeat over time:
Note: Posts on this site are for education purposes only. They provide one firm’s insight on the markets. Not investment advice. See additional disclaimer here.
Years ago, while reading one of David Weis’ daily updates, he made a comment to the effect:
‘I can’t count how many times I’ve seen a spring, go straight into an up-thrust’.
His observation stuck with me through the years. Being the engineering type, I naturally wanted to know why.
Why does that market observed phenomenon occur?
Pursuing the question from a data perspective, it became clear that finding an answer, would be a never-ending quest.
I abandoned the ‘data’ idea; but the question lingered.
During that time, observation of the markets proved Weis’ point. Some markets tend to go straight from ‘spring to up-thrust.’
One example that’s taking place now, is CAT:
Another example in the potential set-up phase is LOW:
The reason for the phenomenon remains open. Obviously, the market’s going to go where there are orders.
It’s likely, under the right price action and psychological conditions, when support is penetrated enough (amateur) participants sell and then sell short.
Those undisciplined traders continue to move their stops higher (against their trade) as the the market moves higher; ultimately taking them out at the up-thrust top.
How do I know this? Because that’s exactly what I used to do.
Note: Posts on this site are for education purposes only. They provide one firm’s insight on the markets. Not investment advice. See additional disclaimer here.