Note: Posts on this site are for education purposes only. They provide one firm’s insight on the markets. Not investment advice. See additional disclaimer here.
Note: Posts on this site are for education purposes only. They provide one firm’s insight on the markets. Not investment advice. See additional disclaimer here.
Those who ‘drank the Kool-Aide’ about silver being bolstered to astronomical heights because, you know, ‘solar energy’, must be a little upset by now.
Just like the fabled ‘interest rate cut’, it’s not happening.
Although for interest rates, we’re just shy of two weeks away to find out; meanwhile, since the last report, the bond market has been bid up again, pushing rates down (again), so, we’ll see.
Back to silver.
We have yet another so-called ‘green energy’ company going bankrupt. That’s not so much news, except for this statement from the report (paraphrasing):
‘Solar demand has declined across the entire industry’
Um, it’s called an economic depression (not advice, not a recommendation).
While we’re talking collapse, let’s just throw in the Chat GPT (Artificial Intelligence) collapse as well, link here.
With all of that as the backdrop, let’s see what silver is up to these days.
Silver, SLV ETF, Weekly
A terminating wedge with an MACD crossover.
We’re at the spot with price could go either way. There has been no wedge breakout to the upside, or down.
If we do get an upside breakout, the position of the MACD is set-up for a potential bearish divergence.
Covered many times on this site; the possibility that precious metals could move higher as a result of the miners imploding.
Adding to that idea are the components of tracking SILJ, silver miner EFT. How many of these outfits have an actual P/E?
PAAS does not, HL … no, CDE … no, NEXA … no, GORO … no, and on it goes.
Note: Posts on this site are for education purposes only. They provide one firm’s insight on the markets. Not investment advice. See additional disclaimer here.
“At this juncture, it’s not unreasonable to say bonds (TLT) are at The Danger Point®”
It’s now five trading days later and five successive lower closes on TLT.
Wyckoff analysis provided the edge to surmise, the next probable direction for bonds was down.
Now that rates are back on the upswing, the interesting part (get your popcorn ready) is how, or what, the Fed is going to do at the next meeting … Tick, Tock. 🙂
Long Bond Proxy TLT, Daily
If bonds continue lower, it’s going to get more than a little interesting.
At the minimum, one would have advance warning, rates may not be lowered and/or, if they are, that move could be quickly reversed (not advice, not a recommendation).
Note: Posts on this site are for education purposes only. They provide one firm’s insight on the markets. Not investment advice. See additional disclaimer here.
‘The truth has no defense against the man determined to believe a lie.’
Unknown
It’s been proven many times on this site and by others more notable (i.e. Prechter), the Fed is not a leader.
They are followers; essentially reacting (not responding) to what the bond market is telling them.
Done Deal? … Not Yet
The financial press acts like a rate cut is a done deal.
However, when looking at the chart (i.e., the real leader), long bond proxy TLT, it makes perfect sense the Fed would propose a cut at the September 17 – 18, meeting.
It’s what happens between now and then, that’s important.
For clues as to what that ‘then’ could be, we go to the bond market itself.
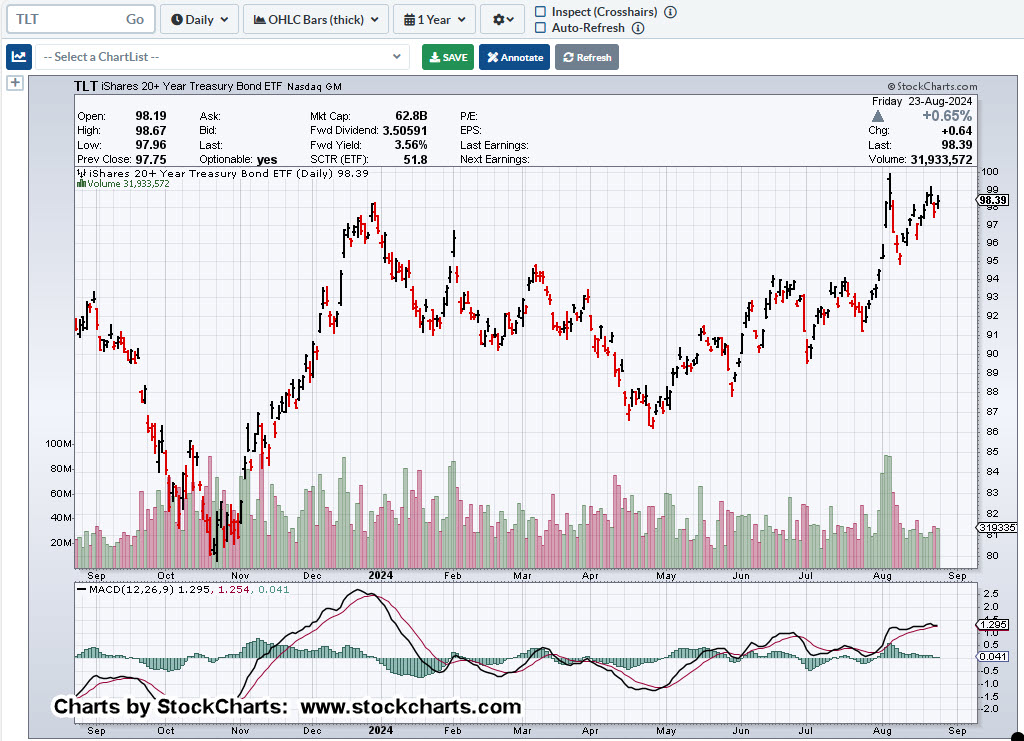
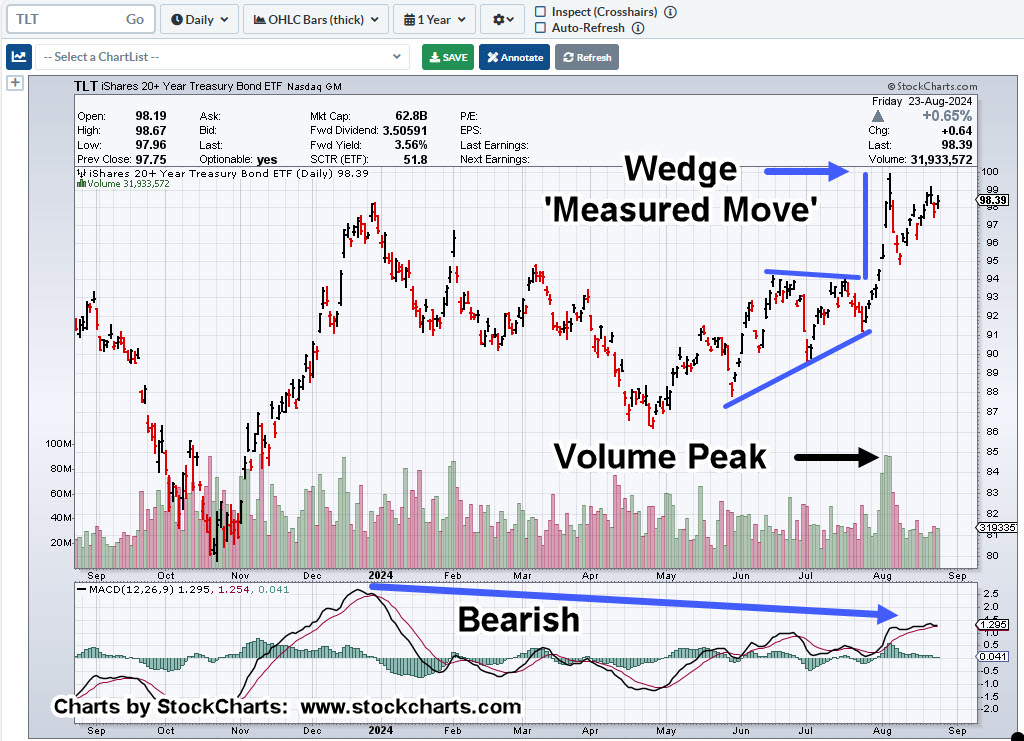
Long Bond Proxy, TLT, Daily
“What do you see?”
There’s a lot going on in this chart; the mark-up (below) is divided into two.
First, is the targeted measured move (that’s been met) out of the wedge formation (not advice, not a recommendation).
Next, we’re also in a Wyckoff Up-Thrust condition which may have been tested on declining volume, this past week (not advice, not a recommendation).
At this juncture, it’s not unreasonable to say bonds (TLT) are at The Danger Point®
It would appear, the weight of a feather could move prices either way.
The interesting part will be what comes next; Sunday overnight Futures open, is about nine-hours away …
Note: Posts on this site are for education purposes only. They provide one firm’s insight on the markets. Not investment advice. See additional disclaimer here.
We’ve gone form “Not Happening” to this morning’s action; ‘maybe it’s happening?’
As was done with Oil & Gas exploration XOP, we’ll now take a look at the oil patch itself and proxy, USO.
Oil tracking Fund, USO, Close
“What do you see?”
Marking up the chart.
We either have the ‘tradable bounce‘, or a potential contact point for the right-side channel line (not advice, not a recommendation).
The Fed announcement is just out, essentially accommodating a rate cut in September.
There was talk of some ‘cooling’ in the market (Ya think?).
With that, demand for oil seems like it would take a hit putting it lightly (not advice, not a recommendation).
Positioning.
The market itself is telling us where to go and what to do.
The important item for the day; what is the market not doing? Specifically, the Semiconductors, SOXX.
The SOXX, has not made a new (daily) high (at least, not yet) after the Fed’s announcement; it can even be seen as the ‘proverbial gut-check’, a la David Weis.
With that, all other positions have been closed save the short in the semiconductors via inverse fund SOXS (not advice, not a recommendation).
Danger Ahead
The ‘rate cut’ has yet to happen and September is a long way away.
It can’t be re-iterated enough how dangerous is this environment; prices stretched via a narrative that’s false (not advice, not a recommendation).
Note: Posts on this site are for education purposes only. They provide one firm’s insight on the markets. Not investment advice. See additional disclaimer here.
Here’s a different take on Wall Street’s ‘outrage‘ over a year’s worth of fake jobs data.
No, the outrage is not about the data being fake, the outrage may be the curtain has been pulled back, allowing the public to see the truth.
That truth, discovered by Wyckoff back in 1902, was price action has no connection to so-called economic numbers.
In fact, he said (paraphrasing):
‘Dynamics were operating on prices that had no relation to any fundamentals.’
If market action really was based on fundamentals, an historic revelation of 818,000 fake jobs, would have sent the indexes into a frenzy, which did not happen.
In fact, nothing happened
Now, we have ‘The Street’ putting the pieces back together (trying to re-hypnotize their clientele) and come up with another fake narrative; surely, the Fed will lower rates this time … honest!
Well, let’s leave the clown show (for now) and get back to some real, reality, the A.I. bubble.
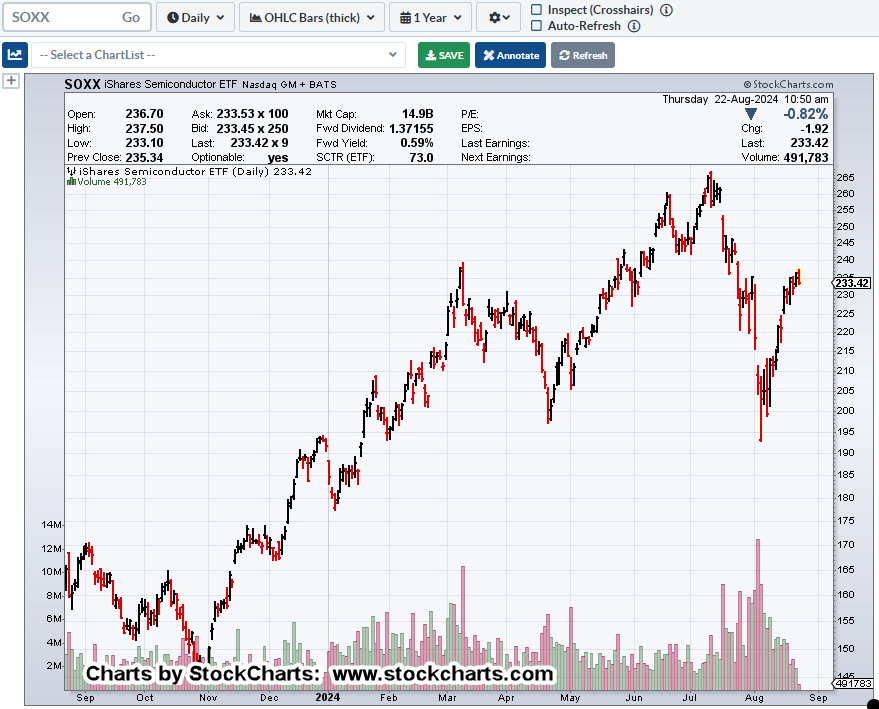
Semiconductors SOXX, Daily
What do you see?
If you’re a long-time visitor (welcome back), by now, your market recognition should be near instant.
That is, we have a Head & Shoulders pattern (not advice, not a recommendation).
Nothing is ever perfect in the markets, but this one is near textbook.
Positioning
Shorting this sector is more than a little dangerous.
Just take a look at the gaps, volatility, huge percentage swings up and down, with leveraged inverse fund SOXS.
With that said, and with the danger in mind, a potential low-risk short (via SOXS) was established early this session.
The trade is labeled, SOXS-24-13, with a stop at the day’s low of SOXS 20.63 (not advice, not a recommendation).
Note: Posts on this site are for education purposes only. They provide one firm’s insight on the markets. Not investment advice. See additional disclaimer here.
The public thinks rates are coming down. It’s the ‘credible threat’ as Uneducated Economist puts it. The Fed ‘threatens’ to lower rates, and it ‘happens’, sort of.
Actually, rates aren’t lower, but the market has distorted itself, as if they were.
So, let’s get past the narratives and go straight to the truth, price action in the bond market.
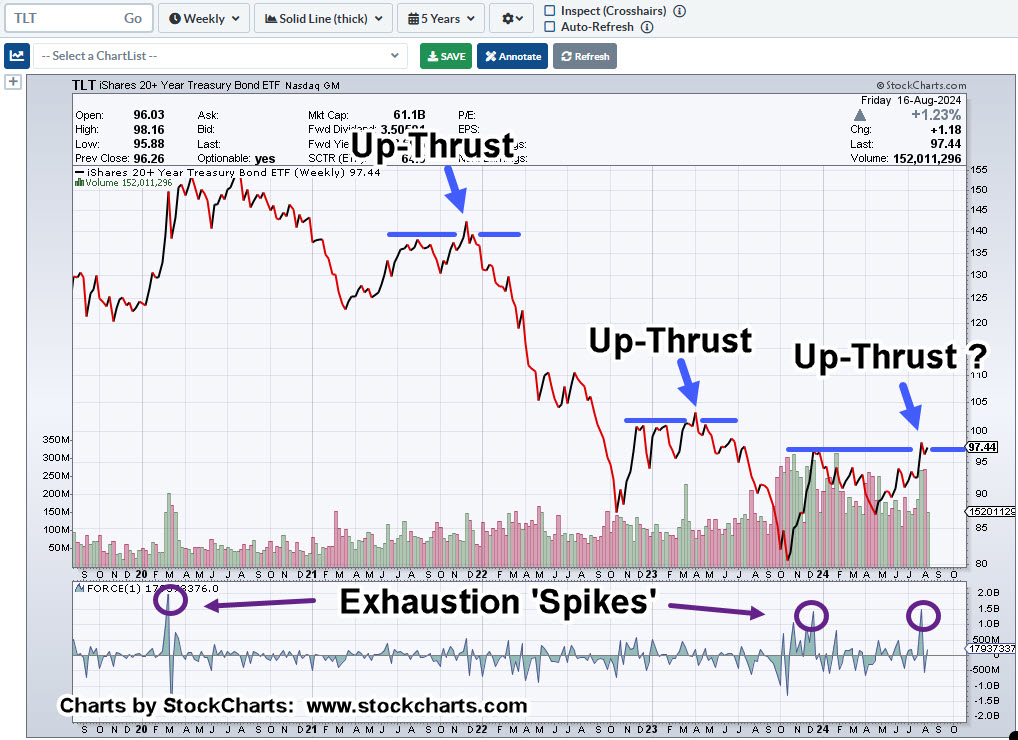
Long Bonds, TLT, Weekly Close
As my mentor Daivd Weis used to say: “What do you see?”
I’ve already marked-up the chart and I see one Wyckoff Up-Thrust, reversal, after another (not advice, not a recommendation).
That, along with exhaustion spikes in Force Index, at or near significant reversals.
The ‘Scary’ Part
Wyckoff analysis is not only price action, it’s volume as well.
Look at the volume in TLT, over the past year.
Massive inflow and what has price done? It’s gone essentially nowhere.
Wyckoff called this ‘Effort vs. Reward’. Lots of effort with little (net) reward.
Add to that, a potential exhaustion spike in Force Index (far right side, purple circle).
Note: Posts on this site are for education purposes only. They provide one firm’s insight on the markets. Not investment advice. See additional disclaimer here.
Insane, delusional valuations, high interest rates, no rate cut.
What could go wrong?
Visitors to this site already knew that ‘something’s up’.
Fully documented well in advance of today, was the A.I. bubble reversal, silver reversal, biotech reversal, and commodities like corn and Nat-Gas continuing their sustained decline.
Now the market hysteria is resulting in the typical knee-jerk, ‘flight to safety’ to the bond market (not advice, not a recommendation).
Surely, with all of that, the Fed will cut rates, right?
For the (potential) answer to that question, let’s look at the bond market.
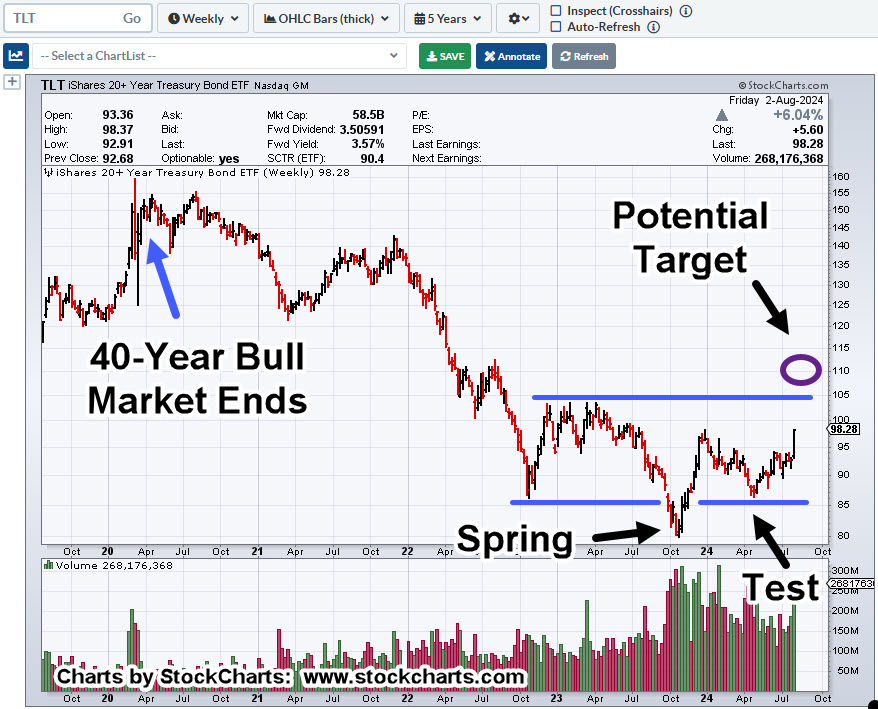
Long Bonds, TLT, Weekly
Already proposed on this site, the Fed does not lead the bond market and interest rates, it follows it (not advice, not a recommendation).
So, what’s this chart telling us?
If the market continues its decline in the coming weeks, TLT price action itself shows a potential for higher bond prices (lower yields).
We’re just over six-weeks away from the next Fed meeting.
Fed Follower?
If the Fed is still a follower, not a leader and if bond (TLT) prices reach the target just as the September meeting is held, then, one would expect a rate cut (not advice, not a recommendation).
Important to note, if TLT gets to the target area, it’s in Wyckoff Up-Thrust (potential reversal) position.
Economic Air-Pocket
If there is a rate cut as a result of the leading action of the bond market and then it reverses to the downside (rates higher), that’s when it would get real interesting.
Correction or crash; we may have to wait until September to find out (not advice, not a recommendation).
Note: Posts on this site are for education purposes only. They provide one firm’s insight on the markets. Not investment advice. See additional disclaimer here.
So, what comes first? The market implodes with bonds (likely) moving higher?
Or … bonds break lower, icing on the cake for rate-hikes, then move higher as the market tanks … Or, behind door Number Three, they both melt down, together.
The least likely event is that nothing happens (not advice, not a recommendation).
Moving on to the chart.
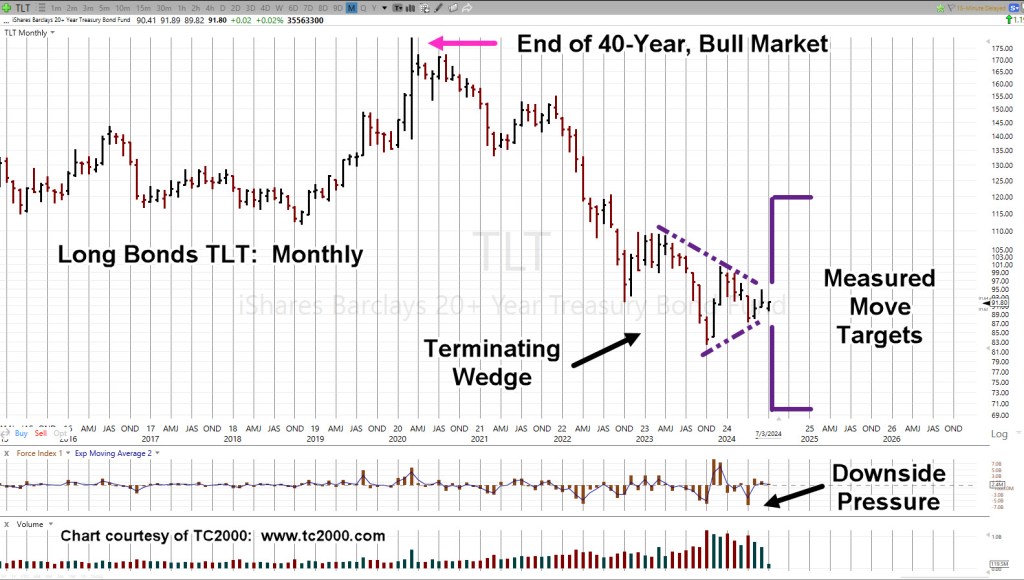
Bonds TLT, Monthly
As shown, the 40-year bond bull market ended during March of 2020.
That was the week of Friday 13th … you can’t make this stuff up (it’s all about the numbers).
One item above, favoring the downside more than up, the last major thrust was ‘downside pressure’.
That thrust has not yet been confirmed with more downside or negated with an upside breakout.
Note: Posts on this site are for education purposes only. They provide one firm’s insight on the markets. Not investment advice. See additional disclaimer here.