Those who’ve been monitoring this site already know, today has been in the planning stages for months.
This post was the first one to discuss the target area for a reversal in gold (GLD).
So, here we are.
So-called inflation is running rampant and it looks as if everybody’s in agreement.
Well, almost.
Turns out there’s a guy in the Pacific Northwest, a ‘boots on the ground’ type that sells lumber for a living.
Uneducated Economist never waivered on the fact, prices are rising as a result of supply constraints and not inflation.
There was one more as well.
Steven Van Metre has given his take on current monetary policies; they’re deflationary.
It’s a minority view.
Either way, we’re about to find out the truth.
Gold (GLD) Analysis
The fact GLD, has reached a target identified two months ago, gives credence to a potential reversal.
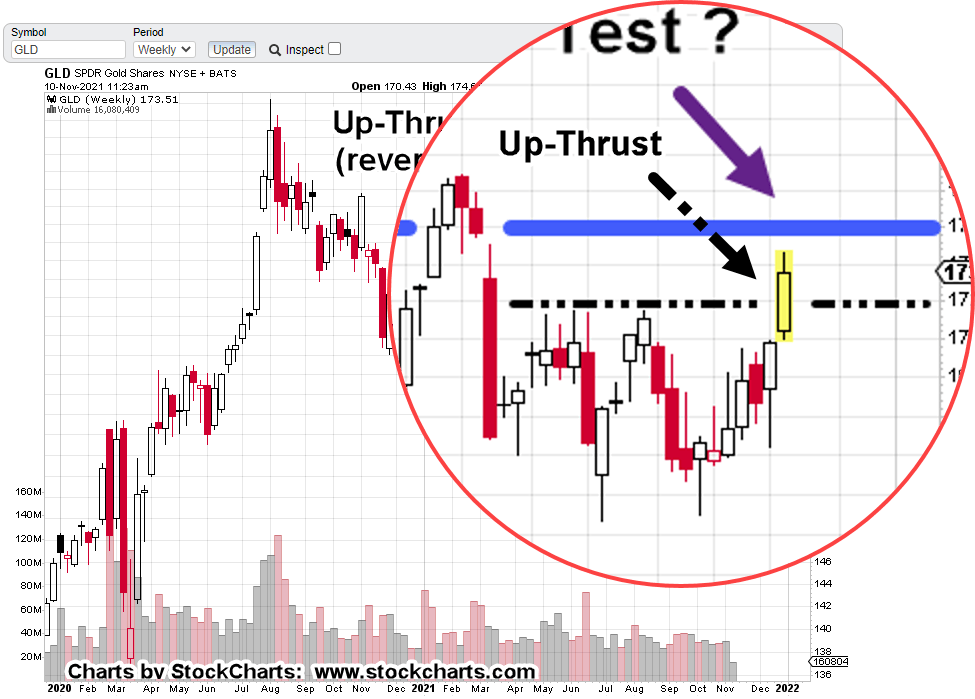
We’ll start first, with the un-marked weekly chart of GLD:
Now, the mark up:
It looks like we have a test of the original Up-Thrust (reversal).
In addition, today’s action (above black dashed- line) is another Up-Thrust.
Is this a reversal, within a reversal ?
The chart below zooms in on that area:
Everyone has their own investment/trading time-frame and method.
There’s no doubt, gold (GLD) is at the danger point. Price action can go either way.
Positioning:
The ‘inflation’ links above highlight current psychology and sentiment. The bull trap may be set.
As of this morning, we’re already positioned short this sector via DUST (not advice, not a recommendation).
Note:
A push below today’s DUST low of 17.27, does not necessarily negate the trade but it does (or will) bring it under scrutiny for potential exit (not advice, not a recommendation).
Note: Posts on this site are for education purposes only. They provide one firm’s insight on the markets. Not investment advice. See additional disclaimer here.
As counter-intuitive as it sounds, for there to be a significant downside reversal in gold (GLD), the vast majority if not nearly all traders, speculators, and investors need to be on the wrong side of the trade.
Getting that crowd positioned without them realizing it, or being plain hypnotized like our asylum escapees, the gold bulls, helps get articles like this accepted by the masses.
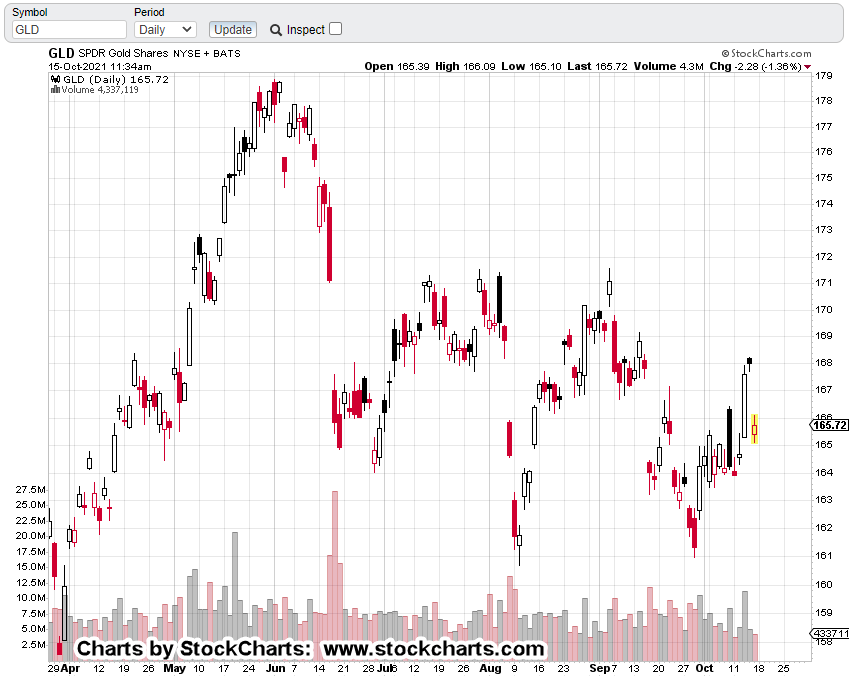
The daily chart of gold proxy GLD, shows the potential target area for reversal.
This area has been a reversal target for months … since mid-September.
Working the markets in this way, that is, identifying a potential future condition for trend change, allows one to think about how it’s all going to go down.
Of course, consistent, incessant, propaganda along with bullish (asylum) hysteria is a must. 🙂
Just to be fair, sometimes and on a rare occasion, the crowd is right.
With that in mind, we’ll have to see how GLD price action behaves if/when it breaks through resistance.
Note: Posts on this site are for education purposes only. They provide one firm’s insight on the markets. Not investment advice. See additional disclaimer here.
The currently held belief is dollar collapse and gold to $3,000/oz.
Dollar (UUP) Analysis:
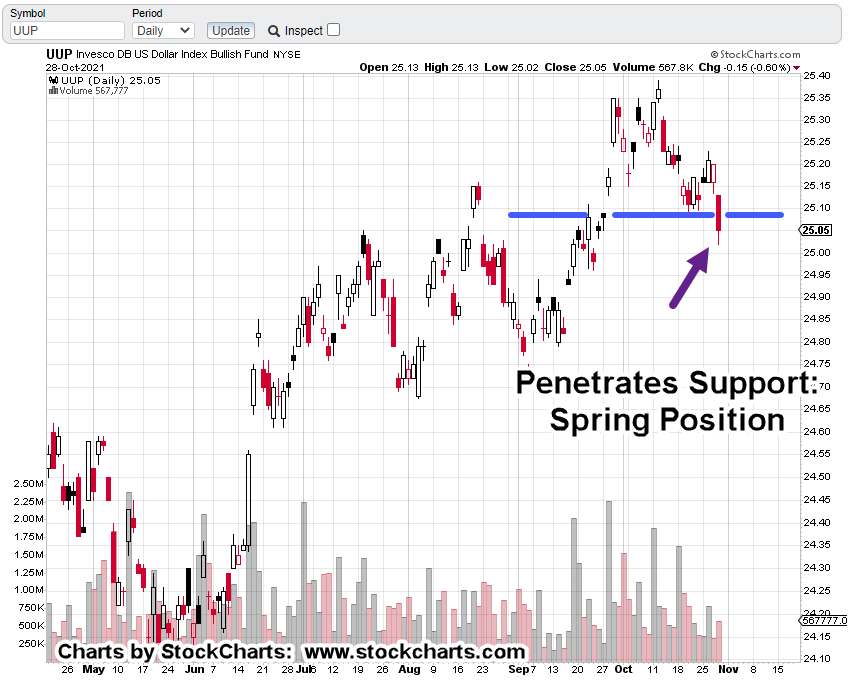
The daily chart of UUP may be painting a different scenario:
The dollar’s already in an up-trend. It just established support at the 23.6%, Fibonacci level. There was a bounce higher and then yesterday, penetration below support.
Now, in the pre-market, UUP is currently trading at 25.14 – 25.16, which is at or even above the support level.
A dollar reversal higher at this point, being a very shallow 23.6% retrace thus far, would potentially spell big trouble for gold and the miners.
Note: Posts on this site are for education purposes only. They provide one firm’s insight on the markets. Not investment advice. See additional disclaimer here.
Note: Posts on this site are for education purposes only. They provide one firm’s insight on the markets. Not investment advice. See additional disclaimer here.
No manufactured (um, sorry ‘supply chain’) crisis would be complete without a fire.
However, there’s a problem with all this hypnotizing the masses to hyperinflation.
That problem is … the dollar’s not playing along.
Dollar, UUP Analysis:
In fact, the dollar is showing significant strength.
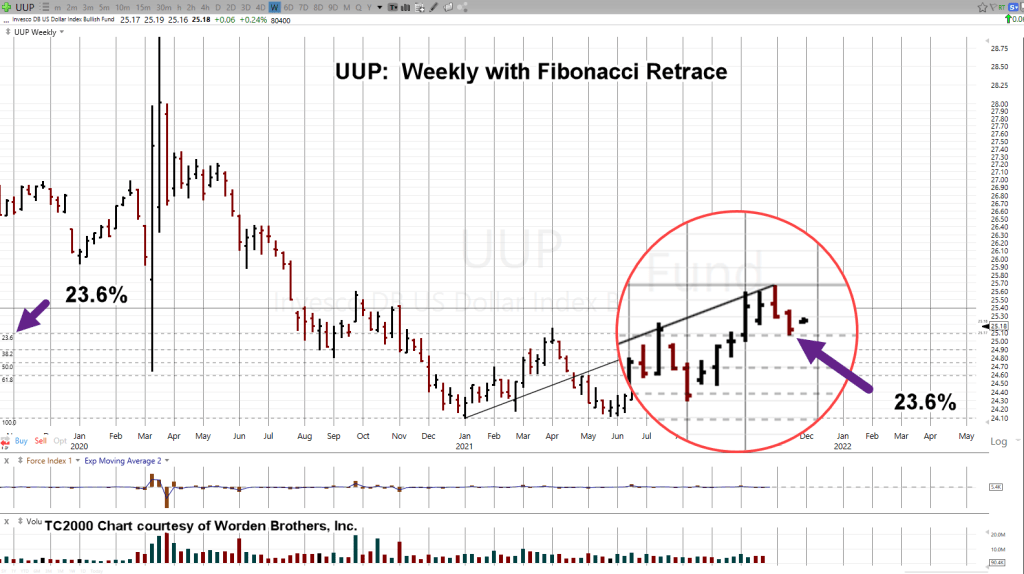
It’s right at Fibonacci 23.6%, retrace (very shallow) and appears ready to move higher.
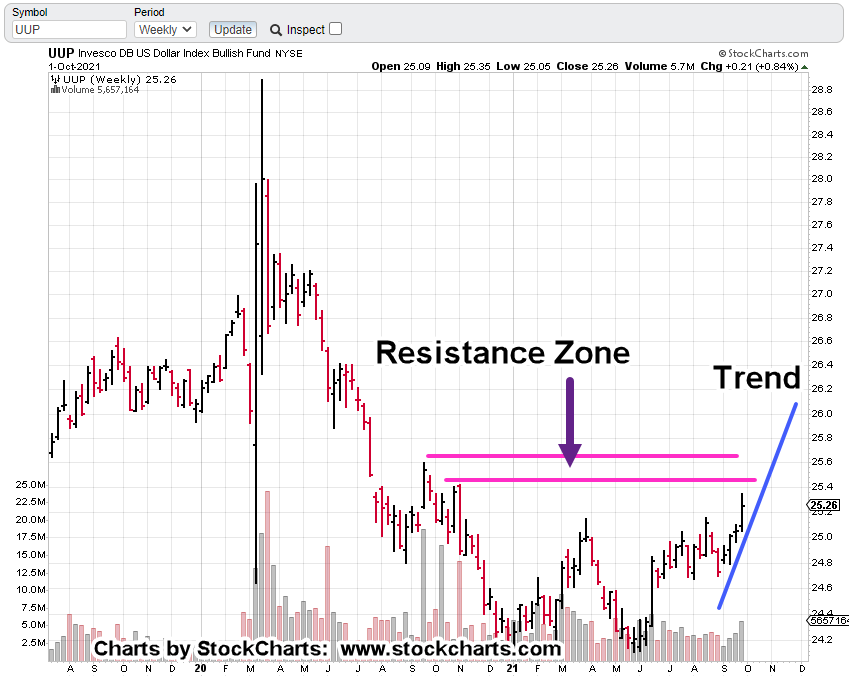
The weekly chart of UUP, is below and includes the Fibonacci levels.
The next chart expands the last few weeks to show contact with the 23.6%, line and what looks like a nascent move up:
If UUP manages to make a new weekly high above last week’s 25.24, level, we have confirmation it’s attempting to continue the reversal and up-trend.
That reversal started way back at the beginning of this year.
This is what was said back then when the dollar looked poised for imminent collapse.
If gold and the dollar are still inversely correlated, the dollar appears ready for an upside breakout; obviously, a breakout higher would then put down pressure on gold.
Gold (GLD) Reversal:
Five weeks ago, the potential for a significant gold (GLD) reversal was discussed at this link.
Then, over the weekend we’ve discovered one other analyst coming up with their own version.
At this juncture, GLD continues to ratchet higher to the 171 – 175 target area.
That move’s happening along with the requisite press generated hysteria … helping lead the bulls to a potential last stand.
Stay Tuned
Note: Posts on this site are for education purposes only. They provide one firm’s insight on the markets. Not investment advice. See additional disclaimer here.
It’s your host’s engineering background that causes him to go looking for supporting data (or lack of) when presenting a contrary opinion or analysis.
Usually, that means sifting through randomly selected research or YouTube links on the subject; just to make sure the idea’s not being discussed by someone else.
This round’s sample of links is provided for reference below.
The proper sequence is: Sentiment, Volume, then Price. 🙂
The Potential Gold (GLD) Set-Up:
We’re calling the ‘coup d’état’, for lack of a better description.
The bullish hype is so bad and the me-too-ism on YouTube is so disgusting; being devoid of original thought (i.e., it’s a set-up), one has to be prepared for the opposite.
If GLD, manages to move higher to the 172 -175, area, it could be the final thrust before a wrenching sharp, or sustained decline.
The last time gold was discussed in detail was this post.
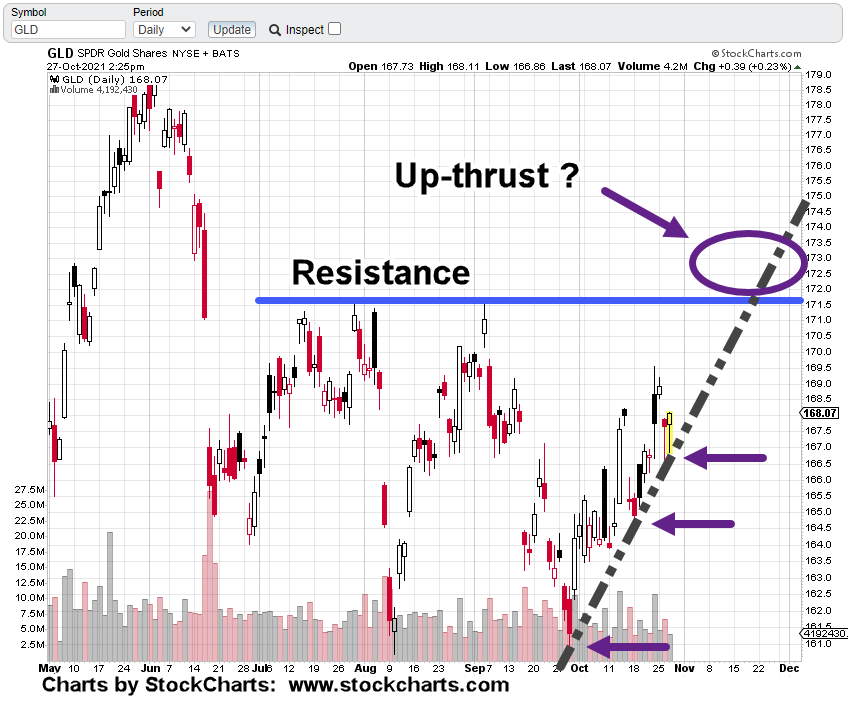
Gold (GLD) Analysis:
Daily chart (mid-session) of GLD, with the set-up target is below:
These charts are an example of what strategy is all about.
Price action after that post, seemed to negate the possibility and so the idea was tabled.
Now, with the GLD reversal off the lows in late September, we’re back on.
Stay Tuned
Note: Posts on this site are for education purposes only. They provide one firm’s insight on the markets. Not investment advice. See additional disclaimer here.
First, this morning’s action in gold (GLD) tells us, it’s not a bull market.
The asylum escapees (gold bulls) from yesterday, might paint today’s action as a buying opportunity.
Well, it could be a buying opportunity for short term trades (not advice, not a recommendation) but that’s not what this site is about.
Bull markets do not let you get aboard comfortably.
Case in point:
For those old enough to remember, harken back to the bull market launch of 1995.
Remember that?
It seemed like every day was up into new highs with nary a retracement until a year and a half later.
No, there’s something else going on with gold.
It may indeed continue to move lower from here. However, there’s a price action feel that’s not right.
GLD:
Potential Coup D’état Set-Up ?
Those who own the gold market(s) know full well, there’s a bunch of rabid ‘collapse’ types who believe the metal’s their salvation ticket out of events to come.
Those in control, need to get as many as possible on the wrong side of the trade before there can be a sustained long-term (or fast and sharp) down move.
Such a move, if it goes low enough and fast enough, would likely take out the majority of the ‘stacking’ community.
Looking at the un-marked chart of gold (GLD), just where would that location be … where everyone, except the few, are positioned incorrectly?
As discussed previously, the area shown below would be a good location for an up-thrust (reversal) condition.
In addition, that location’s between the 38% and 50%, retrace level(s) from August 2020, to March 2021.
One can speculate on just what would cause or enable a last-gasp push higher above the GLD 171, level.
Well, for starters, how about a massive volcanic eruption that results in long-term destruction on both sides of the Atlantic.
As Dan (I Allegedly) says with his post just out, ‘the economy is in a perfect storm’.
Note: Posts on this site are for education purposes only. They provide one firm’s insight on the markets. Not investment advice. See additional disclaimer here.
As is typical for this site, we’ll let the bulls duke it out with the bears. We’ll wait and see if we’re at a reversal point (trend-line) or if we’re headed to up-thrust condition.
If GLD breaks the trend-line, getting back to the 170 – 171, level (up-thrust), imagine the hysteria. 🙂
Lastly, Biotech (LABD):
First: Did we exit LABD?
Answer is No (not advice, not a recommendation)
Second: Why?
The price action thrusts below support that have been reported in prior posts were indeed spring set-ups.
However, it’s obvious now, they were not THE set-up.
The chart shows LABD has met an ‘a-b-c’ measured move target.
The idealized form of an ‘a-b-c’ corrective move, is shown with the blue lines and notations:
At this juncture, wave ‘a’ net distance traveled, is equal to ‘c’ and wave ‘b’ net distance, is about 50% the length of wave ‘a’.
These measurements are typical for ‘a-b-c’.
Positioning:
My firm’s main position is still showing a good profit and we’re going to maintain short biotech via LABD (not advice, not a recommendation).
However, as with GDX being at the danger point before its rally, so too is biotech at the danger point (prior to a potential decline).
Expectations are for LABD to retrace higher from current levels.
Note: Posts on this site are for education purposes only. They provide one firm’s insight on the markets. Not investment advice. See additional disclaimer here.
Just like the biotech sector intentionally euthanizing (a polite word for what’s really happening) its customer base, here we have another entity calling out its own followers as the problem.
It’s similar to the rabid, mindless, one-way (only goes up) gold bulls crying ‘it’s all rigged’, when their pathetic attempts at analysis don’t work out; we now have another entity citing YOU as the problem when the forecasts fall flat.
This is yet another so-called financial source that can be permanently crossed off the watch list.
Brutal, But Beneficial:
Admittedly, the ‘tone’ of the posts on this site are not for everyone.
Even mild-mannered Dan at I Allegedly, finds himself responding to snowflakes that complain about his ‘get ready’ posts.
There’s good reason why the average are so ignorant.
For those who were actually listening in middle-school, the history books conveniently leave out the part where millions of Americans died of starvation during the Great Depression.
No pictures of emaciated bodies. Nothing.
With what’s coming, we’re likely headed for mass casualties in one form or another. The financial community refuses (from what I’ve seen) to discuss this up-coming event.
For example:
If you’re still using a ‘financial advisor’ and they’re not talking about, or don’t know about the elephant, do you really want to be (paying for and) taking direction from someone who’s that lazy, fearful, or ignorant?
Prechter, said it himself when he stated, the next mega bear market’s going to wipe out the ‘wealth management’ industry.
We may be on the cusp of that now.
Not Advice:
With that said, this site does not, and will not give financial advice.
Each person has his (her) own situation in life. You are the one to decide on your next direction or action.
What this site does do, is attempt to provide analysis and supporting price action data on what’s really going on.
What’s the market saying about itself?
If you’re still reading, that was a very long intro to get to our topic for the day: Gold miners, GDX.
Wyckoff Analysis: Senior Miners, GDX
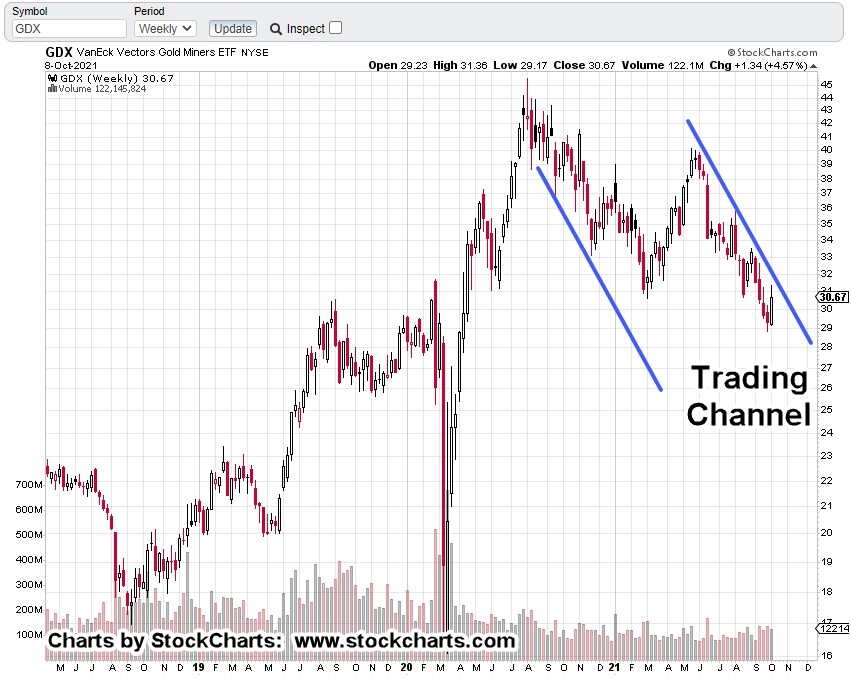
What we see from the weekly chart is straightforward.
GDX, has been channeling lower for about a year:
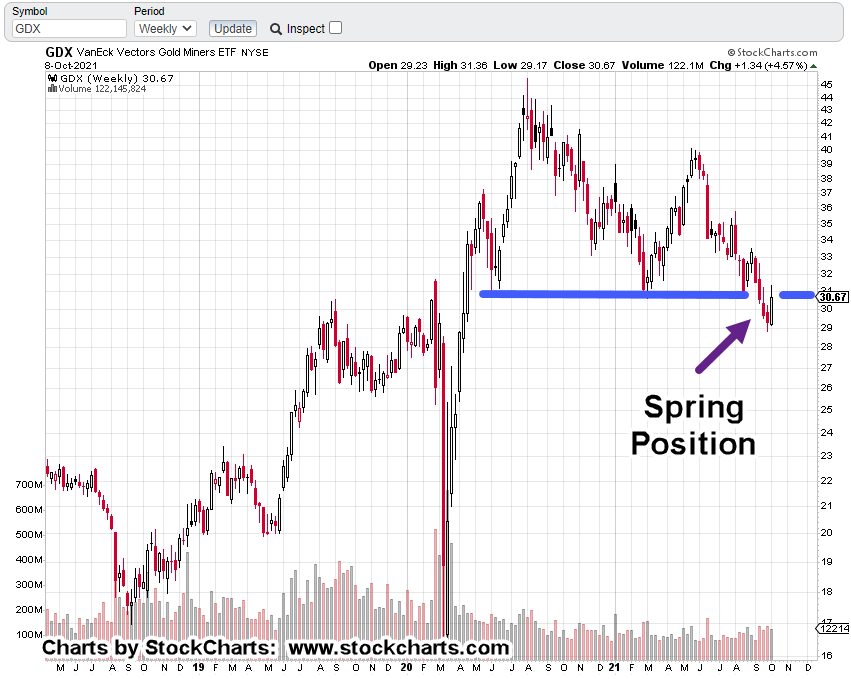
The next chart shows we’ve penetrated support and are now testing the underside.
Of note: GDX is in ‘spring’ position. An upward attempt is to be expected.
If GDX was to break out and start a sustained bull move, this would be the spot. We’re at the danger point.
In my view, the participants in this sector are borderline delusional, if not completely insane.
They disregard what the market’s actually doing; holding to a (so far, for years now) unverified belief that ‘$10,000/oz gold, is just around the corner.’
It could very well be … but only after the (possibly, soon to be) starving stackers have sold off their hoard to buy food.
One has to wrap their mind around the fact, we’re being subjected to a long term diabolical plan.
Thinking and acting with that long game in mind (in my view) provides at least a hope for not only survival, but positioning to prosper during the on-going collapse.
Note: Posts on this site are for education purposes only. They provide one firm’s insight on the markets. Not investment advice. See additional disclaimer here.
It seems that its been going on forever we’ve heard phrases like: ‘dollar destruction’, ‘gold’s going to $10,000,/oz’., ‘rampant inflation’, ‘hyperinflation’ and on.
It takes a very flexible mind (technically termed, “neural plasticity”) to be able to wrap itself around and understand the diabolical agenda being played out before us.
The good news is, Wyckoff analysis cuts through all the lies.
Now past a century old, this technique has stood the test of time.
Note: Posts on this site are for education purposes only. They provide one firm’s insight on the markets. Not investment advice. See additional disclaimer here.