Note: Posts on this site are for education purposes only. They provide one firm’s insight on the markets. Not investment advice. See additional disclaimer here.
From a strategic standpoint, this past Friday was the end of the Quarter and possibly the lowest risk spot to short the semis (not advice, not a recommendation).
‘Low risk’, does not mean, ‘no risk’.
We’ll look at the chart below for the SOXX, but first some housekeeping on the Junior Miners, GDXJ.
As stated in the last update, if there was more GDXJ, upside, shorts (via JDST) would be exited. That’s what happened with an overall gain of + 3.57%, on the series (beginning 6/16/23).
Now, on to the next circus … Artificial Intelligence; more specifically, NVDA and its cohort, the SOXX.
Where’s The Money?
With the quarter over, money managers have dutifully shown they’re like everyone else, ‘investing’ in AI.
That’s out of the way, so let’s move on to the specifics:
Referring back to the excellent investigation done by The Maverick, in his view, the $11 Billion, is “Fantasy”.
The tricky part from a chart standpoint, is to identify when or if that fantasy is going to be exposed.
Semiconductor SOXX, Weekly (Inverted)
We’ve taken the weekly chart of SOXX, and inverted it as if going long the leveraged inverse SOXS (not advice, not a recommendation).
Downside force dissipating with each major thrust.
Last week was an ‘inside week’; price action could not make a new weekly low.
Couple that with end of quarter, potential ‘window dressing’ and this past Friday, may have been the lowest risk point, for shorting via SOXS (not advice, not a recommendation).
Analysis … not Advice
This site cannot and will not give advice.
What it can do, is provide analysis and strategy so that you can make your own determination on the market.
With that said, the ‘heads-up’ for a top in the SOXX, was posted on June 17th, link here.
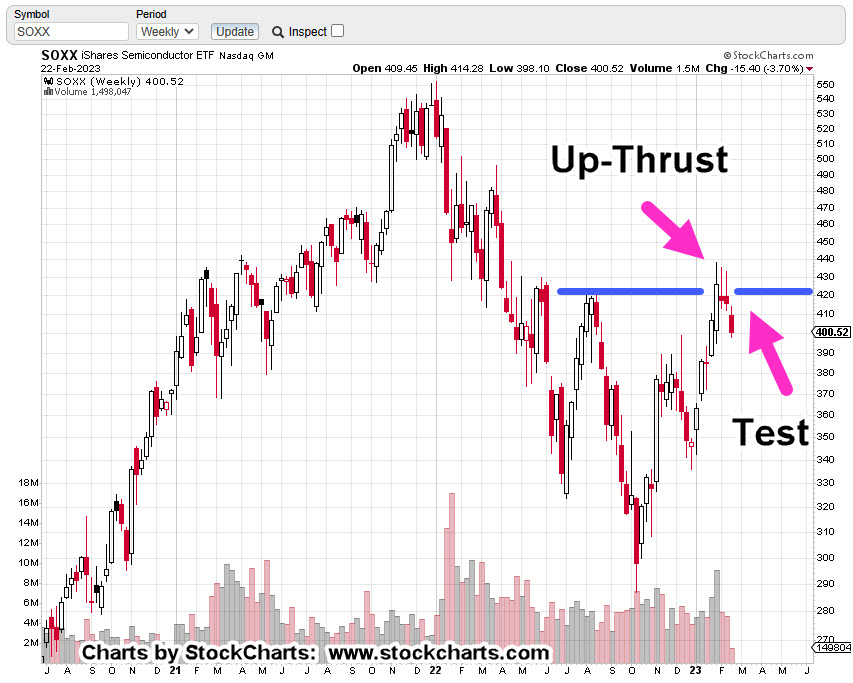
Since that time, the SOXX reversed down and has now come back to test.
Positioning
On Friday, the SOXX, was shorted by entering long the inverse fund SOXS, at 10.01.
Soft stop (trader discretion) for the position is the session low at 9.75, and hard stop (no excuses exit) at all-time low of 9.48 (not advice, not a recommendation).
The coming weeks may prove interesting. All eyes will be on that ‘$11-Billion’.
Note: Posts on this site are for education purposes only. They provide one firm’s insight on the markets. Not investment advice. See additional disclaimer here.
Beginning at time stamp 6:24, at this link, The Maverick goes through an investigation into NVDA, projections.
‘Something doesn’t add up here ….’
That report was three weeks ago. What’s happened, lately?
As of the close this past Friday, NVDA, the largest in the SOXX, was at $1.1-Trillion, market cap. A distant second, is Taiwan Semi (TSM) at $545.5-Bln.
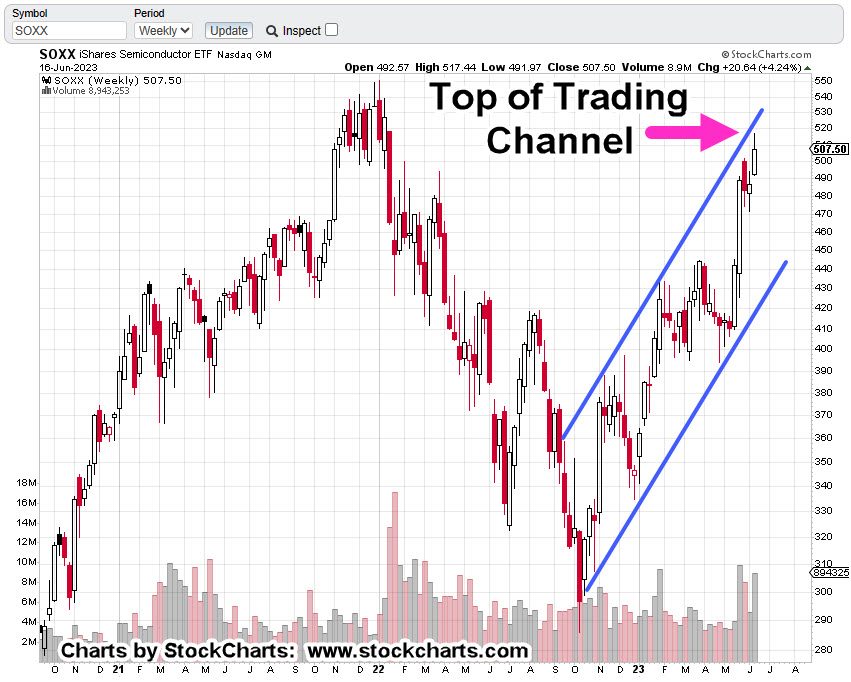
Below, we have a confluence of events for the SOXX.
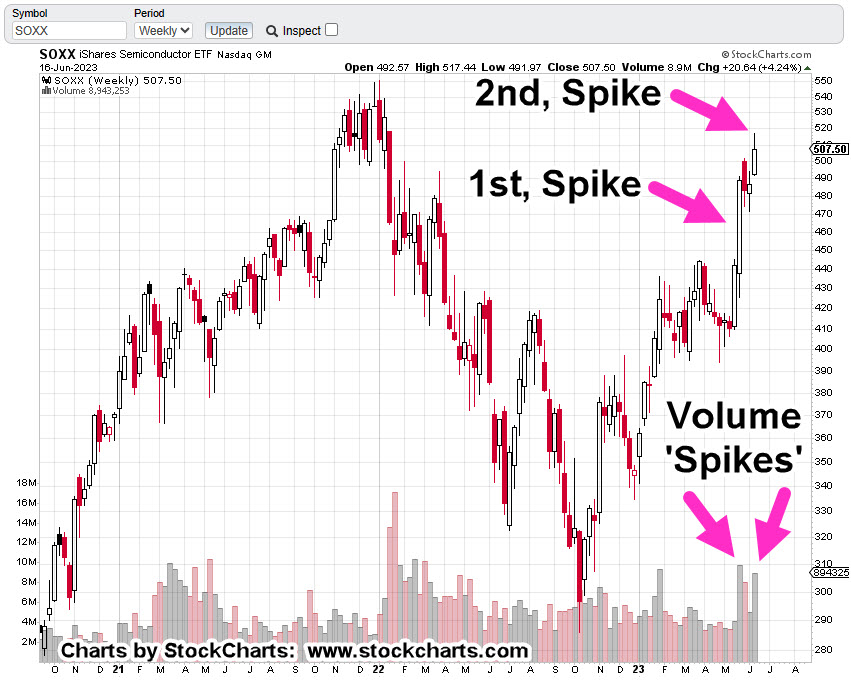
Semiconductor (ETF), SOXX, Weekly Candle
We’re at the top of a trading channel.
We’re in Wyckoff ‘Up-Thrust’ (reversal) position.
A lot of volume expended with less (net) upward progress than previous volume spike; ‘effort vs. reward’.
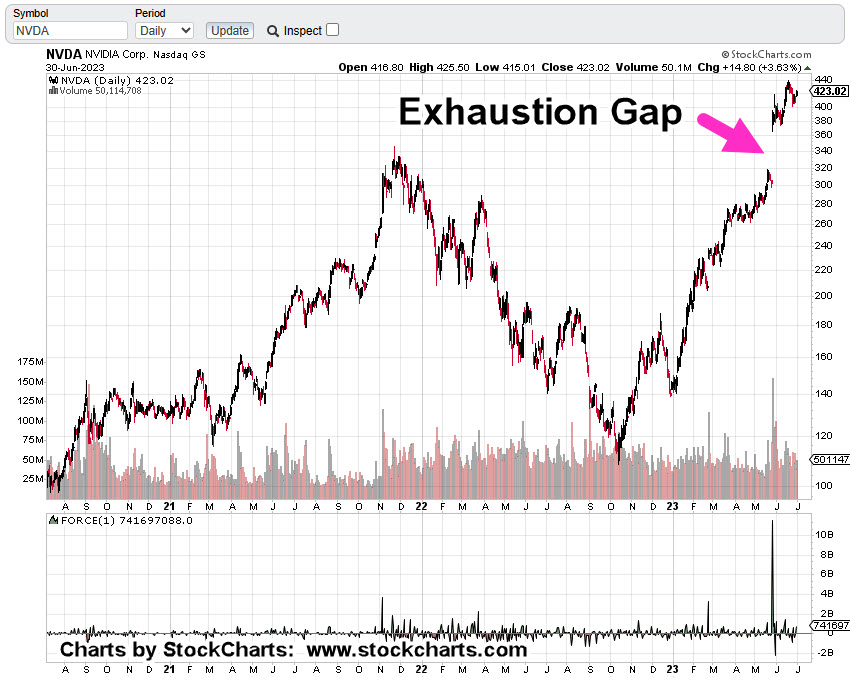
Getting down to the daily, we see a terminating wedge that’s coupled with reduced volume.
Semiconductor Index SOXX, Daily Candle
So, what does that mean?
The ‘probabilities’ for more upside are, or have been, reduced significantly (not advice, not a recommendation).
Note: Posts on this site are for education purposes only. They provide one firm’s insight on the markets. Not investment advice. See additional disclaimer here.
The ‘Artificial Intelligence’ (AI) clown show’s in full swing with a ‘predicted‘ single quarter target of $11-Billion, from NVDA.
That’s not to be confused with the budget clown show just ended in Washinton D.C.
And where does that leave Tesla? They seem to be left out of the latest round of cult-like insanity.
Back in the day, Dr. Alexander Elder stated, professionals don’t look for the ‘challenge’ in the markets (trying to figure out the NVDA, top), they look for the ‘money’ … there’s a huge difference.
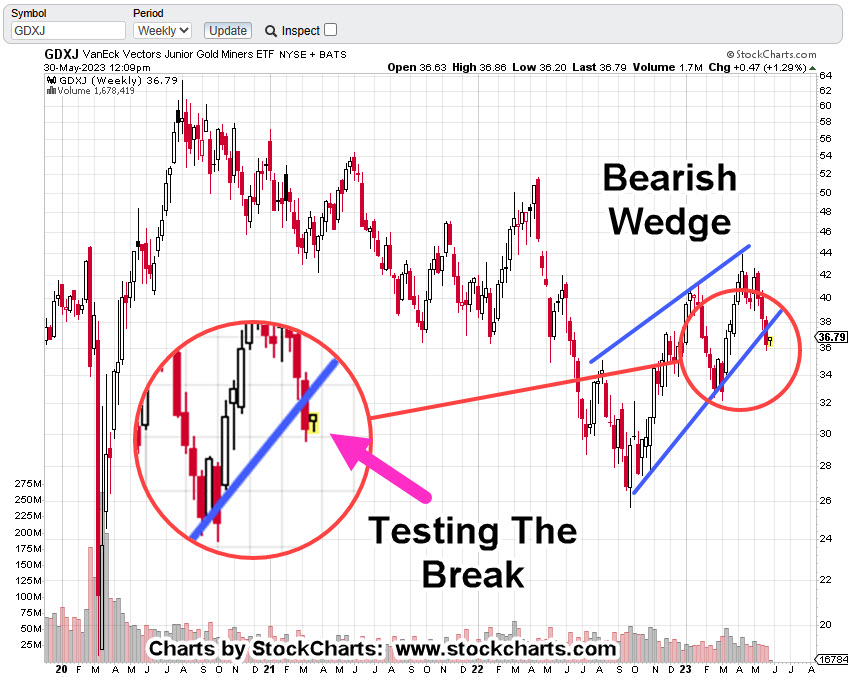
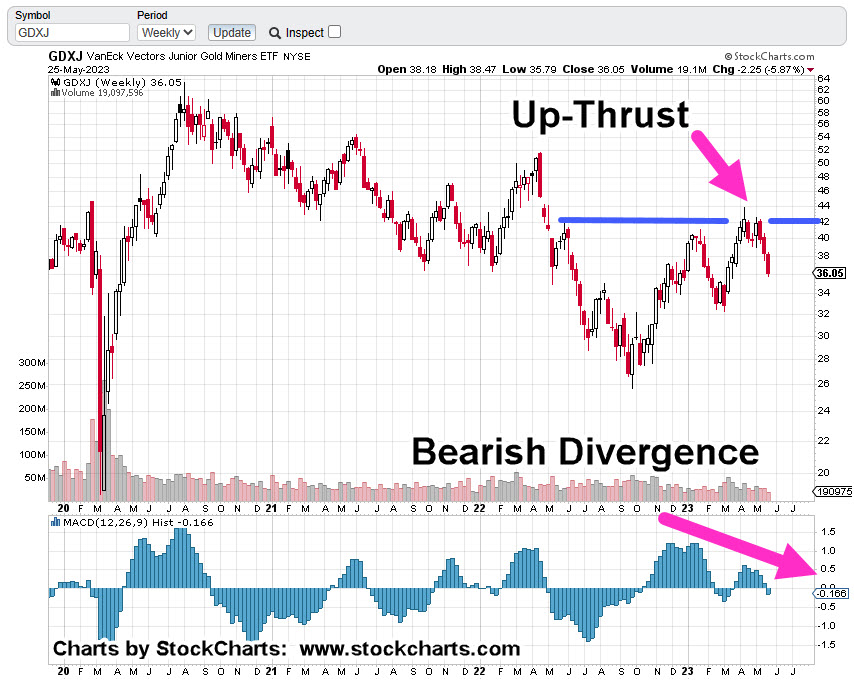
Junior Miners GDXJ, Weekly Candle
As of 12:35 p.m., EST, from a technical perspective, even though we’re up for the day (so far), MACD momentum’s increasing to the downside (magenta arrow).
Nobody seems to be paying attention to gold and silver; all eyes are focused on the next shiny object.
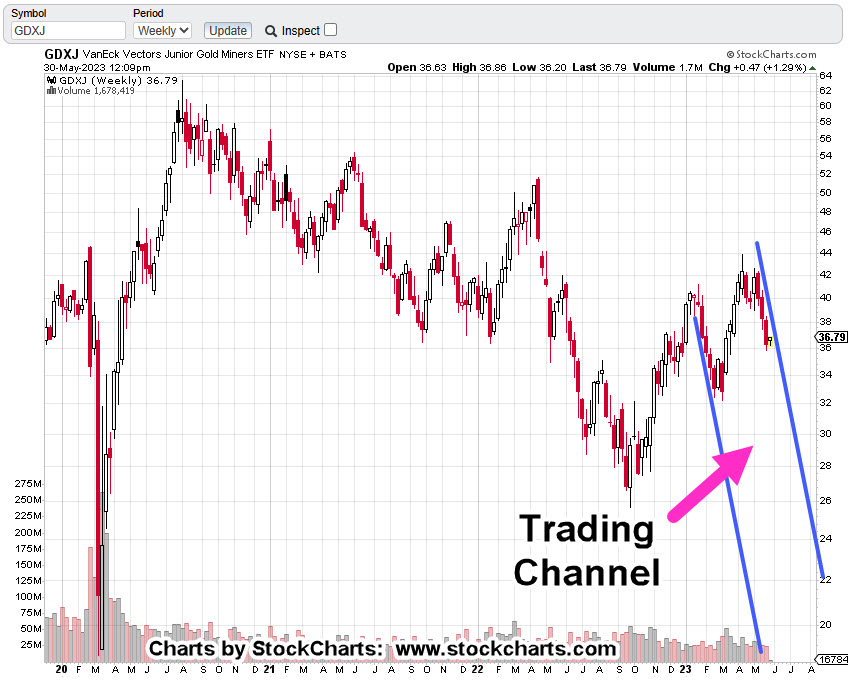
Pulling out a bit farther on the weekly, there’s no question we’re in a channel.
The question is, are we (GDXJ) going to say in that channel or reverse from here?
The last update said we’d likely be testing the wedge break and that’s what’s happening.
A ‘test’ will take however long is needed. It’s either pass or fail. Pass in this case is resumption to the downside.
Technical conditions (MACD, wedge break) favor the downside (not advice, not a recommendation).
In addition, we need to keep in mind there’s a new circus in town; the miners may be well on their way to more downside before anyone steps out of the big-top to notice.
Note: Posts on this site are for education purposes only. They provide one firm’s insight on the markets. Not investment advice. See additional disclaimer here.
Dutch government puts the death knell on their economy … others will likely follow.
While the i-phone crowd is so easily distracted with AI and NVDA being their savior, back at the ranch, economies are being systematically destroyed.
Besides copper, one of the best indicators of robust economic activity is silver (SLV).
Since January, this site has highlighted the potential for a significant, sustained reversal in the precious metals; specifically, gold and silver.
Now, both the charts of GLD, and SLV, have weekly bearish MACD divergences (not shown); having just crossed the zero line with one more trading day to go.
Using a recent weekly bearish divergence as an example, natural gas (UNG), shows us the possibility; UNG is now down – 82%, (at the lows) in just 37-weeks.
Junior Miners GDXJ, Weekly
If gold and silver decline relentlessly from here, the sector most likely to take the biggest hit, is/are the ‘Juniors’, GDXJ.
Once the public figures out en masse, they’ve been fooled into ‘stacking’ instead of securing their food supply, precious metals are likely to accelerate to the downside (not advice, not a recommendation).
Note: Posts on this site are for education purposes only. They provide one firm’s insight on the markets. Not investment advice. See additional disclaimer here.
Note: Posts on this site are for education purposes only. They provide one firm’s insight on the markets. Not investment advice. See additional disclaimer here.
A massive four-year top, along with the latest ‘road-map‘, has this one going down; most likely, for good.
While other chip makers, have gone to near stratospheric levels such as Nvidia, with its 23,960% gain from 2009, lows, Intel has languished.
The rest of the markets, S&P, Dow, QQQs, have pushed on higher while INTC, has spent the last four years, in a trading range.
A sideways market is a bear market.
Intel never recovered its luster after the Dot-Com mania of the 2000s. Price action spent eight years heading sideways-to-down before bottoming out in early 2009.
After that, it’s been a long struggle to current levels.
Now, the markets have reversed and the economy’s collapsing. We’ve likely seen market highs that won’t be repeated in the lifetimes of anyone reading.
Friday’s announcement may be the kick-off for sustained price action to the downside.
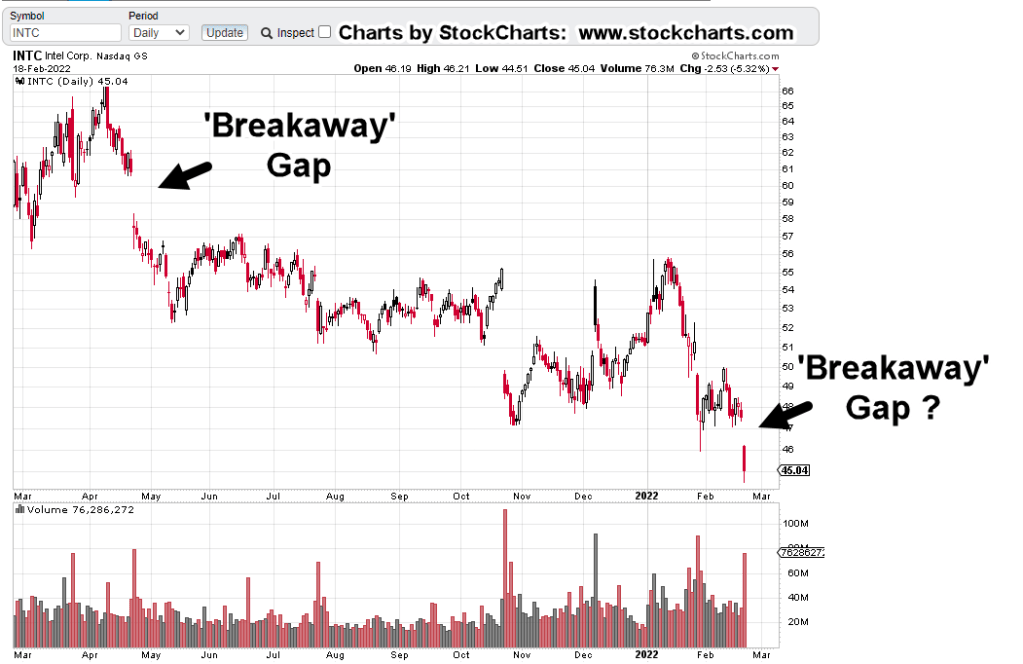
INTC, Chart Analysis
The daily chart shows at least one breakaway gap and possibly two.
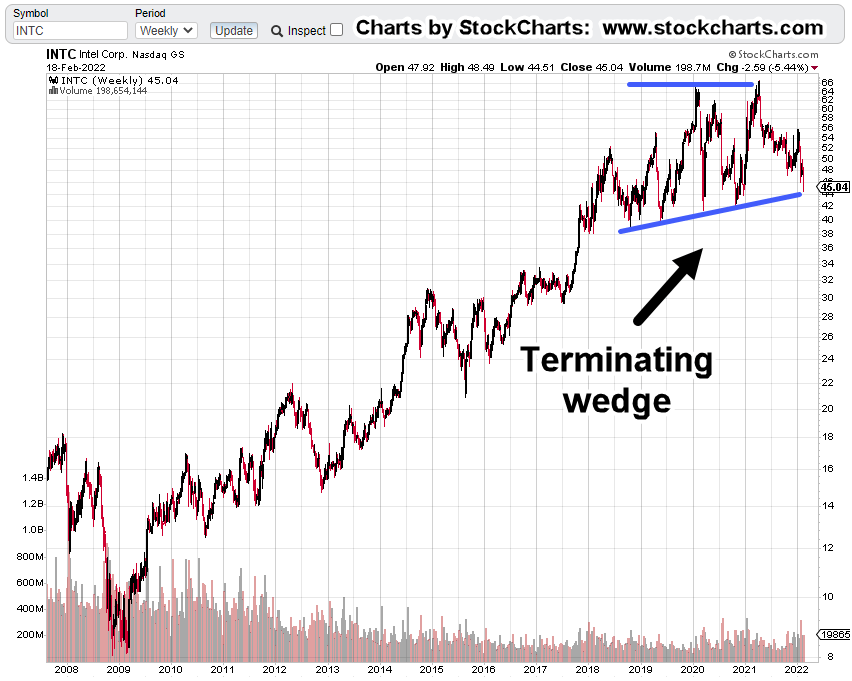
The next chart is on the weekly timeframe and identifies the long, multi-year, topping pattern.
When looking at these patterns, be reminded about the scale of what’s happening.
This wedge is massive … at least four years in the making.
Note: Price action finished the day right at the lower support. There could be a rebound on Tuesday (market’s closed Monday) or we could just keep going lower.
The SOXX Connection
Intel’s fifth in market cap of the SOXX, with Taiwan Semiconductor (TSM) at the top of the list.
Even the leader TSM, may not be immune to trouble.
Here are Fab locations for Taiwan Semi, located just off the coast of mainland China … nothing bad going to happen there, right?
In the case of the ‘wave’ analysis, if it proves correct, we’re possibly in for a sustained ride lower.
The daily chart of SOXX, shows each analysis point where a reversal lower was projected.
It’s clear from the chart and documented links, both methods nailed it … to the day.
Elliott was earliest and caught the exact point of inflection.
Wyckoff caught the test of the up-thrust.
Here’s the important part:
Wyckoff is a practical, bread and butter method. It looks at what the market’s saying about itself … is price action showing pressure to the upside or down?
Elliott Wave looks at where the market could be or is going.
If we’re really in an Elliott Wave Three down, it’s likely to be a decline like no other.
There are other indicators not market related, giving us hints, a massive collapse is ahead.
A Decline of ‘Biblical’ Proportions
Warning:
The following contains scriptural references.
Those who are in ‘it’s all a myth and fairy tales’ crowd, feel free to scroll to the ‘Summary‘.
For the rest of us, the secular world calls it ‘systems collapse’. The spiritual world calls it ‘judgement’.
Stated many times on this site, ‘the church’ is corrupt. Here’s just the latest salvo proving that point.
Along with the corruption, we now have the strong delusions prophesied over 2,000 years ago.
In reference to a Stew Peters broadcast, linked here, on the numerous media lies, is this comment (emphasis added):
“The only people to blame for this Stew are the ones who put on the mask, who distanced, who took the shot, who harassed other people and who advocated for my freedoms being taken away. Without doing five minutes of research.”
It’s not too much of a stretch to say, those who voluntarily injected themselves were (or are) in a place of delusion.
“And for this cause God shall send them strong delusion, that they should believe a lie:”
However, the injections are no lie … but the reasons for those injections are false.
Can this (spiritual assessment) really connect with what’s happening in the markets? How does it relate to actual price action?
Obviously, it can’t and shouldn’t be said that any specific price movement has been prophesied.
However, we can use the scriptural references to point us to the probability of events; the big picture, the situation at hand, the signs of the times.
The probability that we’re at some kind of major inflection point of Biblical proportions, seems exceedingly high.
Summary
Both Elliott Wave and Wyckoff Analysis, support the probability of lower prices ahead for the SOXX.
Because Intel (INTC) has been a laggard in the sector for years, suggests it may be one of the downside leaders.
As if to confirm the assessment we’re past the pivot, that generational highs have been reached, we have this just out, on ZeroHedge.
At the very bottom of the article, is a quote.
No, they’re not quoting from the King James Bible of 1611; they’re quoting from Shakespeare’s Richard III, of 1594.
Note: Posts on this site are for education purposes only. They provide one firm’s insight on the markets. Not investment advice. See additional disclaimer here.