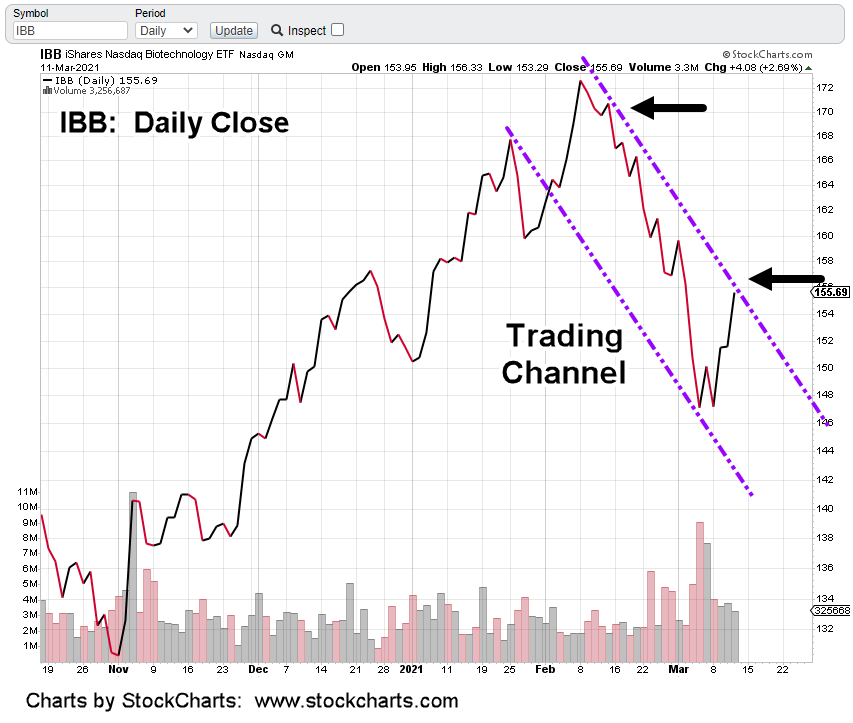
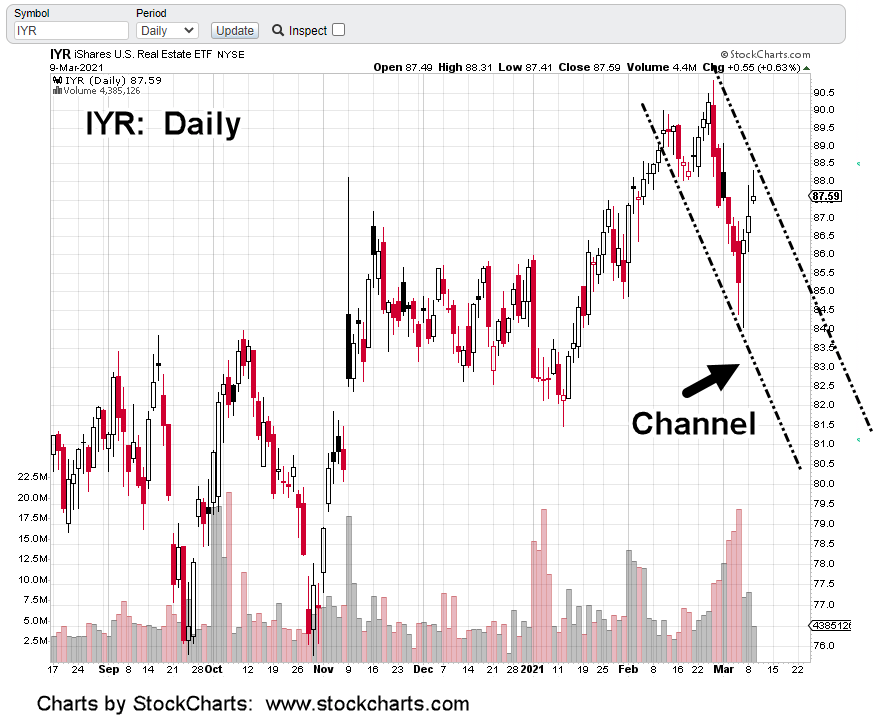
On a closing basis, biotech’s hit three areas of resistance.
We’ll put all the lines up at one time (chart above) and then break it down.
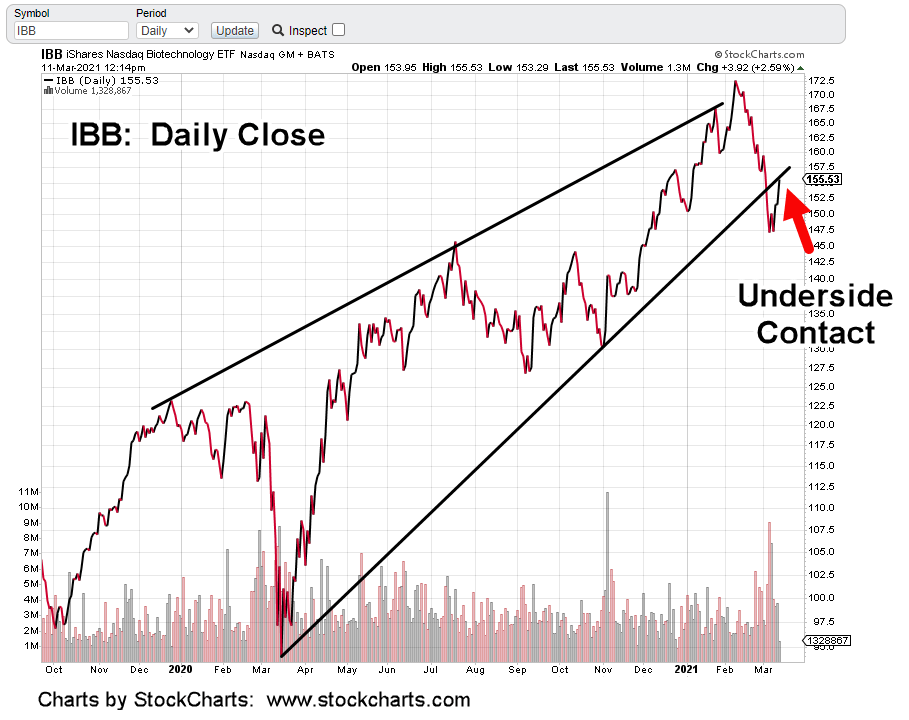
First, there’s the underside of the trend break that’s already been discussed in prior updates.
Second, the resistance formed by the underside of the head and shoulders pattern identified in a prior update as well.
Last, we could have a trading channel in effect. If so, price action contacted and closed at the right side in yesterday’s session.
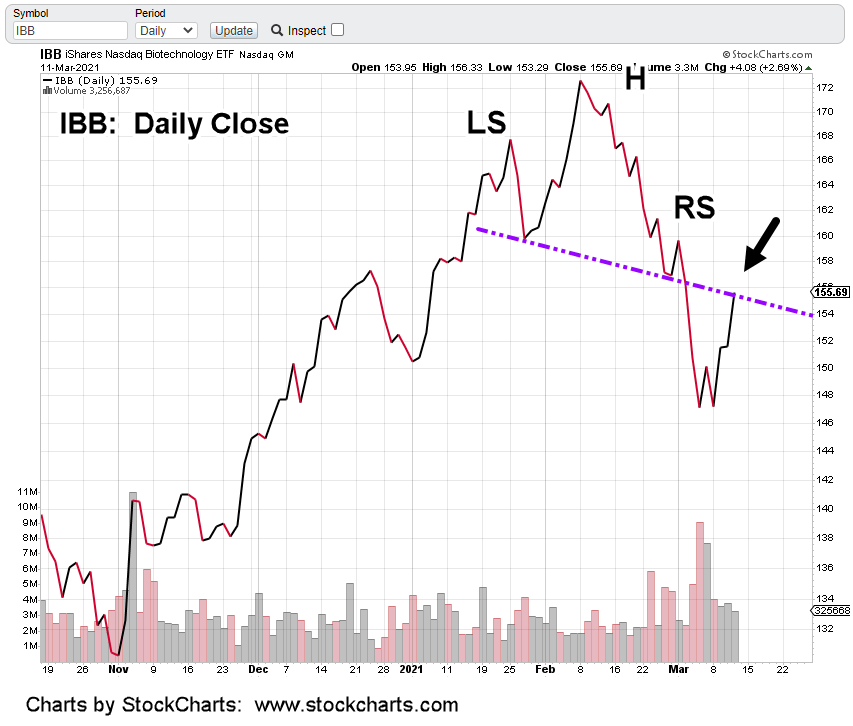
The following charts get a closer look at two resistance areas:
Using a ‘reverse trendline’ technique outlined by Weis in his DVD, we take contact on the left side and move it to the right.
The chart below shows the H&S resistance area (underside) contact:
Putting all lines together gets us the chart at the top of this post.
Long term MACD indicators are down; both monthly and weekly. Momentum is to the downside.
Probabilities favor a reversal
The potential downside is enormous. The markets are extended the most in history. Margin debt the most in history.
We’ve got kids running around with trading apps designed to make it look like a game. It’s no different from the Shoe Shine Boy at the steps of Wall St., giving out tips.
Positioning:
We’re short biotech via LABD (not advice, not a recommendation).
The highly leveraged inverse ETF, performs best when the direction of IBB is down in a steady and decisive move.
Otherwise as we saw near the close yesterday, IBB could be reversing to the downside while LABD is still eroding lower in value.
Inverse fund BIS does much better in this area but is not nearly as liquid. That makes pre and post market trades impossible.
We’ll be looking for IBB to post a new daily low as confirmation a reversal is underway.
Note: Posts on this site are for education purposes only. They provide one firm’s insight on the markets. Not investment advice. See additional disclaimer here.
Note: Posts on this site are for education purposes only. They provide one firm’s insight on the markets. Not investment advice. See additional disclaimer here.
Biotech ETF, IBB looks ready to complete its breakout test and reverse to much lower levels.
There’s a lot going on in this sector.
At this juncture, IBB appears to be the overall downside leader.
The link to this video is the first of its kind. There’ll be more to follow.
Judging from the comments section of ZeroHedge, looks like everyone’s pretty much awake at this point.
Just in case, here are 25-quesitons that can be posed to those still asleep.
Pay special attention to Question No. 11. & No. 12.
At some point you would think it’s all going to bust wide open.
Moving on to the chart:
IBB’s been in a terminating wedge for over a year. There was a ‘throw-over’ in February. Next, was downside penetration of the lower boundary. Now, we’re in a test.
That test can still go higher to contact the boundary underside. However, as posted yesterday, we’re already positioned short (not advice, not a recommendation) at the 38.2%, contact and rejection.
From a fundamental perspective, all the good news is out. Probably the last of any ‘stimulus’ will be figuratively mailed out by the end of the month.
Bonds look to be forming a bottom and the dollar as well.
Even so, the higher interest rates are already having an effect as home buyers are backing off. Lumber prices remain at insane levels.
Positioning:
Last session, the firm’s accounts went short biotech. Pre-market action in LABD shows a slightly lower open (higher for IBB).
The stops for both BIS and LABD have been provided in the last update. Be aware, the stop is loosely based on the tracking fund IBB.
If IBB posts a high above 154.60, its likely to attempt a 50% retrace.
One caveat:
There’s probably an accumulation of short stops (like ours) at the 154.60, high.
If there are enough, the market will automatically go one, or two ticks higher (154.62), to clear them out.
We’ll watch for that and adjust our stops accordingly. If this happens, it’s likely to be within the first 90-minutes of trade.
Note: Posts on this site are for education purposes only. They provide one firm’s insight on the markets. Not investment advice. See additional disclaimer here.
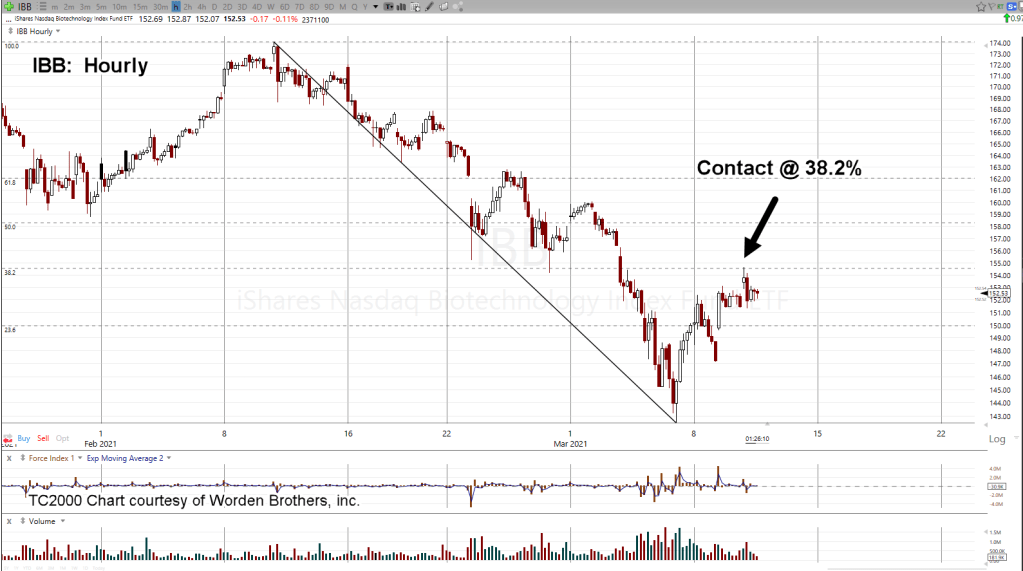
In price action very similar to AMT before its reversal, IBB looks ready to move decisively lower. Early session hit 38.2% retrace and now, test action (higher) looks weak.
Markets are fractal. Price action repeats itself at various time-frames.
Expectation is that IBB will continue lower from here just as was the case with AMT.
The difference is, since we’re dealing with an hourly time frame instead of daily, price action is faster.
All accounts have been cleared of positions except for being short biotech.
Positions are as follows (not advice, not a recommendation):
LABD: Entry, 19.976, Stop 19.52
BIS: Entry 22.32, Stop 21.75
There are a number of problems for biotech hovering the background that could blow the lid off the ‘planned event’ of the past year.
More information to be provided in a subsequent update
Note: Posts on this site are for education purposes only. They provide one firm’s insight on the markets. Not investment advice. See additional disclaimer here.
Note: Posts on this site are for education purposes only. They provide one firm’s insight on the markets. Not investment advice. See additional disclaimer here.
Head & Shoulders patterns are showing up in several markets.
First, there’s biotech IBB … and now the SOXX.
The SOXX is higher in pre-market around +2.5% , +2.70%, near 385.25.
Conversely, inverse SOXS is down -9% to -10% near the 14.00 -area.
Today could be the day where risk is minimized to position short via inverse SOXS (not advice, not a recommendation).
If SOXX remains below yesterday’s high of 397.71, it has set itself up to break the neckline. Once that’s completed, we’d then have a measured move lower to around 320.
If short via SOXS, the stop would theoretically be yesterday’s low of 13.21.
We all know however, inverse funds and especially the 3X versions, have significant negative erosion.
If during the regular session, SOXX price action persists throughout the day near yesterday’s high (397.71), inverse SOXS will continue to erode below its own prior daily low.
A different view is the Right Shoulder has not been completed. We’ll know that if SOXX makes a new daily high.
It’s a myriad of scenarios and the professional understands there’re an infinite number of outcomes. However, at times, risk is reduced enough to take a position on a probable direction.
At this juncture and given the above conditions, the most probable direction is down.
One last caveat.
SOXX has broken below well established support. That puts it in Wyckoff spring position. The market will automatically attempt to rally as we see in the pre-market.
Based on the conditions described, we’re expecting that spring attempt (to new all time highs) to fail.
Note: Posts on this site are for education purposes only. They provide one firm’s insight on the markets. Not investment advice. See additional disclaimer here.
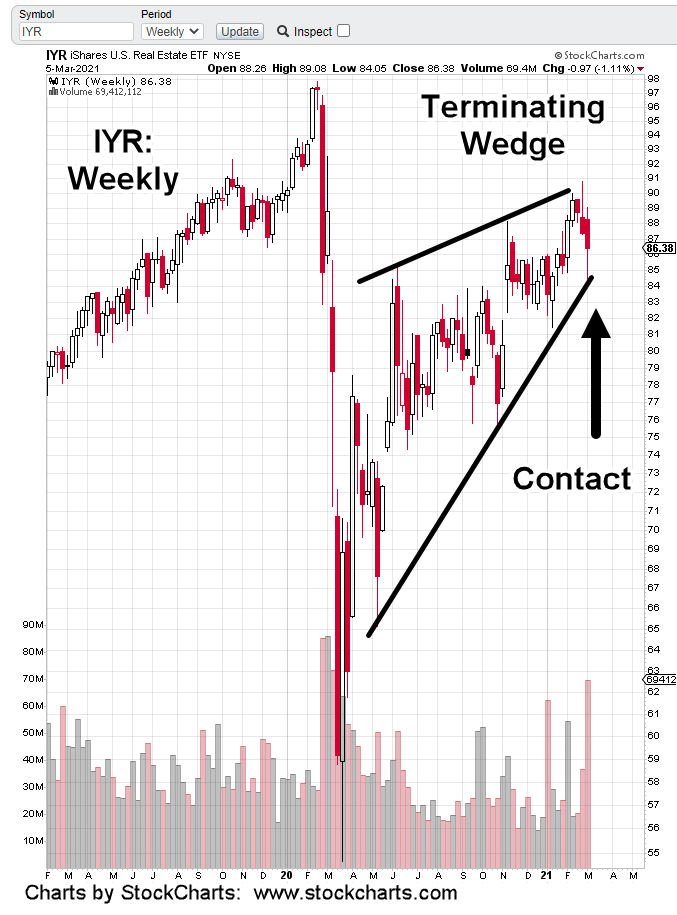
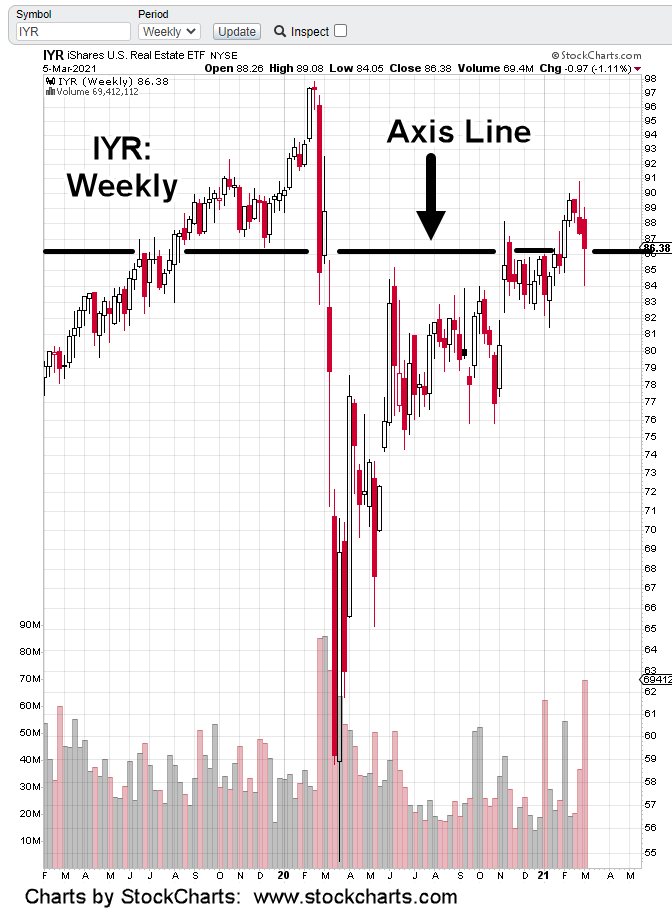
Today’s price action in real estate (IYR) looks like a test of the failed breakout (up-thrust) from February.
This session, price action came all the way back to support (87.90), which is now resistance.
The important part, the level did not hold. Late in the session there was erosion and retreat to close well below the day’s highs.
This type of behavior is near textbook for a significant reversal.
From a trading perspective, the short position via DRV was maintained (not advice, not a recommendation) except for reducing the position by about 2.5% … essentially negligible.
Today’s test and erosion is one of those few times where probabilities are high; the market’s tested the up-thrust (failed breakout) and we can expect prices to decline from here.
One last note adding weight: Today is Fibonacci Day 8, from the high on February 25th.
With conditions noted, posting a test high today, then backing off … indicates downside ahead.
Note: Posts on this site are for education purposes only. They provide one firm’s insight on the markets. Not investment advice. See additional disclaimer here.
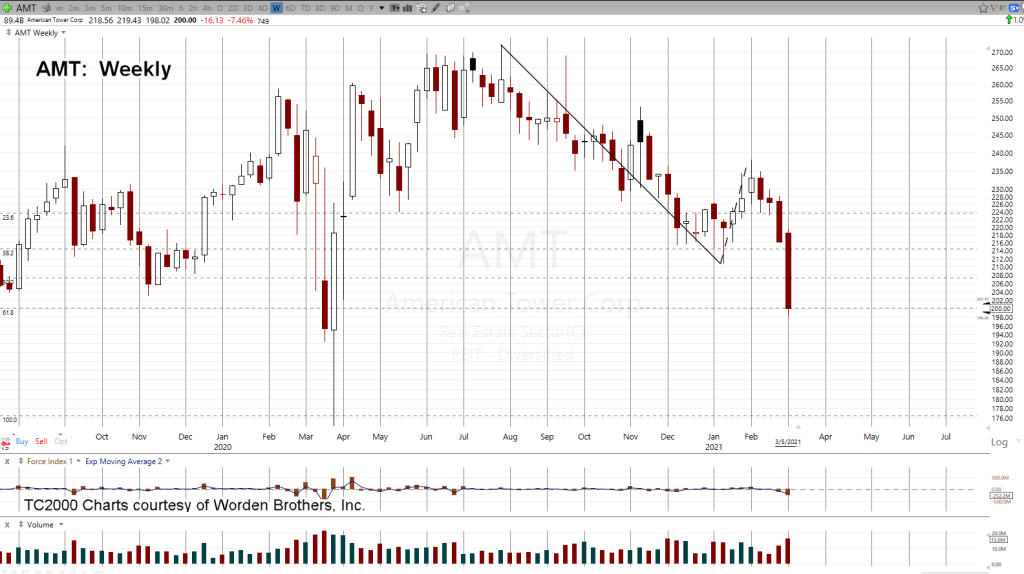
AMT’s the big cap leader in the real estate sector, IYR. Four weeks ago, a potential reversal was covered in this report. Since then, it’s been a dramatic move to the downside.
Early Session Update, DRV as noted below:
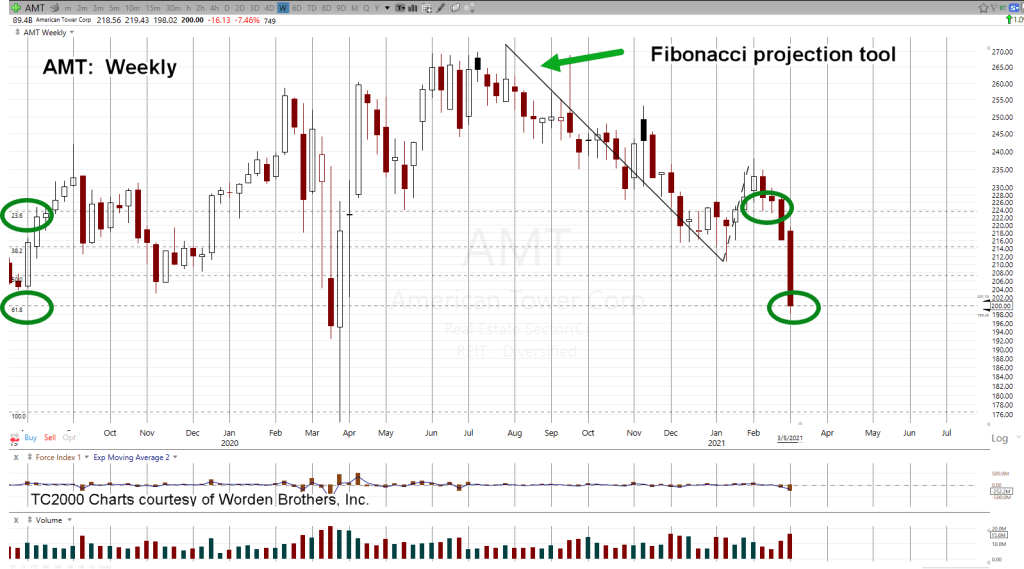
The weekly chart above, shows about 20-months of price action. Included (but faint to see) is the Fibonacci projection tool.
The same chart below, has key areas highlighted for clarity.
At this juncture, AMT’s adhering (almost exactly) to downside Fibonacci projection levels.
However, once it becomes obvious, markets tend to break away from predictable paths.
So, we’ll see what happens next.
At this point, there’s no doubt, AMT’s reversed down and not showing signs of a bottom
Positioning:
The firm’s position has not changed. We’re short this sector via DRV (not advice, not a recommendation). The last update noted the short position was increased during Friday’s late session rally.
At the trader’s discretion, DRV position is being maintained (past the soft-stop).
Summary:
This week’s action may tell us if we’re going to continue oscillating about the axis line discussed here, or if now’s the time for a decisive move lower.
In a forthcoming report, we’ll discuss market alternation and how the character of the AMT reversal has changed.
Stay Tuned
Note: Posts on this site are for education purposes only. They provide one firm’s insight on the markets. Not investment advice. See additional disclaimer here.
Note: Posts on this site are for education purposes only. They provide one firm’s insight on the markets. Not investment advice. See additional disclaimer here.
With the kids at the card-table, freaking about ‘plunge protection team‘, rigged markets and Bitcoin, grownups the next table over, are planning their moves.
Friday’s late session rebound higher was not uncommon for a typical short squeeze.
These gyrations are intended to make sure only a select few are aboard when we get the break.
This idea is not new. You’ll find statements to that effect over and over in most any trading book.
The big difference now, is the amazing level of complacency and learned helplessness of the overall population.
Just one example of such before we move on to the charts.
Texas has opened up. Schools are about to go without diapers. Perish the thought.
Yet, there’s still a contingent that’s near hysteria about ‘safety’.
With all the information available, yes one actually has to do real research to find out what’s going on, huge segments of the population adamantly remain (intentionally) ignorant.
Unfortunately, that segment has voluntarily (at least in the U.S.) lined themselves up to be taken out; financially as well as physically.
Just a few of the most recent links, here, here, and here.
At some point, those links are going to become common knowledge.
Hopefully, there will be long lasting and certain retribution for the perpetrators. However, for those who ‘volunteered’, it’s already too late.
Now, on to the markets.
Friday’s real estate rebound (IYR) looked like short-squeeze action.
In response to that and late in the session, short position DRV (3X inverse IYR) was increased at price 9.37 (not advice, not a recommendation).
Volatility is still low in IYR. Short positions can be increased with less risk.
The Big Break
When and if the break comes, it’s likely to be fast; no time to plan.
Whatever plans one has should’ve been laid out well ahead of time.
Two markets being watching closely are Peabody Energy (BTU) and Seabridge Gold (SA).
By now everyone’s aware that a certain far east country is going about its business and building their infrastructure … as if nothing had ever happened. Funny that.
Conversely, the coal market has bottomed out and so has Peabody.
On top of that, the Texas Freeze laid bare the farce that is climate change, global warming and green energy.
Quietly, without fanfare, coal is seeing increased demand.
The blue arrow is a gap in trading that could be filled.
To do that, there might have to be a massive market collapse, pushing BTU back to that level … if only temporarily.
Huge volume in the past six months shows that somebody’s buying.
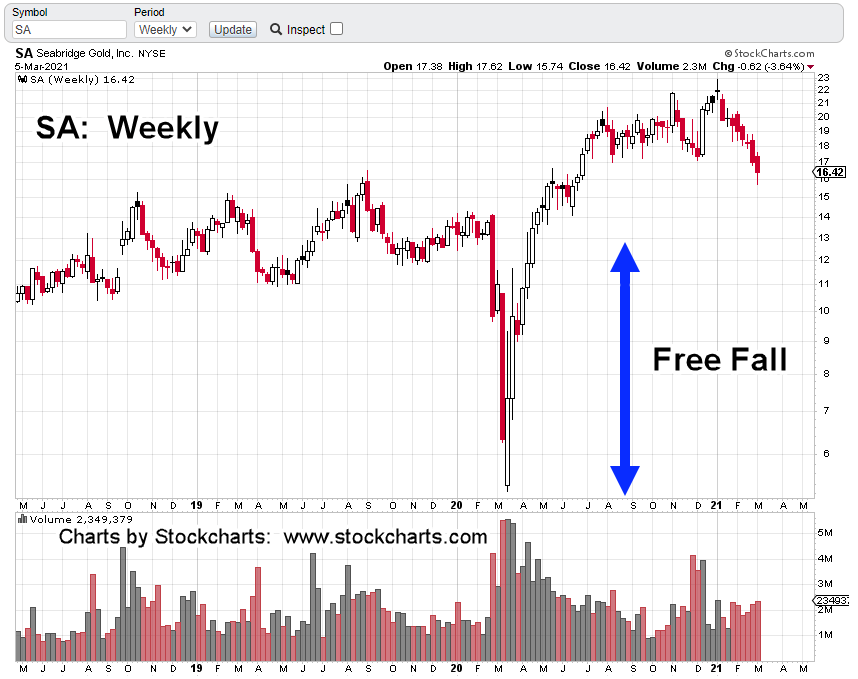
The next market is Seabridge Gold (SA) which is being watched for essentially the same reasons. If Van Metre is right and we’re in a deflationary impulse, the entire public’s on the wrong side of the trade.
If SA can get itself below 13 – 14, it then enters free-fall territory.
If that happens, as with BTU, it too might be a short lived event.
Positioning:
Currently, the firm’s position (not advice, not a recommendation) is short biotech and real estate via LABD and DRV, respectively.
If BTU and SA get to extreme lows, both of them have potential for a ‘ten-bagger’, the possibility to gain over 1,000%.
Getting to such gains would necessitate a change in the current strategy of trading, to buy and hold.
Summary:
Pressure seems to be building for some unexpected event that would cause a market break; Possibly the devaluation of the Yuan as discussed by Steven Van Metre.
Note: Posts on this site are for education purposes only. They provide one firm’s insight on the markets. Not investment advice. See additional disclaimer here.