Bearish Case Continues

Silver seems to be like a stubborn mule, refusing to launch higher.
It was curious to see both silver and gold sell-off after Tuesday’s ‘results’.
When looking at the SLV, chart, the bearish case continues to build (not advice, not a recommendation).
Silver SLV, Weekly
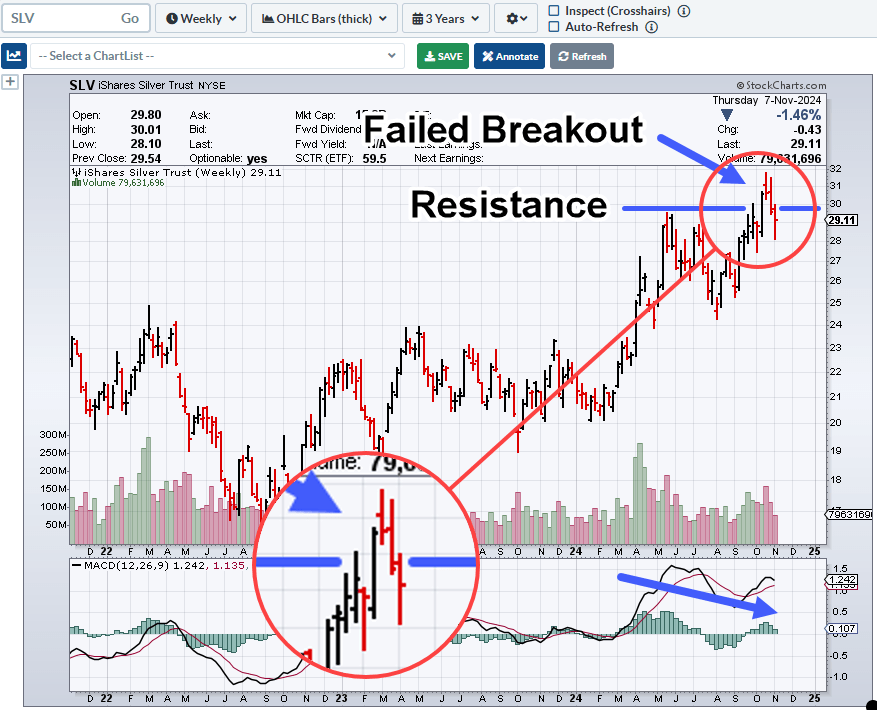
We’ve got a clear bearish divergence on MACD, just about to ‘cross-over’ to the downside.
The economy (implosion) may already be baked into the cake, no matter what anyone does.
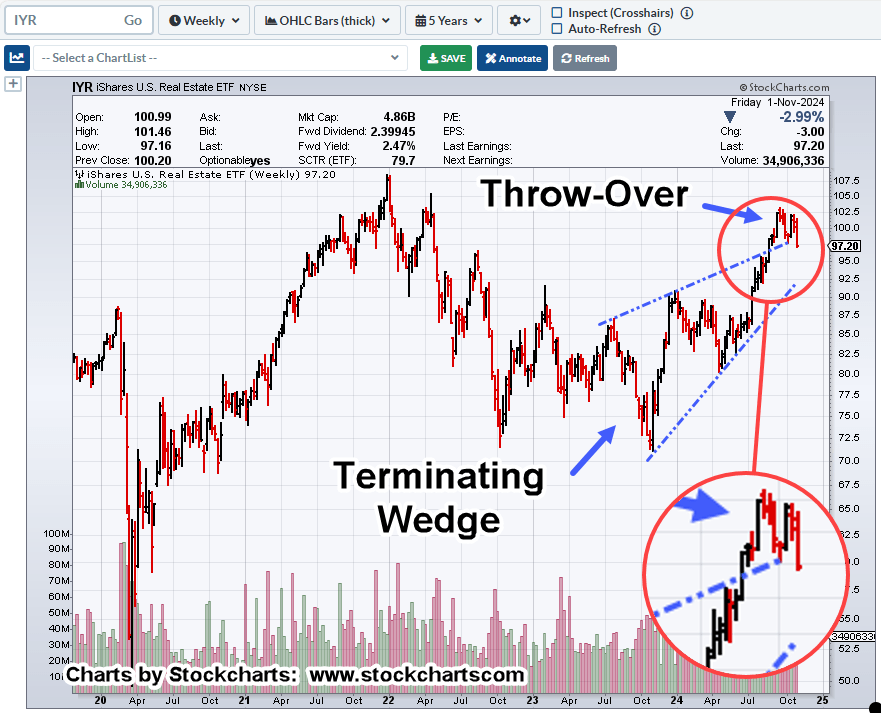
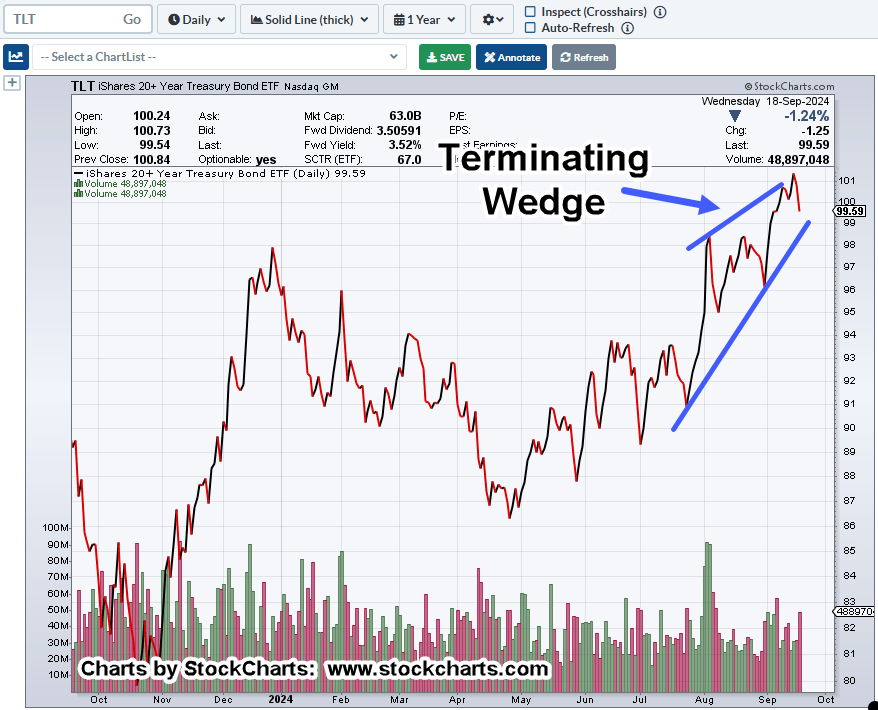
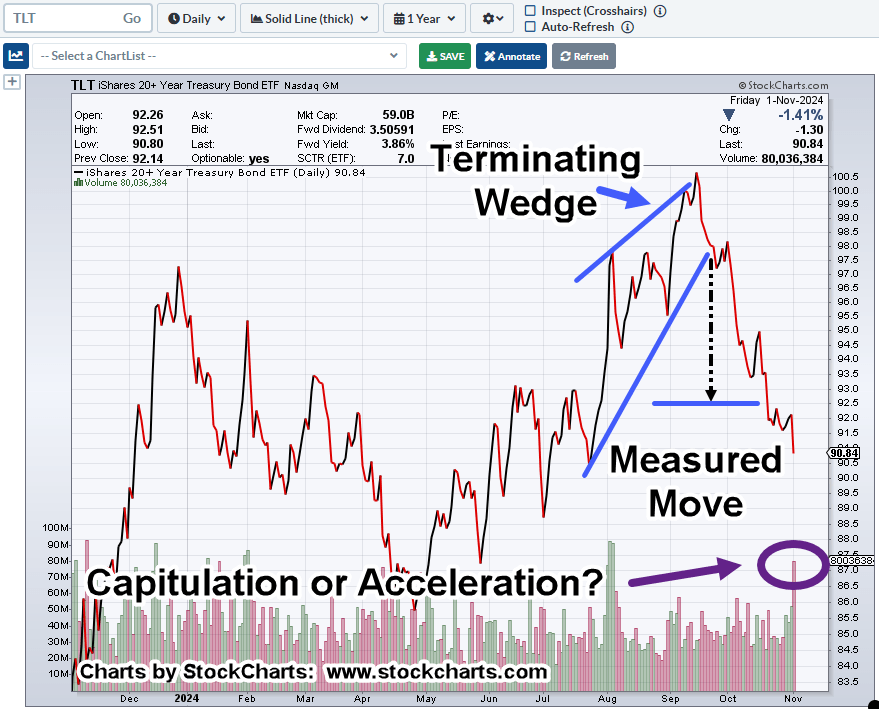
Interest rates continue to scream higher, bonds down (TLT), no matter what the Fed does.
Stay Tuned
Charts by StockCharts
Note: Posts on this site are for education purposes only. They provide one firm’s insight on the markets. Not investment advice. See additional disclaimer here.
The Danger Point®, trade mark: No. 6,505,279