Note: Posts on this site are for education purposes only. They provide one firm’s insight on the markets. Not investment advice. See additional disclaimer here.
It was a very busy Friday, hence the reason for the late update.
One short position closed (SOXS-25-10) and five more opened.
Cisco Systems was one of those five (not advice, not a recommendation).
Earnings for CSCO, were released in mid-august; market reaction was a swift move lower.
From the earnings, everything seems to be good.
However, at this juncture, that’s not what the market is saying (at least for now).
Cisco Systems CSCO, Daily
Note:
As a general rule (for my firm), on any initial position, the implied stop for that position is that day’s session high or low depending on long or short.
In the case above, that means a ‘buy-to-cover’ stop at the day’s high of CSCO 68.10 (not advice, not a recommendation).
Other (short) positions to be reviewed over the weekend.
Note: Posts on this site are for education purposes only. They provide one firm’s insight on the markets. Not investment advice. See additional disclaimer here.
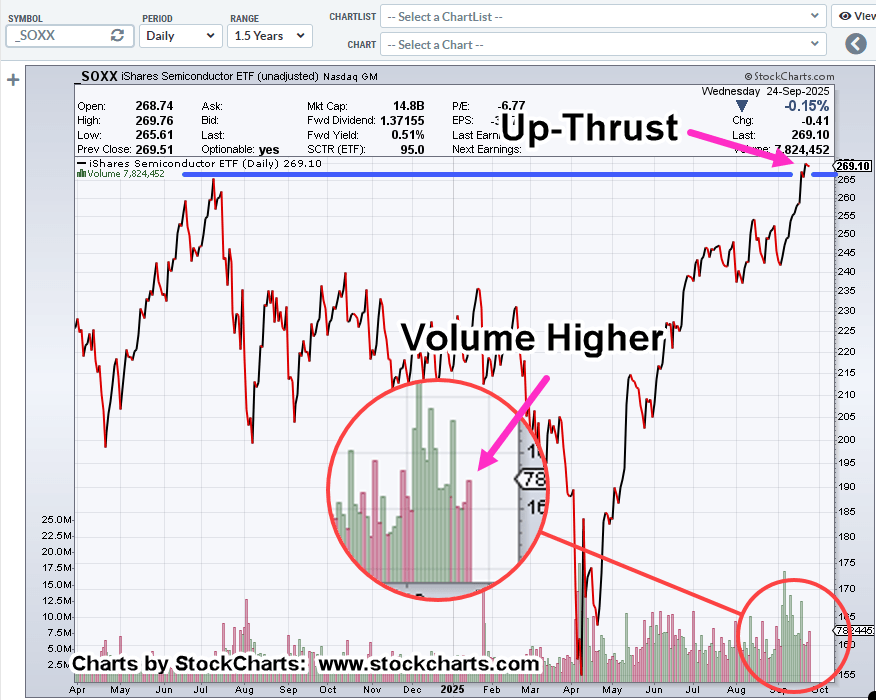
As the chart shows, the SOXX has been struggling for weeks in the resistance zone.
From that chart, one question to be asked, did the overnight and early session fill the gap?
The other question, did the Nvidia earnings release change the dynamic of the sector?
Reading price action since then, in real time, the answer seems to be yes (not advice, not a recommendation).
Semiconductors SOXX, Weekly
As of this post (10:35, a.m., EST), the SOXX is struggling to post higher … but it’s not happening.
There’s a lot of congestion around the resistance zone. In Wyckoff terms, he calls this price action ‘Cause’.
Meaning, that if we break materially lower from here, it’s called ‘Effect’.
His point being, since there’s sufficient cause for a sustained move, if/when it happens, we’re to expect a corresponding effect (not advice, not a recommendation).
Note: Posts on this site are for education purposes only. They provide one firm’s insight on the markets. Not investment advice. See additional disclaimer here.
When looking at the chart of Junior Miners, GDXJ, it’s possible we could be in the midst of a massive terminating wedge ‘throw-over’ (not advice, not a recommendation).
We’re about an hour before the close; GDXJ, price action is beginning to retreat off its session highs.
Junior Miners, GDXJ, Weekly
Upward thrust (Force) is dissipating.
If action enters back into the wedge pattern, it’s typically viewed as a sell, or sell short signal (not advice, not a recommendation).
Note: Posts on this site are for education purposes only. They provide one firm’s insight on the markets. Not investment advice. See additional disclaimer here.
Gold, silver, and the S&P are essentially unchanged (as of 6:44 p.m., EST).
Although it appears to be a quiet weekend, we should at least take note of the terminating wedge pattern in the S&P.
The S&P is probably the most computer controlled, most manipulated, most algorithmed (if that’s a word) market in the world.
From a personal standpoint, I do not trade it and have not for over 15-years.
There are better ways to engage and not volunteer oneself to get whacked every day by a mass of computer algorithms (not advice, not a recommendation).
With that said, we’ll look at it anyway. 🙂
S&P 500, SPY, Daily (segment)
We’re oscillating into a wedge pattern. A wedge typically occurs at the end of a move, whether it be up or down.
With the Nvidia earnings release out of the way, the tone of the overall market may have changed.
Note: Posts on this site are for education purposes only. They provide one firm’s insight on the markets. Not investment advice. See additional disclaimer here.
From a $100,000 Jeep Grand Wagoneer to no-bids on used cars at auction, the car market’s getting hit from both sides.
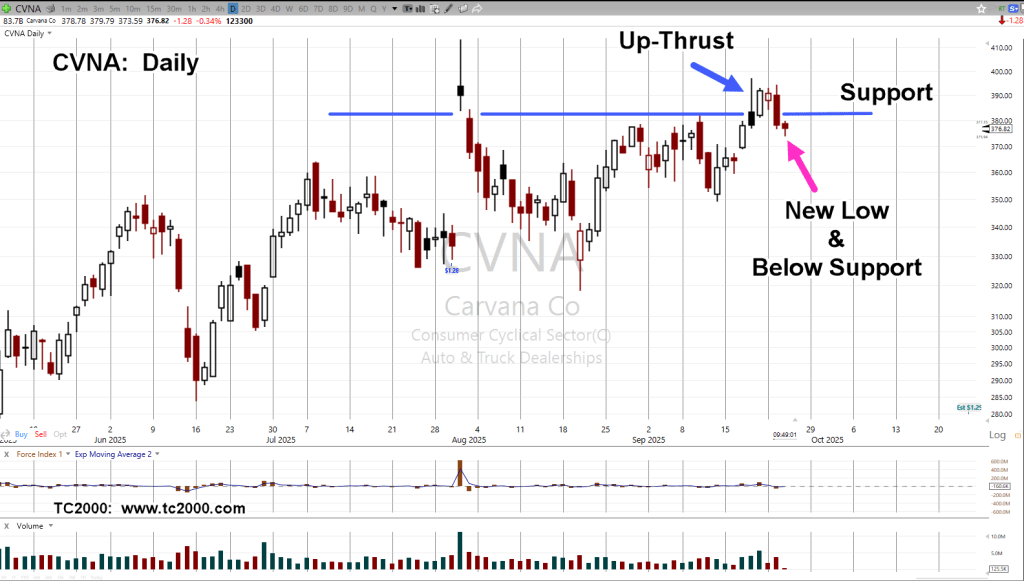
While Carvana rival CarMax, reached all-time highs long ago, now down -60.34%, for whatever reason, Carvana remains a ‘mystery’.
Carvana CVNA, Daily
The horizontal line is the prior all-time high (376.83), set way back on August 10th, of 2021.
Up-thrust close high, to test close high, Fibonacci 21-Days.
From August 20th low, to test print high (Friday), Fibonacci 8-Days, putting CVNA, at 61.8%, retrace (not shown).
Positioning
Friday’s new daily low was the signal to go short. However, that short was not entered immediately.
Instead, we wait. The objective is to minimize the risk as much as possible.
Late in the session, 3:57 p.m., EST, short opened at 371.6412, with stop at the session high (378.54), for total ‘risk’ of 6.90-pts (not advice, not a recommendation).
Note: Posts on this site are for education purposes only. They provide one firm’s insight on the markets. Not investment advice. See additional disclaimer here.