The Truth Comes Out

Here’s a different take on Wall Street’s ‘outrage‘ over a year’s worth of fake jobs data.
No, the outrage is not about the data being fake, the outrage may be the curtain has been pulled back, allowing the public to see the truth.
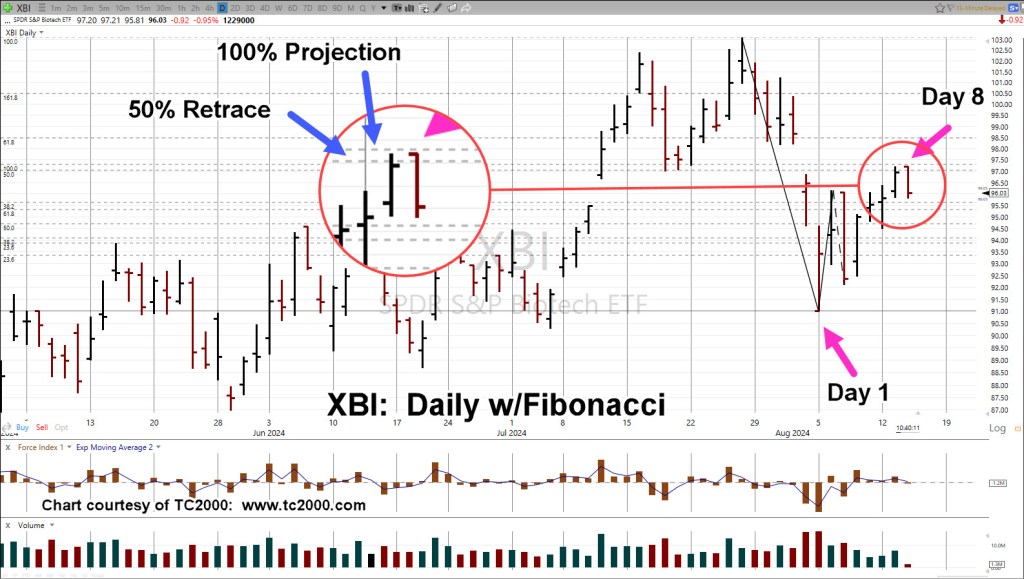
That truth, discovered by Wyckoff back in 1902, was price action has no connection to so-called economic numbers.
In fact, he said (paraphrasing):
‘Dynamics were operating on prices that had no relation to any fundamentals.’
If market action really was based on fundamentals, an historic revelation of 818,000 fake jobs, would have sent the indexes into a frenzy, which did not happen.
In fact, nothing happened
Now, we have ‘The Street’ putting the pieces back together (trying to re-hypnotize their clientele) and come up with another fake narrative; surely, the Fed will lower rates this time … honest!
Well, let’s leave the clown show (for now) and get back to some real, reality, the A.I. bubble.
Semiconductors SOXX, Daily
What do you see?
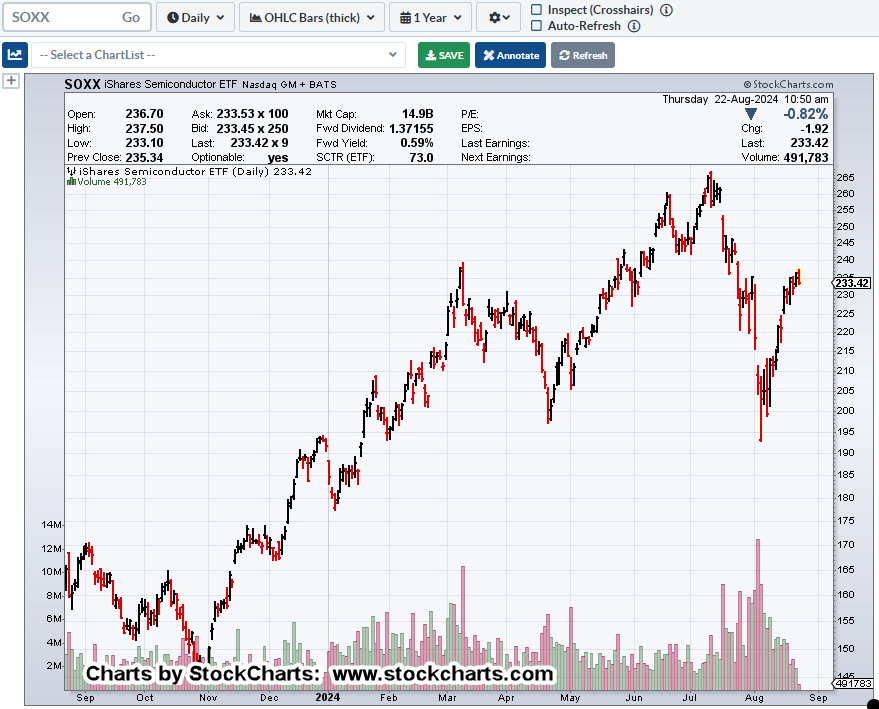
If you’re a long-time visitor (welcome back), by now, your market recognition should be near instant.
That is, we have a Head & Shoulders pattern (not advice, not a recommendation).

Nothing is ever perfect in the markets, but this one is near textbook.
Positioning
Shorting this sector is more than a little dangerous.
Just take a look at the gaps, volatility, huge percentage swings up and down, with leveraged inverse fund SOXS.
With that said, and with the danger in mind, a potential low-risk short (via SOXS) was established early this session.
The trade is labeled, SOXS-24-13, with a stop at the day’s low of SOXS 20.63 (not advice, not a recommendation).
Stay Tuned
Charts by StockCharts
Note: Posts on this site are for education purposes only. They provide one firm’s insight on the markets. Not investment advice. See additional disclaimer here.
The Danger Point®, trade mark: No. 6,505,279