Note: Posts on this site are for education purposes only. They provide one firm’s insight on the markets. Not investment advice. See additional disclaimer here.
Note: Posts on this site are for education purposes only. They provide one firm’s insight on the markets. Not investment advice. See additional disclaimer here.
Note: Posts on this site are for education purposes only. They provide one firm’s insight on the markets. Not investment advice. See additional disclaimer here.
Note: Posts on this site are for education purposes only. They provide one firm’s insight on the markets. Not investment advice. See additional disclaimer here.
Note: Posts on this site are for education purposes only. They provide one firm’s insight on the markets. Not investment advice. See additional disclaimer here.
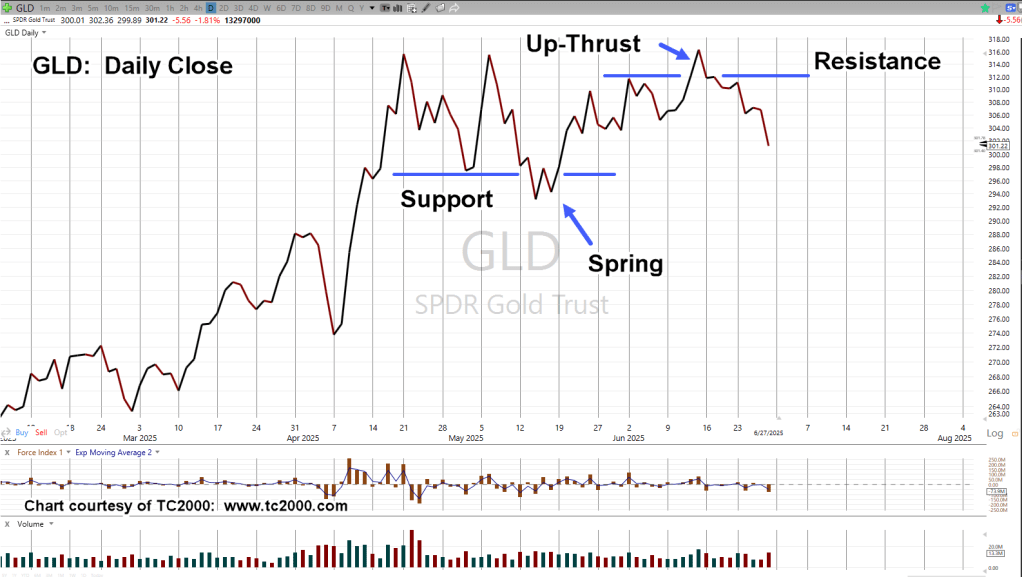
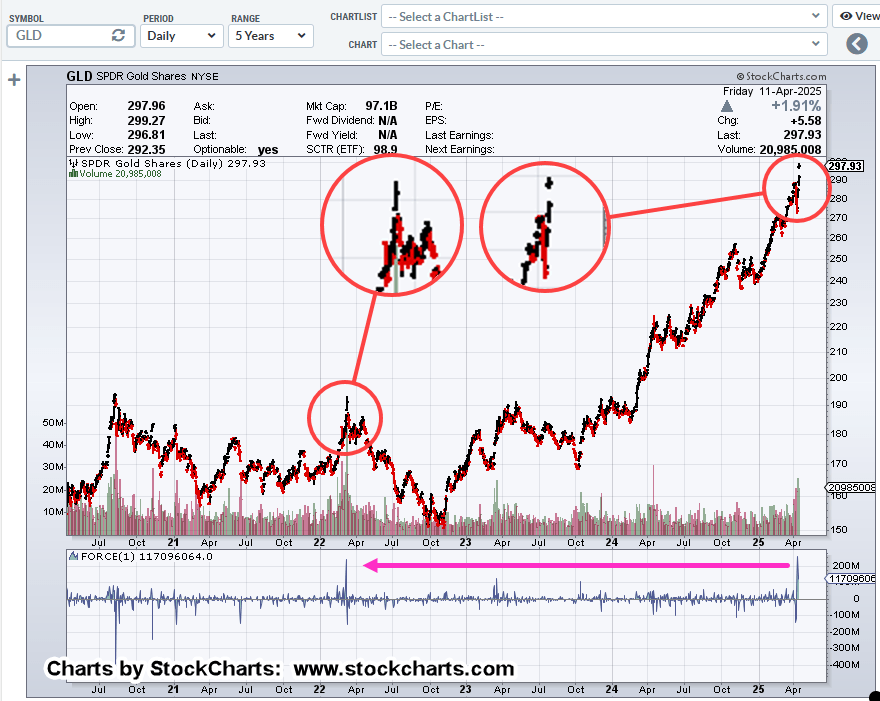
Seven weeks ago, was this post, giving a ‘heads up’, gold (GLD), had just printed massive upward thrust energy.
A print like that, happened only once before, near the 2011, top.
From that top, GLD, traded in a range for over a year before heading into a sustained decline.
That decline lasted three years, GLD down -46%.
So, here we are. 🙂
We’ve posted massive upward thrust energy seen only once before, a potential top, sideways action for just over two-months; then, trend breaks down.
Sounds about right.
Now, all-of-a sudden, professionals may be selling (or set, to sell), link here (not advice, not a recommendation).
Gold GLD, Daily Close
We’re going to look at GLD, a bit differently. That is, the repeating pattern of Spring-to-Up-Thrust, link here.
Human psychology does not change.
Buying on the way down.
From ‘One Way Pockets’, first published in 1917, the author had access to client accounts, analyzing their behavior over bull and bear cycles.
From his findings:
Once a stock had reached its peak and started a long decline, that’s where most of it was ‘handed out’. Sold to the public as it was moving lower … then, lower, still.
Wyckoff seconds this truth; ‘those on the wrong side of the trade, provide (most of) the fuel, for the way lower’.
Short Term, Long Term, or Not at All
As this update presented, we’ve had a potential top indication for GLD that’s only happened once before.
The last time, it was over four years before GLD, bottomed and started the next bull run.
It’s impossible to know if this time is different.
However, price action itself, will tell us the next probable direction.
Note: Posts on this site are for education purposes only. They provide one firm’s insight on the markets. Not investment advice. See additional disclaimer here.
Note: Posts on this site are for education purposes only. They provide one firm’s insight on the markets. Not investment advice. See additional disclaimer here.
Note: Posts on this site are for education purposes only. They provide one firm’s insight on the markets. Not investment advice. See additional disclaimer here.
In the past few weeks, it seems like the markets have been whacked with a lot of, ‘the largest, ever’.
Trading in bonds, specifically TLT, is no exception.
While the media and pundits alike, deflect with ‘who’s doing the selling’ (hint: it’s not important), we’re going to look at the harder question of ‘what does it mean?’
Kick-Off, or Capitulation
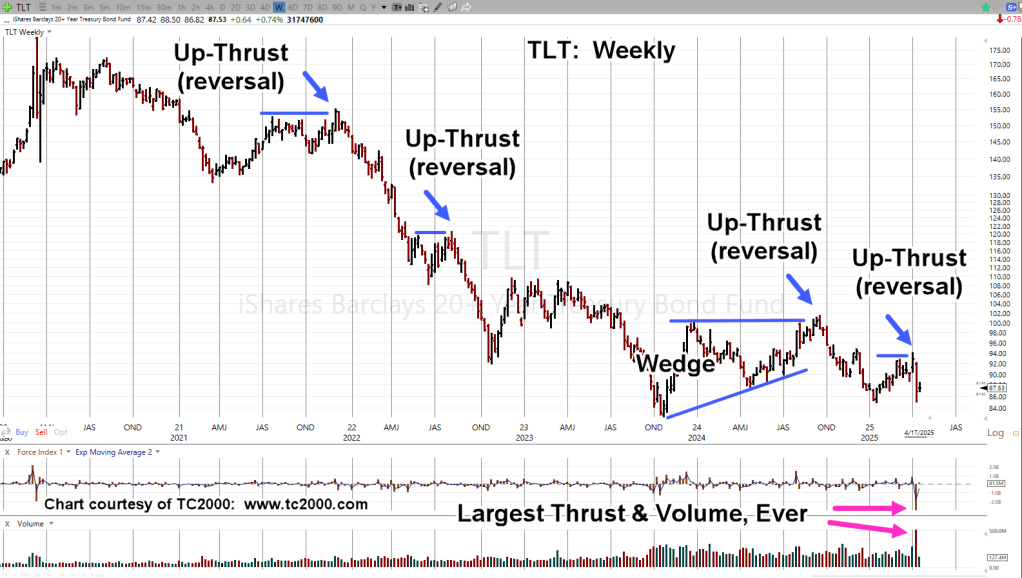
Borrowing from research and writings of Wyckoff, Weis, and Prechter, when we get such a huge thrust downward (chart below), it’s typically one of two events:
A massive kick-off to much lower prices or a capitulation that washes-out the weak hands.
A bond upside reversal (rates lower) is a common sign of nearing or active economic downturn (not advice, not a recommendation).
In this interview with Greg Hunter, Ed Dowd covers the topic … the expectation for the reversal. However, that interview, was before the massive thrust lower.
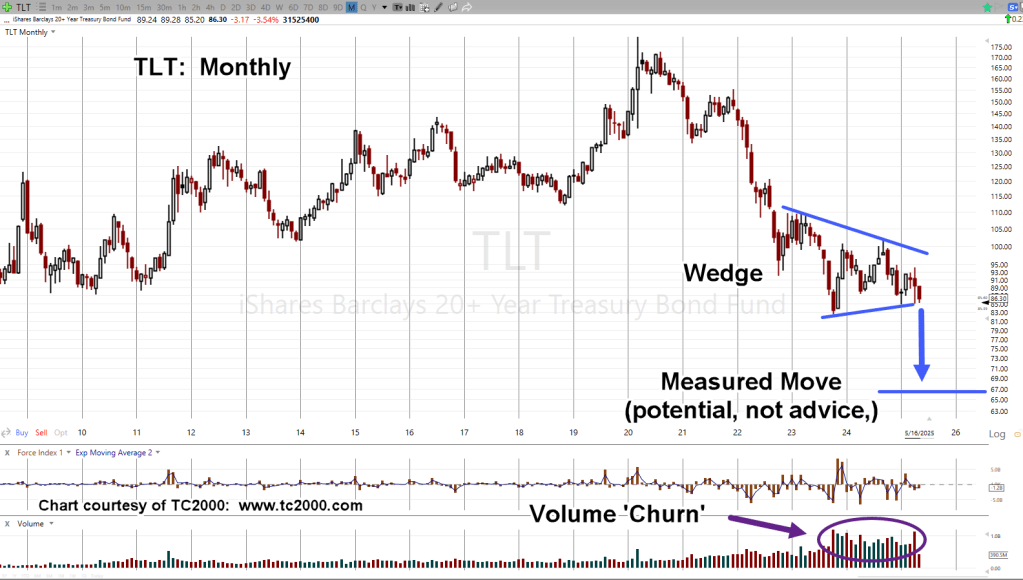
Long Bond Proxy, TLT, Weekly
For years, it’s been one failed upside (reversal) after another.
Is this time, different?
The right side (magenta arrows) shows unprecedented thrust and volume.
So far, there has been a weak recovery to 38.2%, retrace of the recent down-move.
If that retrace level holds, with bonds continuing lower (rates higher), it does not bode well for the ‘capitulation’ narrative.
Note: Posts on this site are for education purposes only. They provide one firm’s insight on the markets. Not investment advice. See additional disclaimer here.
To answer that question, or at least look at the probabilities, let’s step away from the breathless, me-too herd, and see what’s really going on.
Silver, One Year Later
Before we get to what the crowd’s doing now, as a reminder, last year at this time (the crowd said), silver was supposed to be launching into a hyperinflationary breakout.
Remember that? Well, it didn’t happen. 🙂
This site posted for months, price action itself (SLV) indicated the probabilities were low for a sustained breakout, starting with this link.
However, there are times when the masses are correct. Is this one of those times?
Let’s take a look.
First, The Hysteria
To get a gage on what’s going on, we have a sample of the current mind-set, listed below.
‘Sell America’ Trade Sparks Gold-Rush, Dollar Crush As US Bond Yields Surge Most In 43 Years, link here.
Gold Euphoria, Bond Mayhem, Dollar Disgrace, link here.
Note: Posts on this site are for education purposes only. They provide one firm’s insight on the markets. Not investment advice. See additional disclaimer here.