Nailing The Top, and Retrace
Way back, in April of 2022, was this post.
CORN had been moving steadily higher for nearly two years.
Using Wyckoff and Fibonacci, the (potential) top and retrace was identified one week before it actually happened.
The last update on CORN, with chart analysis was here.
Fast forward to this post; commodities pivoted, and appear to be moving higher in relative unison.
So, what happens now?
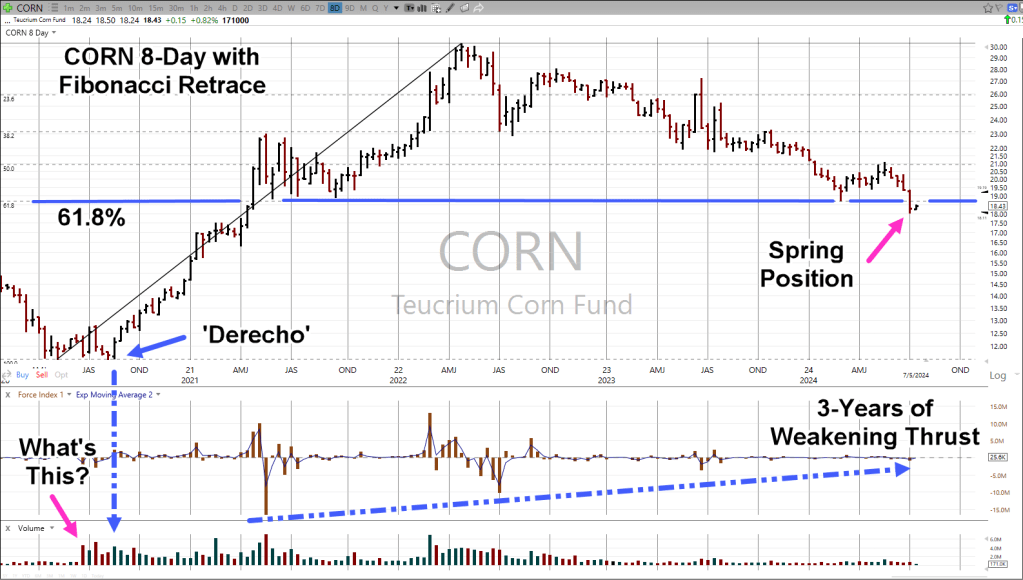
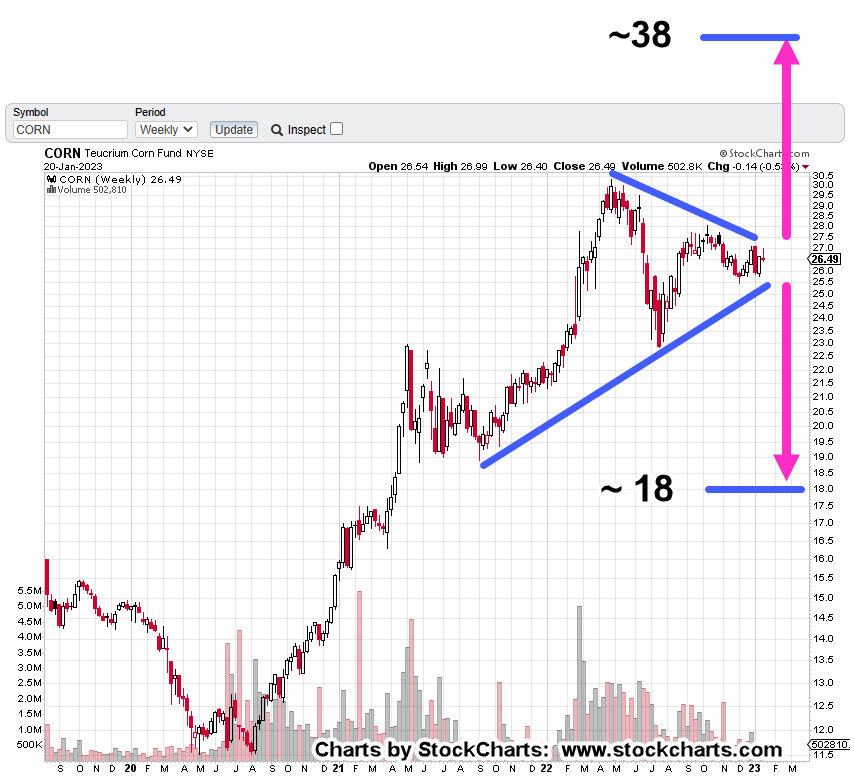
Teucrim Fund, CORN, Monthly
The ‘magenta’ arrow shows the location of the April post.
Moving on to the right-side, CORN held below support for seven months before pivoting higher.

If the labeling is correct, we have what looks to be a Wyckoff ‘spring’ set-up (not advice, not a recommendation).
That amount of time below support seems a bit of a stretch for labeling it as a ‘spring’.
Has that ever happened before?
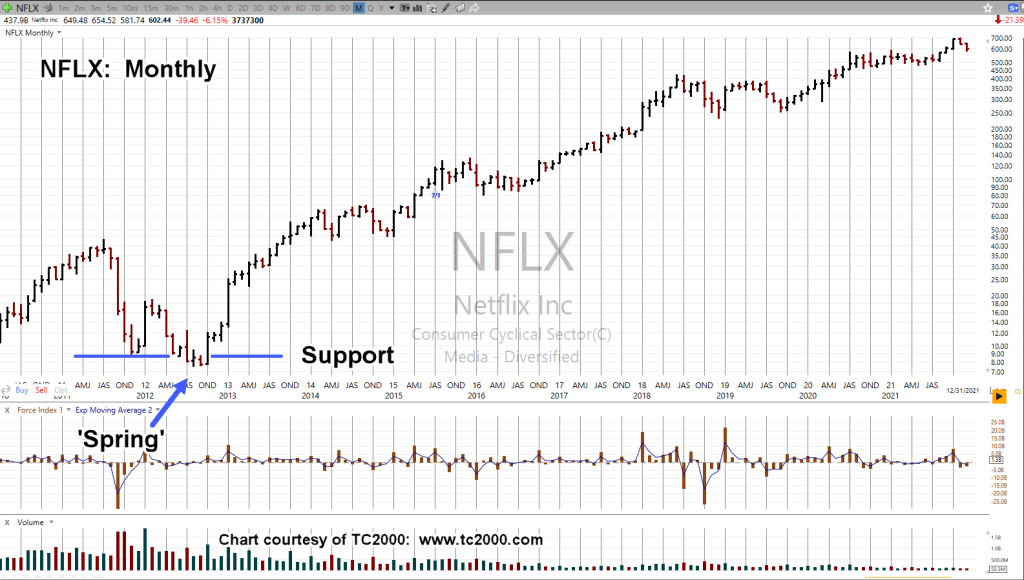
Case in point, Netflix
Netflix NFLX, Monthly
Depending on how it’s measured, back in 2012, NFLX, printed below support three-to-five months, before moving higher … in a big way.
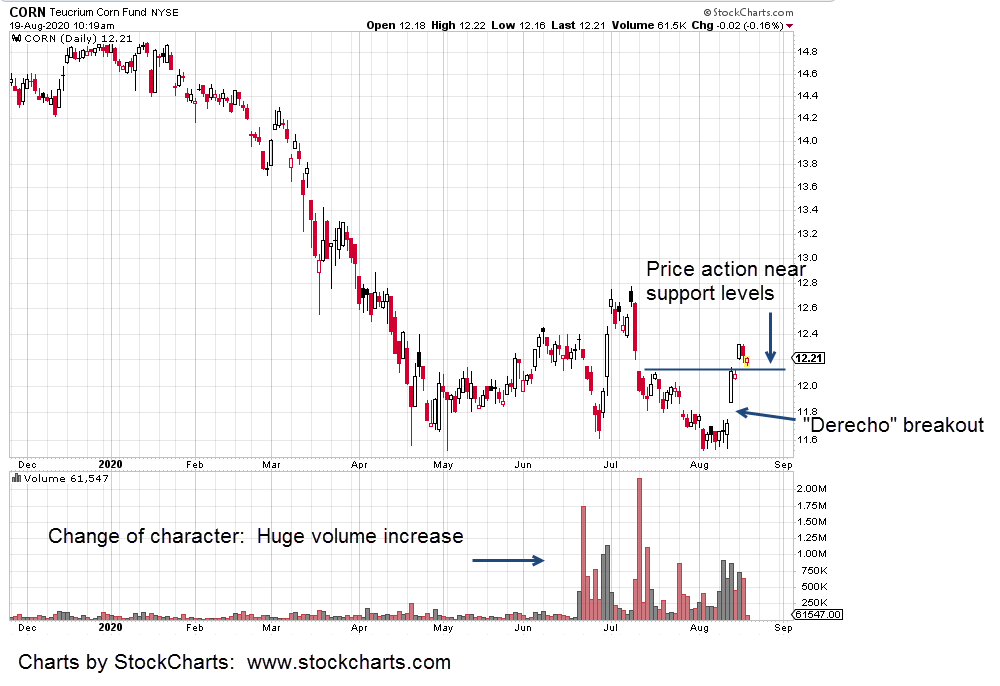
With the chart of CORN, it’s unknown if we’ll get a ‘test’ of the breakout (purple oval).
At this point, there’s so much uncertainty in the financial markets as well as commodities, one needs to at least consider the possibility of a ‘test’.
Stay Tuned
Charts by StockCharts
Note: Posts on this site are for education purposes only. They provide one firm’s insight on the markets. Not investment advice. See additional disclaimer here.
The Danger Point®, trade mark: No. 6,505,279