No-Man’s Land

The markets don’t like uncertainly and that’s just what we have with biotech.
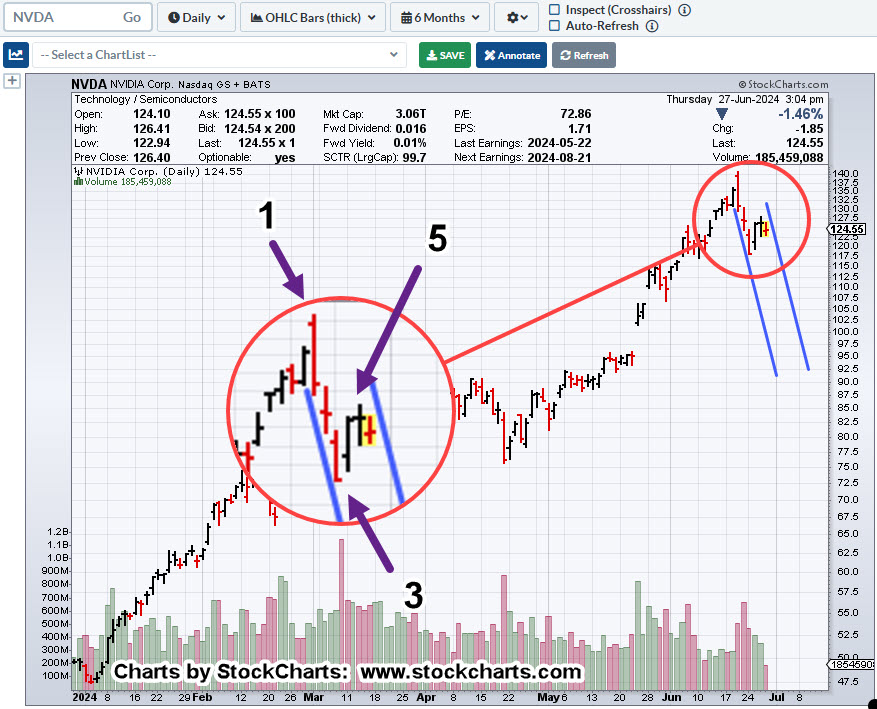
As the chart shows, the question becomes; is it a trend breakout, a breakout and test or a breakout, test, then possible failure?
This interview with Ed Dowd just days ago, paints a bearish picture for the overall markets.
If so, and we apply that scenario to biotech, the odds don’t seem to favor the upside (not advice, not a recommendation).
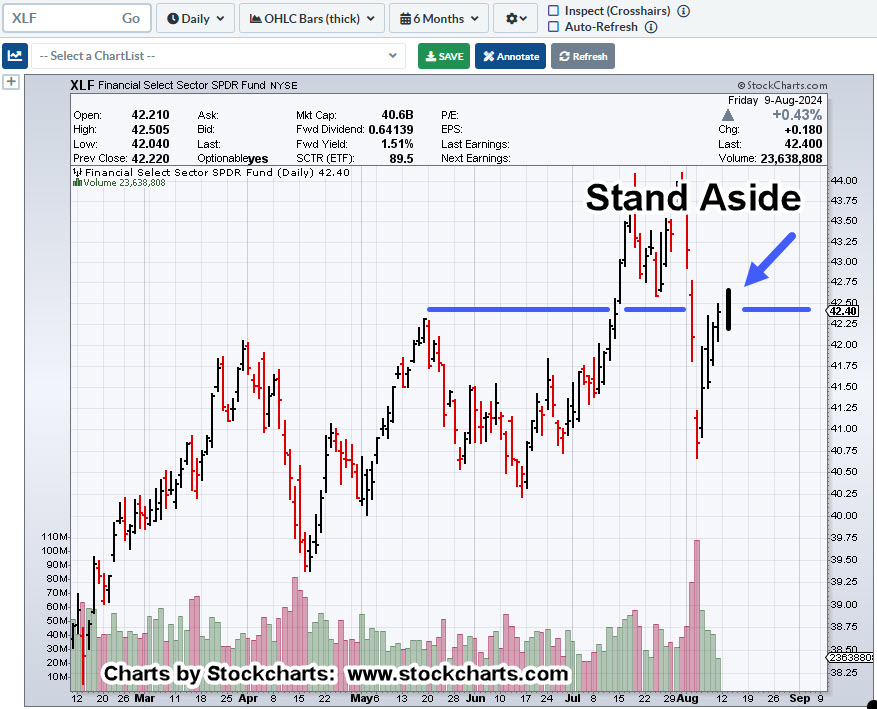
With that, let’s get to the action.
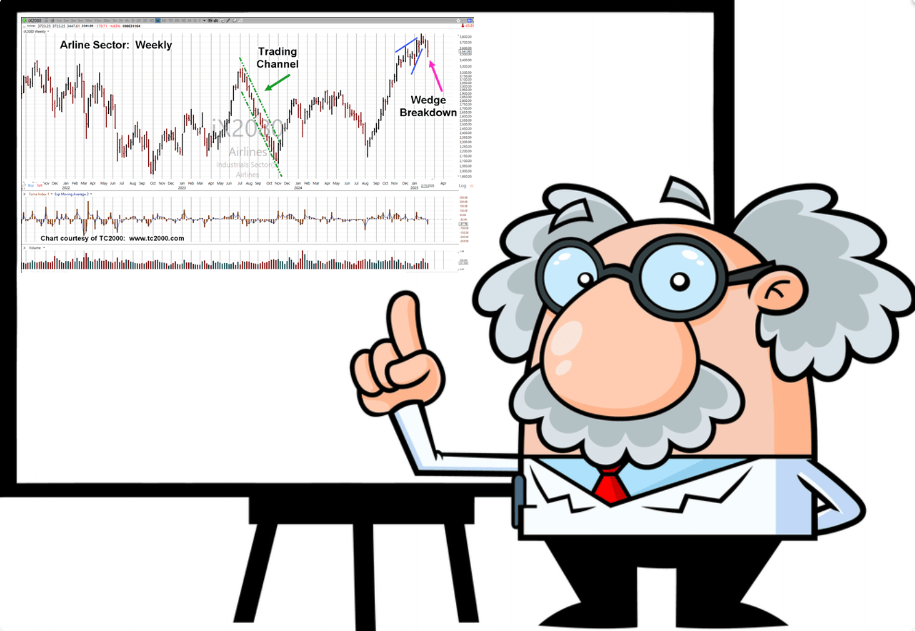
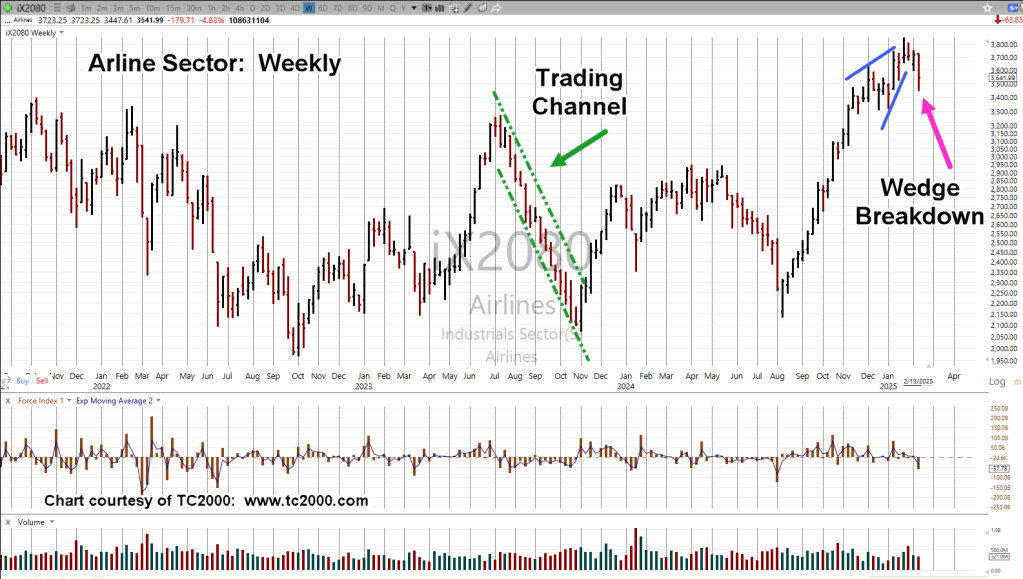
Biotech XBI, Daily
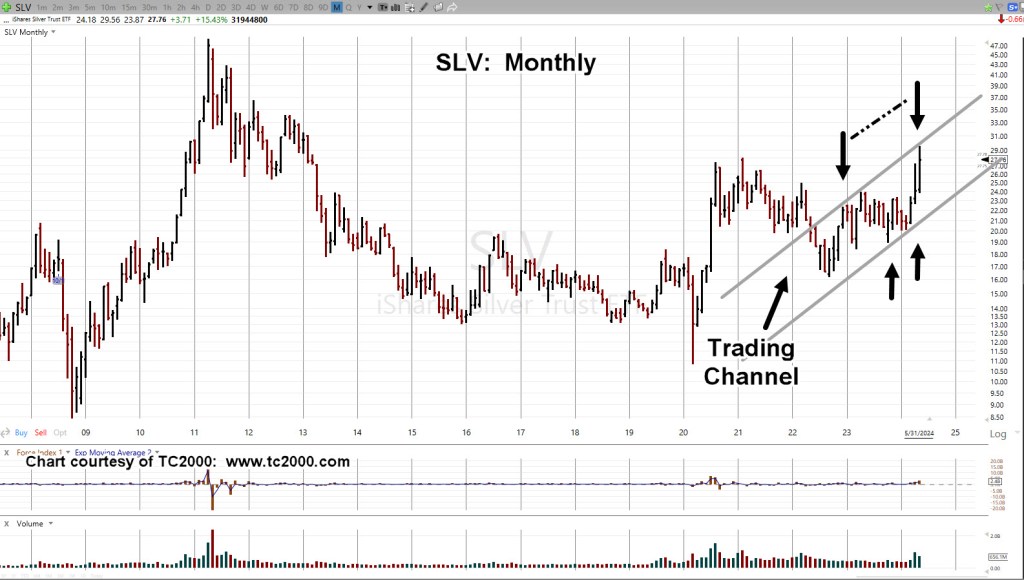
Last Friday, the 21st, was Fibonacci Day 89, from the November 11th, 2024, highs.

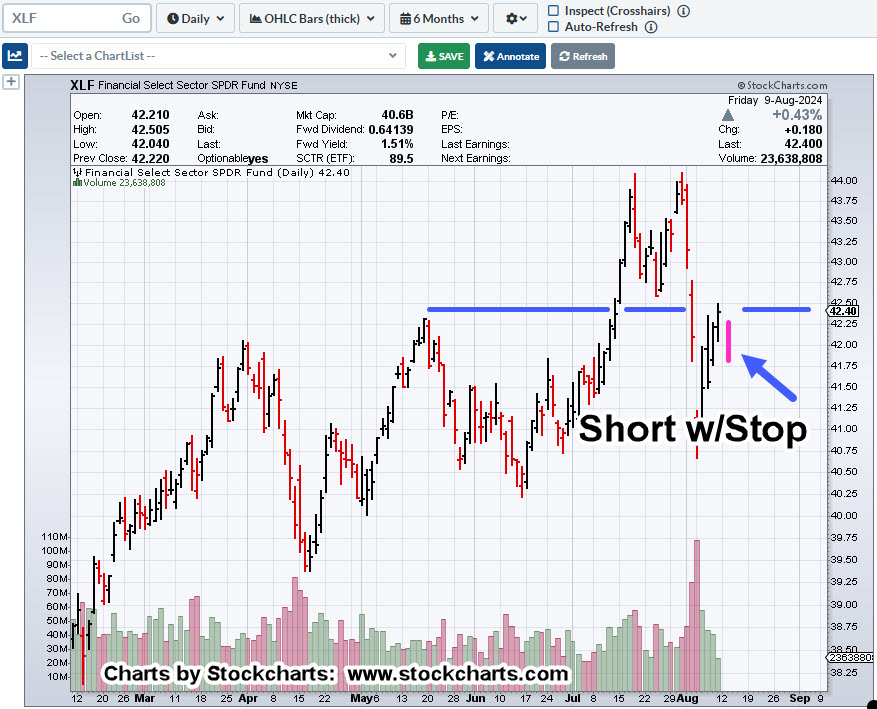
If the trendline is in-effect, meaning the market’s hanging in mid-air in a false breakout, getting back into that trend may result in some dramatic downside action.
On the bullish side, if it’s an upside breakout, ‘normal’ behavior is for a ‘test’ of the trendline.
Either way, both scenarios favor more downside (not advice, not a recommendation).
Stay Tuned
Charts by StockCharts
Note: Posts on this site are for education purposes only. They provide one firm’s insight on the markets. Not investment advice. See additional disclaimer here.
The Danger Point®, trade mark: No. 6,505,279