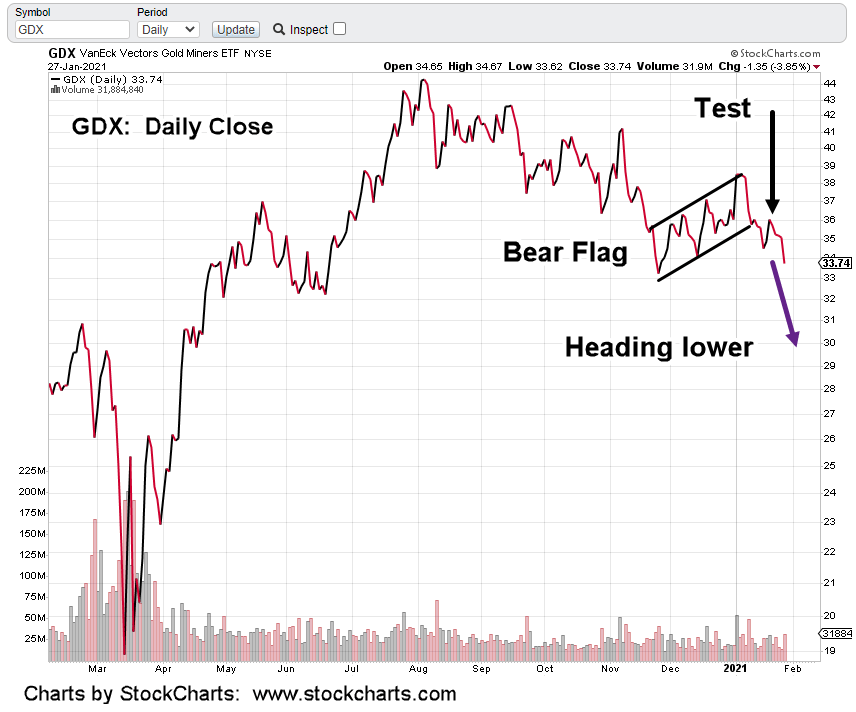
With GDX posting a new weekly low (below 33.23) early this session, it’s helping to confirm a pivot and acceleration to the downside.
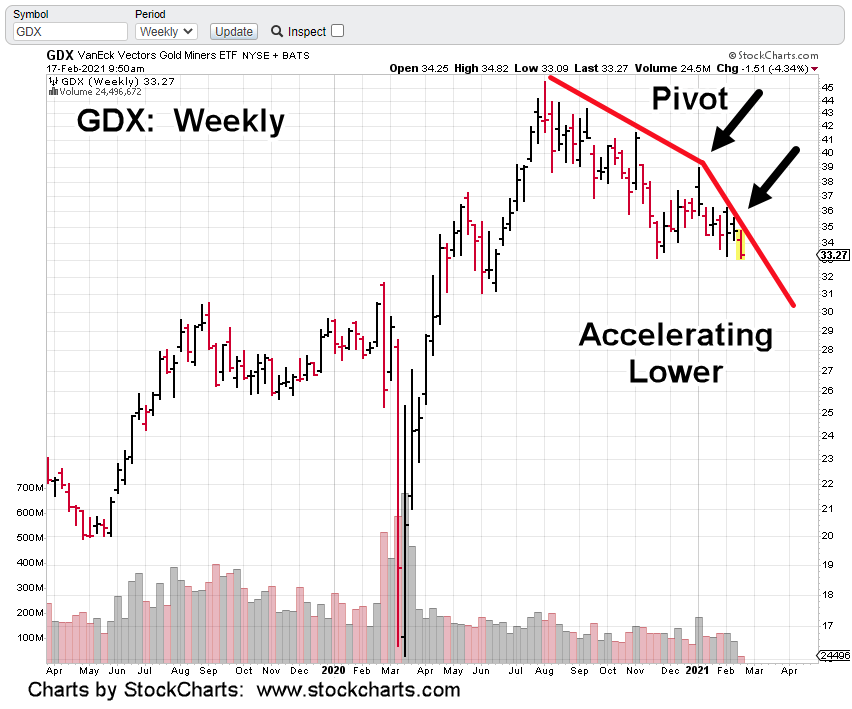
Bullish or bearish, it’s a crowded trade that we’re avoiding (not advice, not a recommendation).
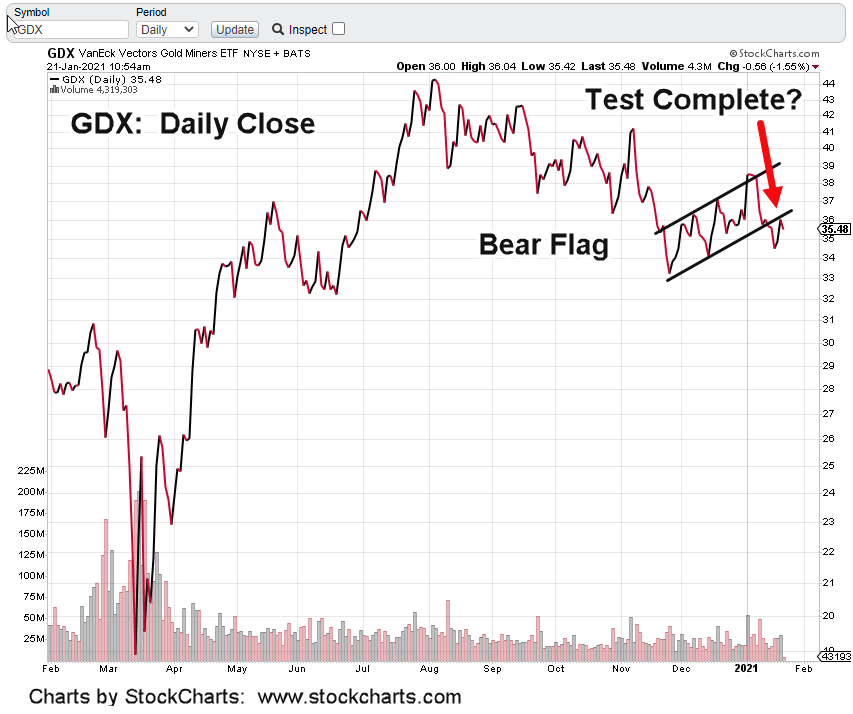
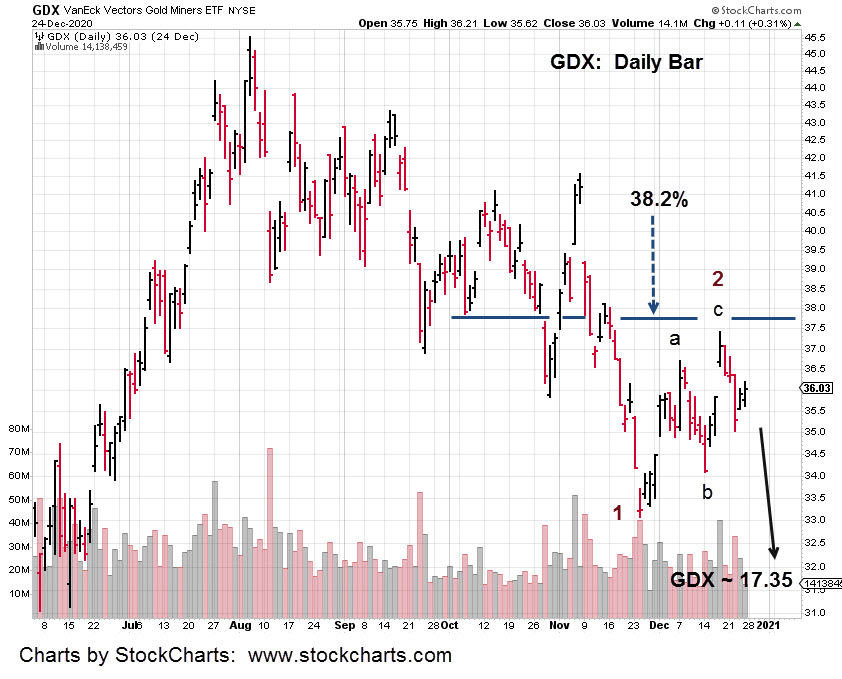
It took over a week of oscillating price action before GDX decided to post below the February 4th, low.
Even so, when an established low is penetrated, it puts the market in “Wyckoff Spring Position’.
That means there’ll (potentially) be some type of rally or rally attempt. If that happens, it’s just more oscillations that result in erosion of leveraged inverse funds.
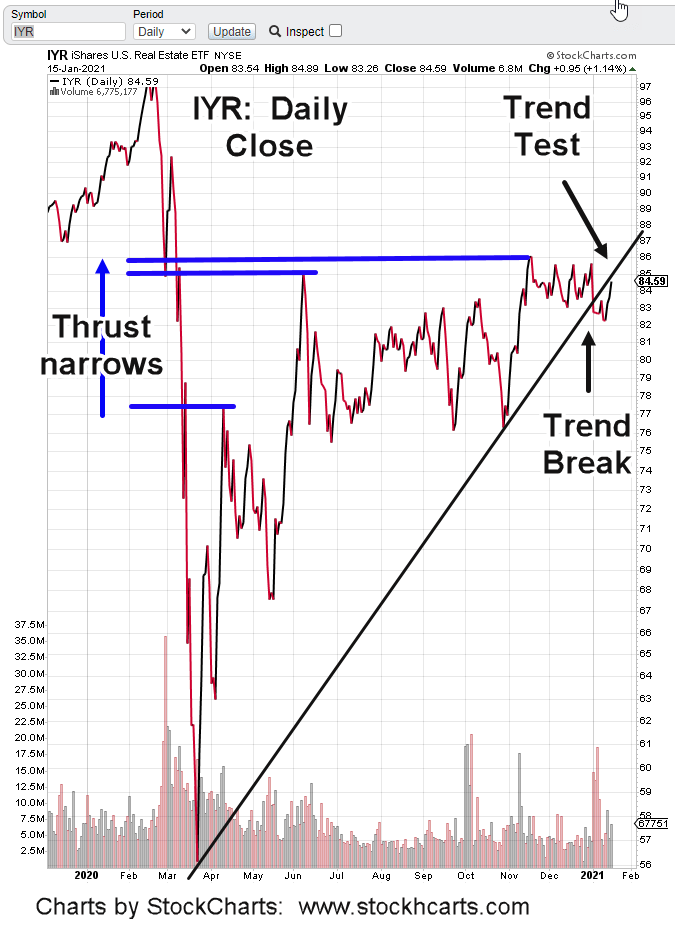
Other areas of the market are performing better on the downside. Real estate IYR, looks like it may post a narrow range day (as of mid-session).
It’s typical action when at support. If there’s no break lower today, then IYR could make an attempt higher at the next session.
Based on previous analysis, that attempt (if it occurs) is expected to be short lived.
Charts by StockCharts