Note: Posts on this site are for education purposes only. They provide one firm’s insight on the markets. Not investment advice. See additional disclaimer here.
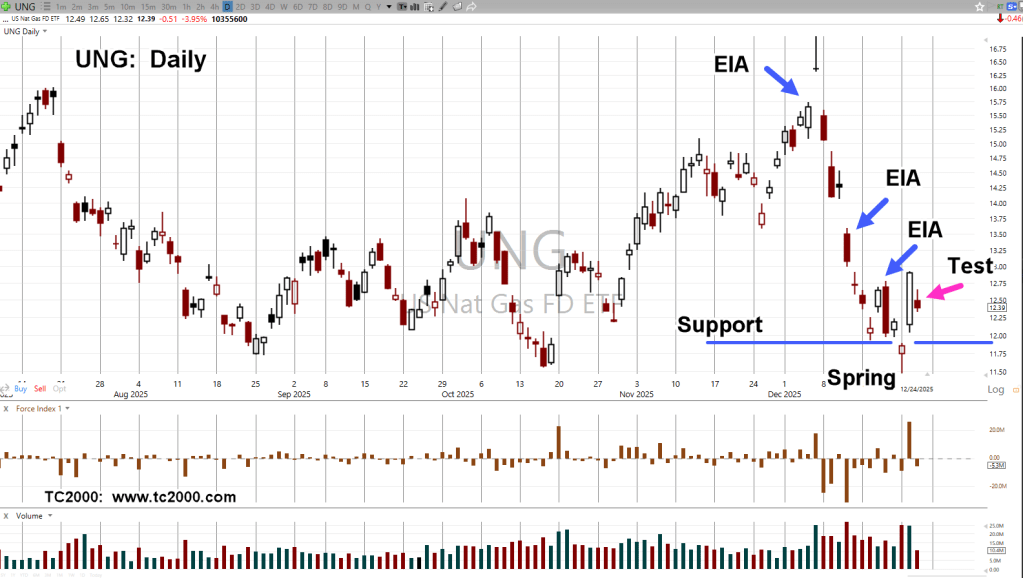
“However, tomorrow is the next release of EIA and potential test. Sometimes it’s brutal, other times it’s not there.“
Moving on a month or so, we can see that type of ‘brutal’ decline; -32.5%, (top to bottom) before price recovered.
Natural Gas UNG, Daily
Nat-Gas (UNG) has penetrated support, rebounded, and now (Wednesday), was testing that action.
It’s important to note, the previous spring set-up (here) resulted in a rally, lasting about six weeks.
Also note:
That rally was somewhat choppy and overlapping which would suggest if we do get another sustained rally, price action may alternate from the last rally’s form (not advice, not a recommendation).
Note: Posts on this site are for education purposes only. They provide one firm’s insight on the markets. Not investment advice. See additional disclaimer here.
Note: Posts on this site are for education purposes only. They provide one firm’s insight on the markets. Not investment advice. See additional disclaimer here.
Who knows what type of ‘weather’ we’ll have this time.
So, nat-gas can’t go any lower than where it is now, right?
Wrong
That type of thinking’s called a ‘Mind Trap’, link here.
David Weis would typically start mentoring sessions with a question (after presenting a chart):
“What do you see?”
Forgetting all the factors that ‘should’ drive the price of nat-gas higher, we have the chart.
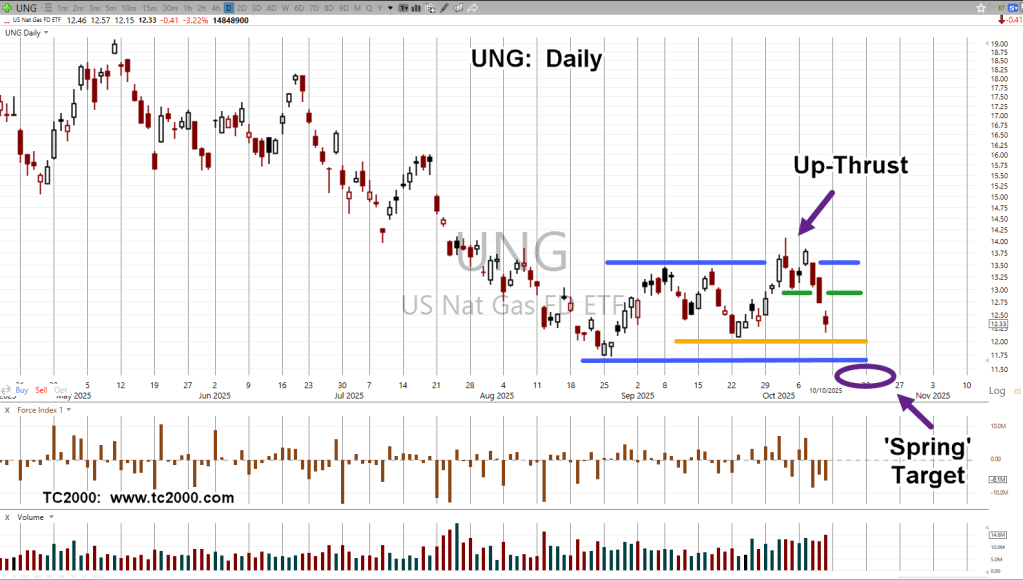
Natural Gas ETF, UNG: Daily
The upper blue line is resistance which price action ‘up-thrusted’ (reversed).
The green line is a minor support area.
This is where a long position was initiated (UNG-25-01). The expectation for the next day (last Friday), was for an immediate increase it price.
That didn’t happen. The long position, the only ‘long’ for this year, was exited (not advice, not a recommendation).
The orange line is another support area but the lower blue line, if UNG gets there, is the ‘spring’ set-up target.
U.S & China Nat-Gas
Last Friday’s chaos with China and tariffs, begs the question if Chinese nat-gas shipments would be used as a tit-for-tat pawn; meaning, China halts all purchases.
The short answer is no.
For all of 2025, there’ve been no shipments, link here.
With that said, if nat-gas is going to move lower to the target area shown, then something else would be the driving mechanism.
Note: Posts on this site are for education purposes only. They provide one firm’s insight on the markets. Not investment advice. See additional disclaimer here.
Note: Posts on this site are for education purposes only. They provide one firm’s insight on the markets. Not investment advice. See additional disclaimer here.
Note: Posts on this site are for education purposes only. They provide one firm’s insight on the markets. Not investment advice. See additional disclaimer here.
Going back to this post, one reason given for continued lower prices in Nat-Gas, was the high price of oil: with Nat-Gas being a by-product of oil production.
Since that post, oil prices (USO) have dropped, and Nat-gas prices are on the rise.
Natural Gas UNG, Daily
The two dashed black lines are trend and channel.
There’s also a ‘W’ bottom formed; if broken to the upside, targets the ‘Measured Move’ as shown (not advice, not a recommendation).
Note: Posts on this site are for education purposes only. They provide one firm’s insight on the markets. Not investment advice. See additional disclaimer here.
Insane, delusional valuations, high interest rates, no rate cut.
What could go wrong?
Visitors to this site already knew that ‘something’s up’.
Fully documented well in advance of today, was the A.I. bubble reversal, silver reversal, biotech reversal, and commodities like corn and Nat-Gas continuing their sustained decline.
Now the market hysteria is resulting in the typical knee-jerk, ‘flight to safety’ to the bond market (not advice, not a recommendation).
Surely, with all of that, the Fed will cut rates, right?
For the (potential) answer to that question, let’s look at the bond market.
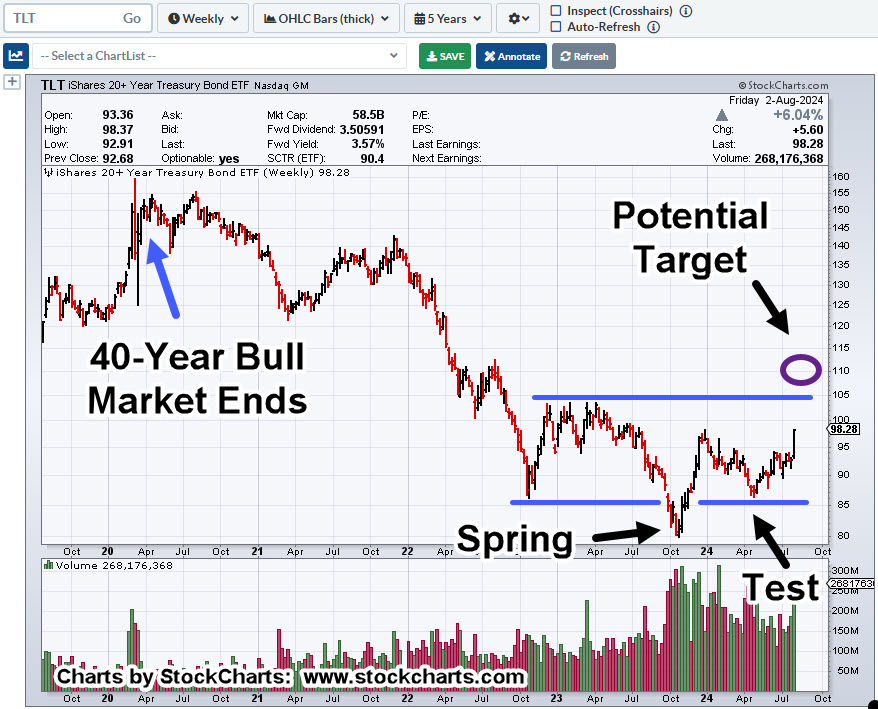
Long Bonds, TLT, Weekly
Already proposed on this site, the Fed does not lead the bond market and interest rates, it follows it (not advice, not a recommendation).
So, what’s this chart telling us?
If the market continues its decline in the coming weeks, TLT price action itself shows a potential for higher bond prices (lower yields).
We’re just over six-weeks away from the next Fed meeting.
Fed Follower?
If the Fed is still a follower, not a leader and if bond (TLT) prices reach the target just as the September meeting is held, then, one would expect a rate cut (not advice, not a recommendation).
Important to note, if TLT gets to the target area, it’s in Wyckoff Up-Thrust (potential reversal) position.
Economic Air-Pocket
If there is a rate cut as a result of the leading action of the bond market and then it reverses to the downside (rates higher), that’s when it would get real interesting.
Correction or crash; we may have to wait until September to find out (not advice, not a recommendation).
Note: Posts on this site are for education purposes only. They provide one firm’s insight on the markets. Not investment advice. See additional disclaimer here.
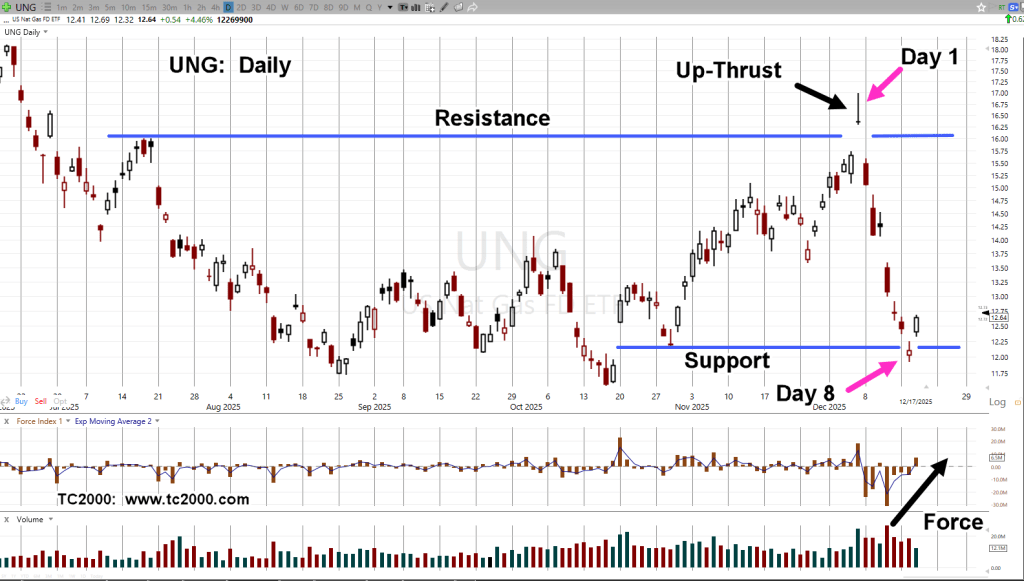
Price action detailed below, shows upside reversal (not advice, not a recommendation).
It’s been a while since the last update on Nat-Gas, UNG.
Since then, price action sliced through support (shown in the update), posting new lows.
However, over the past week, the character has changed.
Natural Gas, UNG, 3-Day
Today is ‘Day 3’, for the chart’s price bar; tomorrow’s action begins a new ‘3-Day’ bar.
At this juncture, the prior three-day move to new (daily) lows has been negated with today’s action.
If positioning long, the obvious stop level would be the low of the current three day bar at UNG 13.89 (not advice, not a recommendation).
Anything Can Happen
The past two weeks has shown us, in no uncertain terms, that anything can happen.
So, it is with the markets.
Nat-Gas has been bouncing around historical lows for some time; plenty of time to wear out any (remaining) bulls.
SOXX Housekeeping
While under no obligation to discuss open (or closed) trades, as a courtesy, today’s price action forced closure of SOXX short trade; SOXS-24-12
Total profit on the trade, having twelve separate entries and one exit (today) was just over 19%.
We’re potentially at the top of the largest mania in history save the South Sea, expecting things to go in a straight line is (apparently) not realistic. 🙂
Note: Posts on this site are for education purposes only. They provide one firm’s insight on the markets. Not investment advice. See additional disclaimer here.
Before we get to that, let’s first be aware of what’s being presented to the public. This recent link, says that upon increase in production, ‘go short’ (absolutely, definitely, not advice, not a recommendation).
So, the advice is, somehow tie the fundamentals to a trading action?
Given that going short on increase of production would even work (I wouldn’t do it), how is anyone going to figure out whether those numbers are real?
So, we choose not to play the game and instead, go straight to the truth, price action.
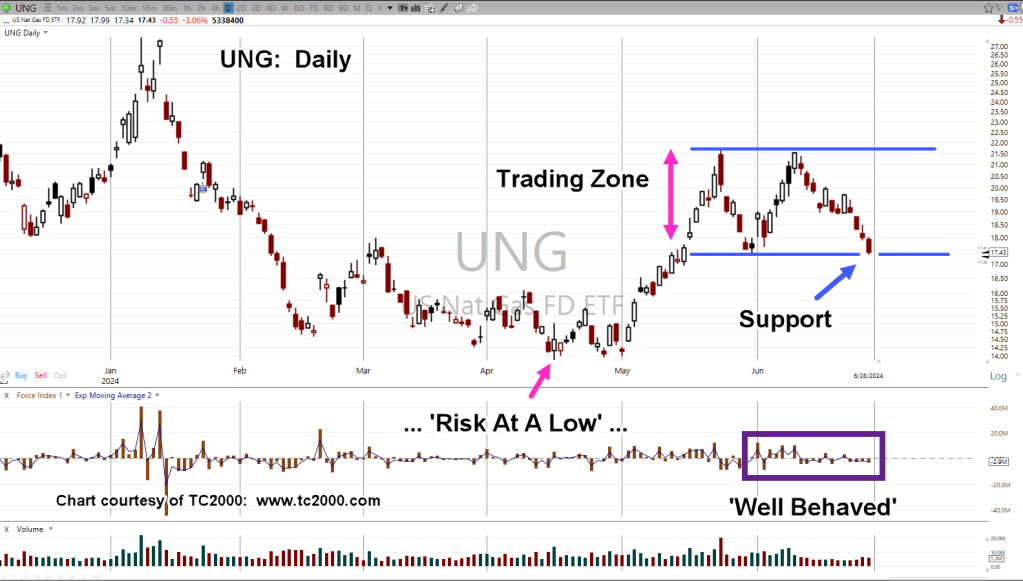
Nat-Gas UNG, Daily
First, it’s important to note the ‘Risk At A Low’, area.
Note: Posts on this site are for education purposes only. They provide one firm’s insight on the markets. Not investment advice. See additional disclaimer here.