Straight Talk On Gold

The Air’s Going Out

It’s time for the truth on gold and the miners.

Before we get to the charts, we’re going to start with an unlikely source:

Dr. Vernon Coleman

His latest video post is here; it’s important to watch in its entirety.

At time stamp 13:30, in the link, he says that restrictions are backing off, not because of any real change of conditions; no, they’re backing off to clear room for the next scam.

Useful Idiots

For obvious lies to have any effect, one has to have a whole pack of idiots to believe them.

The last post showed with the anecdotal ‘Target’ update, of that, there is no shortage.

So how does one think a dirty, dangerous mining operation is going to be functional with an ever declining or impaired workforce coupled with a potential ‘climate lockdown’?

Let’s not forget, these operations are also working to solve problems that don’t exist (i.e. ‘sustainability’ and ‘net zero’).

Was it like this in 1929 ?

The latest post from Economic Ninja, talks about the market becoming more “narrow” … which is just an alternate term for “thinning-out”.

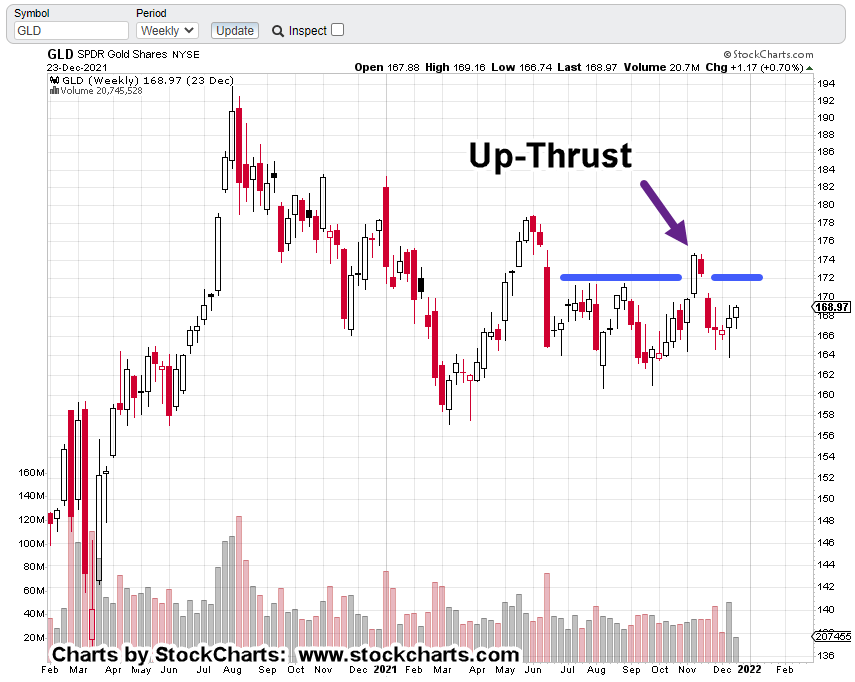
All of this brings us to the market at hand: Gold and the miners.

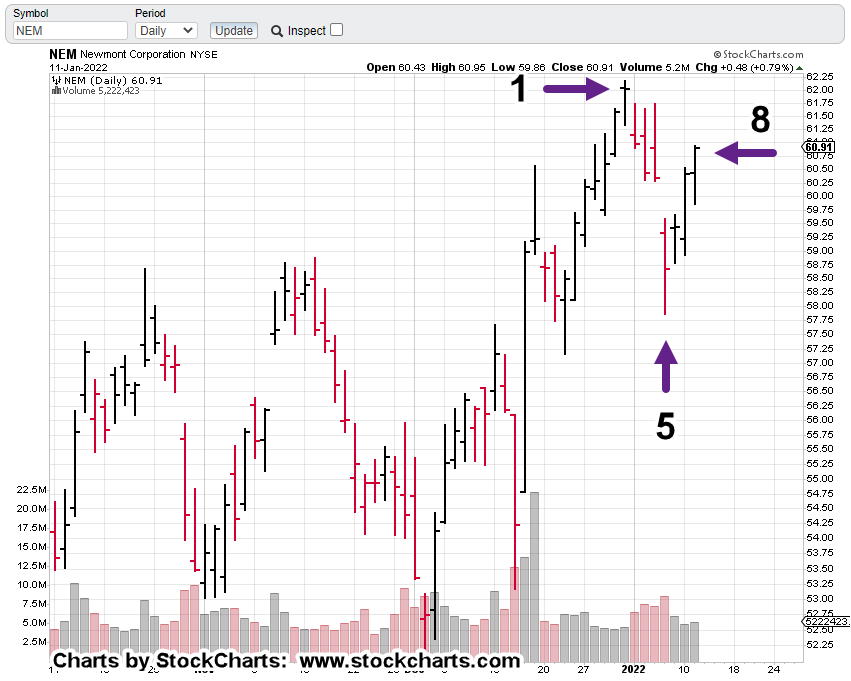
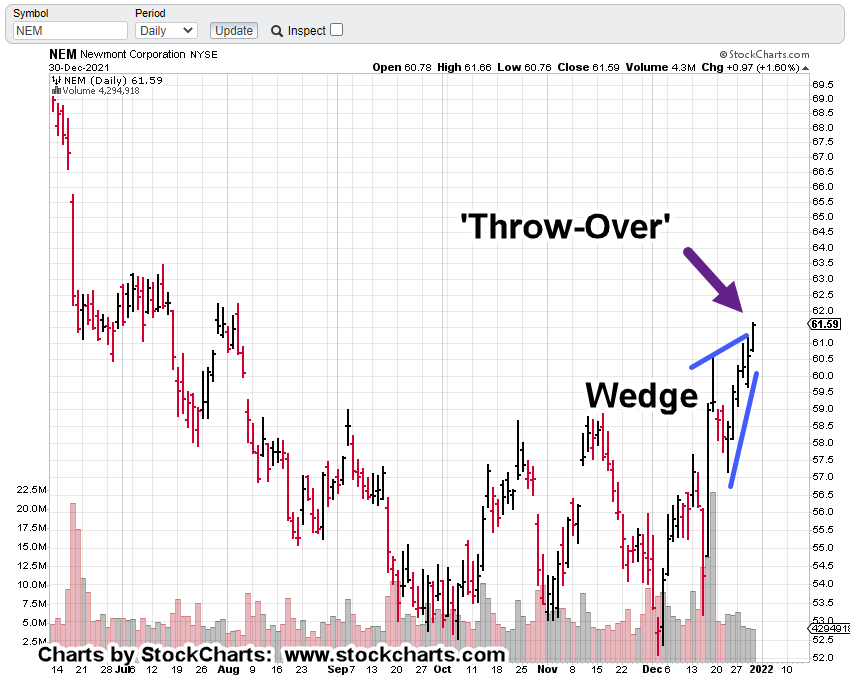
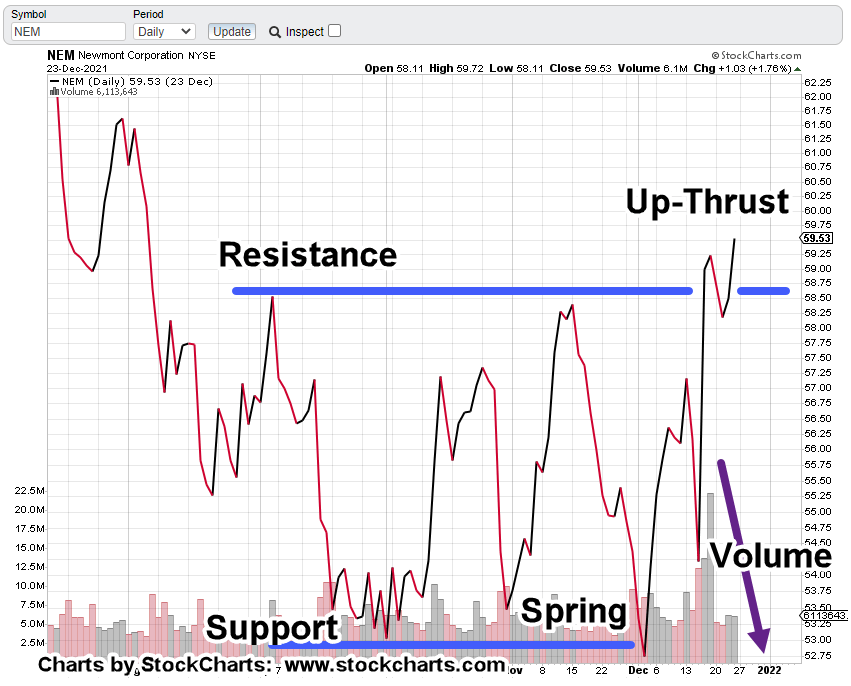
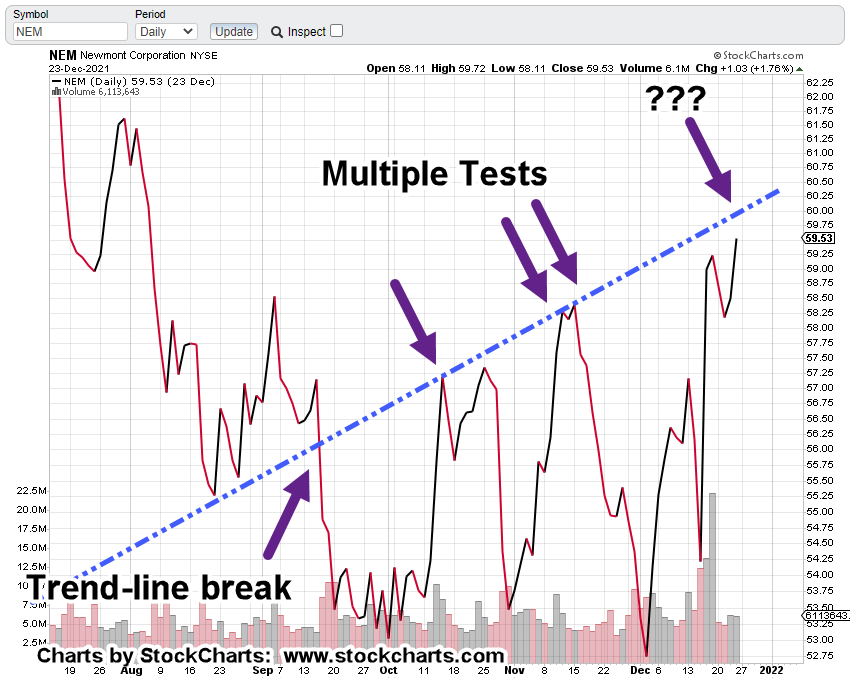
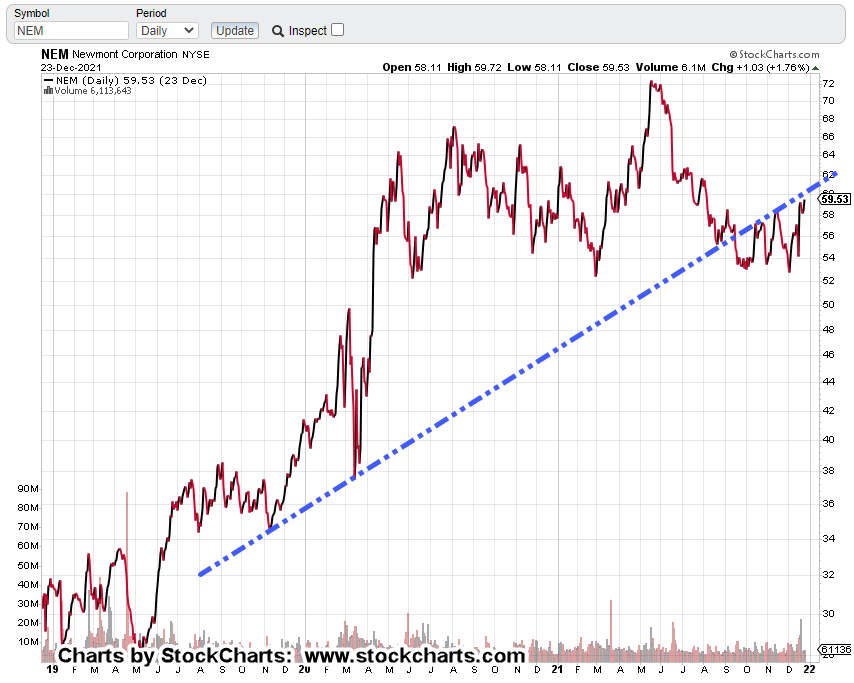
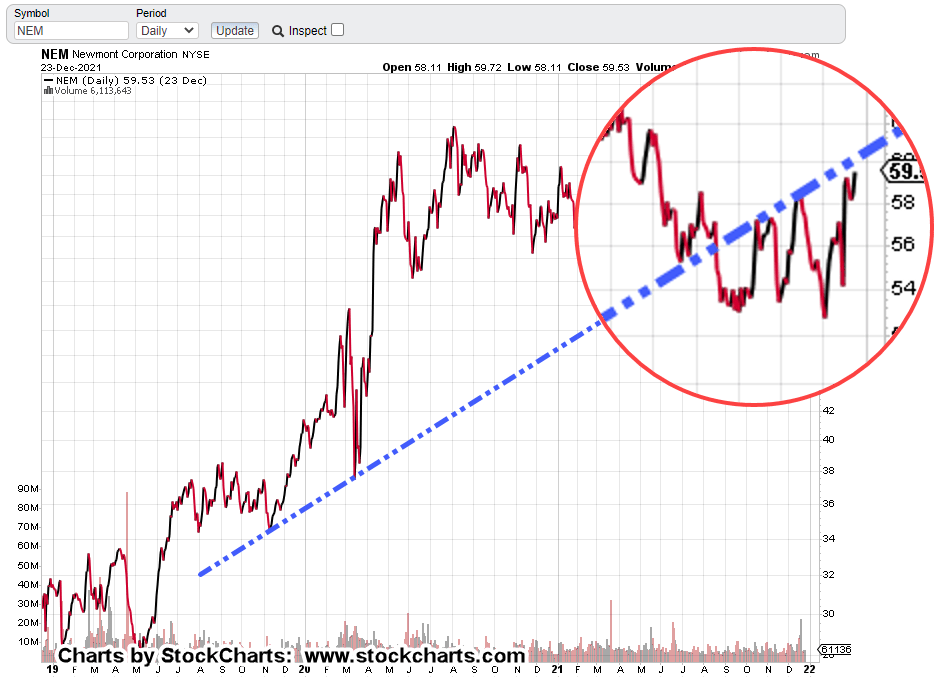
Newmont Mining (NEM):

We’ll go straight to the inverted daily chart of NEM:

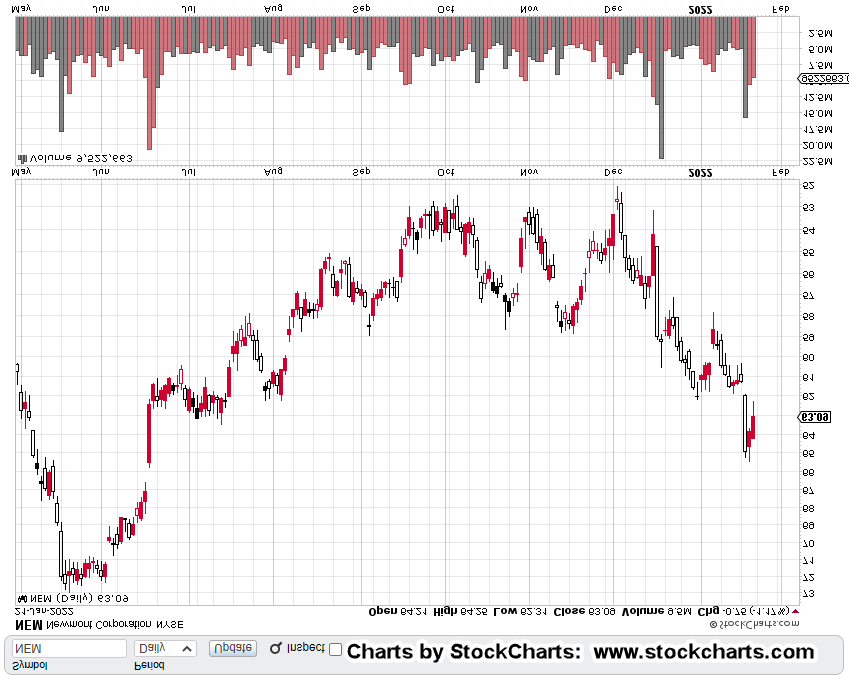
This prior post did an excellent job showing the potential bearish reversal conditions for NEM.

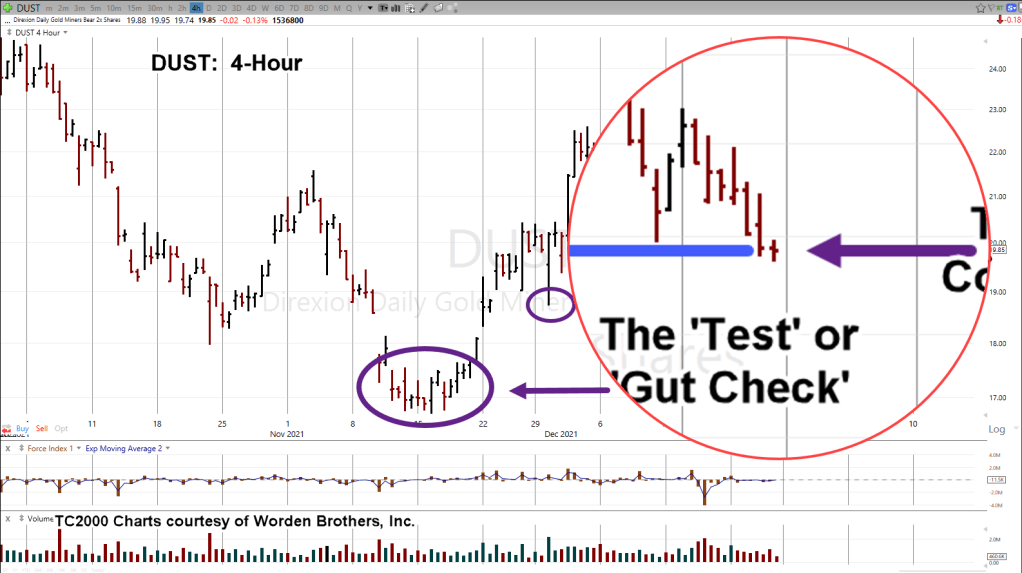
However, there’s at least one more bearish condition and that is, ‘up-thrust’.

Remember, that if it’s ‘up-thrust’ on the regular chart, it becomes ‘spring’ on the inverted.

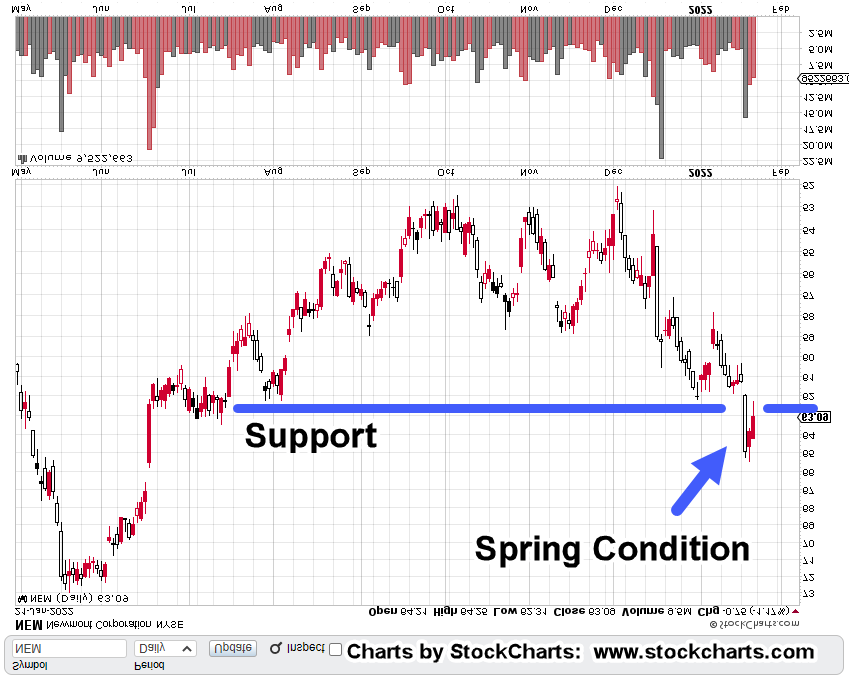
The zoom chart below shows price action has come back to test support quickly; an indication the downside thrust cleared out the weak hands and allowed strong hands to take positions.

We’re talking ‘inverted’ here.

So, what’s likely happened in the real (non-inverted) world:

The herd has bought into the inflation narrative.

They think Newmont, the miners and the gold market, are breaking out to the upside. Meanwhile, back at the ranch, the professionals have likely used the opportunity to sell or sell-short.

Back In The Day

Way back in the day, when Steven Van Metre, still had his 1970s wood-paneled office, he used to talk about how the Fed knows its actions are deflationary.

Also, how the Fed was in no way going to educate the public; so, they let that public believe that it’s all about inflation and dollar destruction.

The herd is nearly always on the wrong side of the trade. Here’s a blast from the past to help make that case.

Data Dump & Asset Transfer

With so many bits of data swirling around like Cryptos, Digital Dollar, UBI, Supply Chain Destruction, Depopulation, Neo Feudalism, and on, who of us in the proletariat, really know how it’s all going to play out?

However, there’s one thing of which, we can be sure:

It’s an asset transfer of Biblical proportion.

Next On The Schedule

This post is already long and we’ve not discussed the mining indices and downside projections.

Depending on price action or news, we’ll cover that in tomorrow’s update.

Stay Tuned

Charts by StockCharts

Note:  Posts on this site are for education purposes only.  They provide one firm’s insight on the markets.  Not investment advice.  See additional disclaimer here.

The Danger Point®, trade mark: No. 6,505,279

Miners … End of the Thinning ?

There are violent moves today in gold; both gold (GLD) and the miners, GDX.

One could think, maybe rightly so, the whole market, the miners, gold and silver, are kicking off a massive bull run.

On the surface, it looks that way.

Looking deeper, maybe not.

It could be a test of the November ’21, reversal.

Looking at charts of both Newmont and Senior Miners, GDX (we’ll cover gold tomorrow), the prior assessment, the market’s thinning-out applies even more.

Everything possible is being thrown into the last man standing: Newmont.

The violence of these moves is obvious.

Newmont (NEM) and GDX: Daily Charts

We’re going to put the unmarked chart of Newmont (NEM) and GDX directly below. The key takeaway is how far above NEM, is from its mid-November highs.

Then, look at GDX and note, it’s close but well below its mid-November highs.

This market (Senior Miners) continues to thin out … and it’s doing it violently.

Newmont (NEM):

Senior Miners, GDX:

Looking at the marked-up chart of GDX, it’s possible all of the action over the past two months, was to get into position to test the upthrust:

If an up-thrust “test” is the correct way to view this action, with gold (GLD) in a similar position, and if price action can’t hold these levels, the ensuing downside stands to be even more violent.

Run Fast, Or Not At All

Before the end of this session, DUST-21-01, will be reduced to be in compliance with margin requirements.

At mid-session, that reduction would be in the area of 12% of position size (not advice, not a recommendation).

Stay Tuned

Charts by StockCharts

Note:  Posts on this site are for education purposes only.  They provide one firm’s insight on the markets.  Not investment advice.  See additional disclaimer here.

The Danger Point®, trade mark: No. 6,505,279

Newmont: Fibonacci Count

Reversal Posting Fibonacci Sequence

In what seems to be a surreal exercise, waiting to see what’s going to happen next, Newmont (NEM), is posting Fibonacci counts in its nascent reversal (thus far).

The usual suspects are out on YouTube … touting the next bull move in gold and the miners.

However, the market itself is saying it’s not convinced.

This is another brief update to show Newmont has apparently reversed; posting Fibonacci counts on the initial downswing and what looks to be the upward test.

Newmont (NEM) Daily Chart With Fibonacci Count(s)

It’s up to the market itself to say today was the top of the reversal test … or something else is going on and we may indeed have the gold miners in the beginning stages of a bull move.

Stay Tuned

Charts by StockCharts

Note:  Posts on this site are for education purposes only.  They provide one firm’s insight on the markets.  Not investment advice.  See additional disclaimer here.

The Danger Point®, trade mark: No. 6,505,279

Time Tunnel … GDX

Rendezvous With The Future?

Are gold and the miners destined to collapse?

Are the miners on some choreographed mission to take out themselves, the gold bulls, and ‘stackers’ in one fell swoop?

At the bottom (if there is a bottom) will Newmont, be the sole-survivor or will some other mining entity emerge as the next leader?

Year 2022: When It All Hits

As Bjorn Bull-Hansen has suggested in this post, we’re potentially just months (maybe weeks) away from a mass-awakening.

That is, there’s no, or very little food.

What food there is, seems to get mysteriously wiped-out by some never-before-seen weather event.

It turns out that precious metals and the grains, i.e., wheat, soybean, and corn are at this juncture, inversely correlated.

Gold & Grains: Inverse Correlation

What kind of nonsense is this?

I thought we were supposed to be in a hyper-inflation event. I mean, the financial press is aghast about it. The YouTuber’s have jumped on and provided their own non-thinking “me too” assessment.

How can it possibly be any different?

The official narrative has been sanctioned by the press and YouTuber’s alike. It’s a consensus!!!

Let’s put it this way, if your (or my) favorite YouTuber is not being harassed, shut down or otherwise ‘cancelled’, are they really offering any useful information?

So, what gives?

How can gold, precious metals and the miners be inversely correlated with grains and/or corn?

Well, ok. Let’s take a look.

Below is an un-marked daily chart of gold proxy, GLD.

Can you pick out the ‘Derecho of 2020?

Let’s put in a big arrow showing when that crop-destroying inland hurricane (just before harvest … how convenient) showed up:

Below is a daily chart of tracking fund CORN; showing the correlation.

The markets in corn and gold never looked back.

Now we have this report from ice age farmer, just out. Trucking shipments between U.S. and Canada could be reduced by 15% or more.

As a result, food shipments are likely to be impacted starting this month.

Sustainable, Self-Implosion

If the negative correlation between gold and the grains wasn’t enough, we also have the controlled demolition of ‘sustainability‘ being put in place as well.

Tony Heller was part of the YouTube purge a few years back. He wound up being one of the first major hitters moving to NewTube.

Sporting no fewer than five science degrees … one of them being Master of Electrical Engineering from Rice University, he has systematically dismantled the propaganda and cult of climate change.

As with our second link above (repeated here) the only climate change of note, is the one being sprayed in. 🙂

So, most if not all major corporations are implementing plans, that by definition (unless reversed) will ultimately result in their own collapse.

After all, if you’re implementing plans and actions to address something that’s not there, what are you doing about any real tangible problems in the company?

Back to the topic at hand.

Senior Miners, GDX.

As stated in the first paragraphs above, GDX seems to be on some kind of time-tunnel mission.

Yesterday, it was shown how GDX is in a huge trading channel … with Friday’s price action potentially confirming the right side.

Next up, scheduled for tomorrow are specific and repeating Fibonacci time correlations between GDX inflection points and channel widths.

Stay Tuned

Charts by StockCharts

Note:  Posts on this site are for education purposes only.  They provide one firm’s insight on the markets.  Not investment advice.  See additional disclaimer here.

The Danger Point®, trade mark: No. 6,505,279

The Chart Speaks …

Massive Trading Channel In GDX

The past week has been a frustrating one being short the gold market.

Is the current trade, DUST-21-01, in a correction or an outright reversal?

It’s in the green (not advice, not a recommendation) but seems like it’s taking forever to get moving.

Paraphrasing Dr. Elder; He says ‘when in doubt, pull out (or farther out).’

So, we’re going to do just that.

Senior Miners, GDX

The un-marked daily chart is below. The second one is the same but inverted (to approximate inverse fund DUST).

Inverted

From the blank charts, it’s not immediately obvious.

However, the chart below shows GDX in a massive trading channel.

On top of that, today (Friday) may have been contact and verification of the right-side channel line. We won’t know for sure, until next week.

There’re about nine-months of trading action which also includes the two months to create the up-thrust set-up.

Sitting Back

If you sit back and take it all in, one begins to realize the enormity of what’s going on.

The up-thrust set-up was formed in two months. The channel itself, the bigger picture is nearly a year of price action.

From the inverted chart, the spike (downward) December 15th to now, is when the market thinned-out.

That’s when based on the data, funds flowed out of the senior miners and (some of it) into the last man standing; Newmont (NEM).

The stage is set.

Summary

Trades can fail. Anything can happen. That’s a given in the markets.

However, it looks like GDX is at another critical juncture.

Stay Tuned

Charts by StockCharts

Note:  Posts on this site are for education purposes only.  They provide one firm’s insight on the markets.  Not investment advice.  See additional disclaimer here.

The Danger Point®, trade mark: No. 6,505,279

And Then, There Was One …

Newmont Pushes To Extreme

When a profitable position begins to erode, the questions begin.

Is it just a correction or a full-blown reversal; how do you know?

Of course, nothing is ever known for absolute sure.

However, in the case of the current trade DUST-21-01, which is a short position on GDX (not advice not a recommendation), the market’s exhibiting what looks like terminal (reversal) behavior.

Of all the thirty-one equities in the Senior Miners GDX, only one is above its mid-November highs: Newmont Mining.

Newmont, NEM

With Newmont getting all the attention, the view is the entire market is ‘thinning-out’.

In addition, price action in Newmont tends to suggest it’s exhibiting terminal behavior.

Daily chart below.

It looks like NEM has just ‘thrown-over’ its wedge pattern. Typically, the last gasp before reversal.

Zooming-in

Summary

With markets reaching new all-time highs yet again, the gold miners are showing they’re not invited to the party.

From a Wyckoff standpoint and for bear markets, the focus is on the laggards … not the ones at the top (not advice, not a recommendation).

Unless the dynamic of GDX changes, and others in the index push past their mid-November highs, this market continues to look ready for reversal.

Stay Tuned

Charts by StockCharts

Note:  Posts on this site are for education purposes only.  They provide one firm’s insight on the markets.  Not investment advice.  See additional disclaimer here.

The Danger Point®, trade mark: No. 6,505,279

Newmont … Final Test ?

Newmont Edges Higher

Newmont continued to edge higher and posted a 1.09% gain for the session.

The rest of the sector, GDX barely moved at 0.10% gain.

The discrepancy suggests the market continues to thin-out; funds exit the lower caps and are funneled into the only equity that’s above its mid-November highs; NEM.

Stay Tuned

Charts by StockCharts

Note:  Posts on this site are for education purposes only.  They provide one firm’s insight on the markets.  Not investment advice.  See additional disclaimer here.

The Danger Point®, trade mark: No. 6,505,279

.

Newmont: At The Crossroads

Time To Decide

In the markets, sometimes a decision is quick. Sometimes, it takes days or longer.

Back in mid-November, it took eight days above resistance before the market decided enough gold bulls had been trapped; then headed lower.

As we’ll see below, we’re at another decision point.

Newmont (NEM) Daily Close

The un-marked chart gives the impression that Newmont’s headed higher. It even looks like there’s been a test of its breakout above the 58.00 area.

Let’s start marking-up this chart Wyckoff style to see what’s really happening.

For sure, price action has pushed above the 58.00-level.

In so doing, its gone from ‘Spring to Up-thrust’; a potentially bearish (reversal) set-up.

Adding to a bearish view, volume has declined significantly.

However, that’s not all. We’ve got some kind of trendline break with multiple tests as well.

Pulling farther out, we see that trendline has been around for some time.

Getting closer-in on that longer term chart shows the congestion of testing action.

Summary:

Newmont’s got itself into an up-thrust (potential reversal) while testing the underside trendline.

That trendline goes all the way back to late 2019.

Out of thirty-one (31) equities in the GDX, only Newmont’s at its mid-November highs.

All others are lower.

This market’s thinning-out.

Unless the dynamic changes, money is exiting the lower cap equities completely and/or, being pumped into Newmont; a classic bearish harbinger.

Obviously, this can go on for a while.

However, Newmont’s already at the crossroads; Underside test and up-thrust.

Stay Tuned

Charts by StockCharts

Note:  Posts on this site are for education purposes only.  They provide one firm’s insight on the markets.  Not investment advice.  See additional disclaimer here.

The Danger Point®, trade mark: No. 6,505,279

Talking Turkey

Lessons From Mr. Partridge

From Reminiscences of a Stock Operator, ‘Turkey’, aka Mr. Partridge, was much older than the rest.

The rumor in the broker’s office was that he was rich.

Even so, he was not contributing to heavy commissions (i.e. day and swing trading) as far as Livermore could tell.

The other thing was, that he never offered advice.

If a stock tip worked out, he would thank the tipster … if not, you never knew if he took a position or not.

Losing The Position & Psychological Impact

Turkey’s ‘losing the position’ remarks impacted Livermore the most. He recognized that Partridge wasn’t some old duffer; he was an astute speculator.

Losing the position: Not the same as holding a loser.

Maintaining a profitable position during a correction while at the same time, recognizing a big move could be in the works, requires (mental) strength; let the market itself say when to get in and out.

This link has Prechter’s ‘missing out’ story on big gains.

Continuing on with Turkey.

In the book, he said he ‘paid a high price for his tuition’ and does not want to incur a second fee.

Attempting to ‘play’ the market in and out then repeat, by definition, leaves one out of the big move.

It’s not the move itself; it’s the recognition that fiddling with the position and losing it, has resulted in a lost opportunity that will never come back.

The psychological damage is immense.

It’s worse than taking major loss. Watching a move take off without you when you had planned for months (or years) for the set-up, may have left no way to recover.

Which brings us to the market at hand.

Gold (GLD):

This site is not advice, and it does not make market ‘calls’.

Presented here, are posts documenting how Wyckoff analysis is being used to spot market set-ups.

Those set-ups have shown themselves over time to be potentially profitable (not advice, not a recommendation).

The weekly chart of gold (GLD) shows the up-thrust that was months in the making.

We’re going to invert the chart and so, the ‘up-thrust’ now becomes a ‘spring’.

Note:

Back in the day, when I wasted time posting on SeekingAlpha, I would get numerous complaints about ‘inverting the chart’.

They wanted it spoon-fed and did not have the mental plasticity to look at situations from the opposite perspective.

The ‘inverting the chart’ came from none other than Dr. Elder, himself … discussed in Trading For A Living or Come Into My Trading Room if memory serves.

The main interest on the ‘Alpha’ site seems to be pontificating about how sharp your pencil is; how close you can come to guess what earnings (or some other meaningless fundamental) will be at the next release.

I have not been back in years … they’re probably out there still arguing … only this time, the banter may be about which “masks” are most effective. 🙂

But I digress.

Months To ‘Spring’, Weeks To ‘Test’:

The inverted chart of GLD shows it took months for price action to penetrate support and create a spring condition.

Since then, we’ve had a move higher and now lower coming back near support.

Is this a test or a failure of the move?

It was a short week. However, it may still provide actionable data. For example, range of GLD, GDX and NEM, all narrowed. Volume contracted as well.

The inference is, thrust energy is weakening and thus weights the probabilities to a ‘test’ and not a ‘failure’.

Deflation Pivot:

Interestingly, we’re starting the see the consumer has finally reached the limit of their spending. Price are staring to edge lower as reported here and here by Economic Ninja.

Another data point, a bit esoteric, is ammunition. Pices are starting to taper off as well. Most notable is 22-LR.

A couple of months ago, 22-LR was about 0.10 per round (bullet). Looking at this site, we see the cheapest price has dropped to .080/round.

That does not look like much but it’s a 20% decline.

Summary:

Everyone has their own time frame and market approach.

Taking a cue from Turkey, referenced above, I would rather sit through a correction, incur the erosion of profit than exit and ‘click my heels’ as Prechter puts it; then watch the original position move for a huge gain without me aboard (not advice, not a recommendation).

We’re likely to find out very soon if this is a major pivot lower or if somehow, gold (GLD) bulls gain control and drive prices higher.

Stay Tuned

Charts by StockCharts

Note:  Posts on this site are for education purposes only.  They provide one firm’s insight on the markets.  Not investment advice.  See additional disclaimer here.

The Danger Point®, trade mark: No. 6,505,279

Another Gold “Blip”

More ‘Inflation’

Gold Does Nothing

Another ‘maximum inflation‘ story, another non-confirmation in gold.

If that weren’t enough, look who’s out pounding the pavement (again) on inflation.

The press itself, possibly unbeknownst to them, is helping to destroy the (monetary) inflation narrative.

Or at least, revealing we’re actually in the middle of something that’s not quite understood by us in the proletariat.

If monetary inflation really was that rampant (an opinion), gold and other precious metals would be in a screaming bull market … manipulation or not.

That hyper bull market has not and is not happening.

However, what is happening, and what continues to happen, are scenes like thisand this

Let’s move on to the charts.

Newmont (NEM) will be analyzed over the weekend. For now, we’ll use GDX, leveraged inverse fund DUST.

GDX, Inverse DUST (4-Hour)

The first two trade points are clear. The ‘set-up’ and the ‘gut check’.

Whether or not we’re completing the first correction won’t be known until price action at least makes a new daily high, above today’s DUST: 20.45.

The zoom chart below, helps show DUST, is penetrating support … now in spring position.

Obviously, stating the first correction as ‘complete’ was premature.

However, if we are going to see a continued downtrend in GDX and uptrend in DUST, the chart above looks like today’s action is a good area for pivot/reversal.

With today’s screaming 40-year inflation news (first link, above) all gold could do (as of this post) in the futures market, was a meagre 0.43% blip higher.

Stay Tuned

Note:  Posts on this site are for education purposes only.  They provide one firm’s insight on the markets.  Not investment advice.  See additional disclaimer here.

The Danger Point®, trade mark: No. 6,505,279