Real Estate … One More Time

A long time ago in an interview whose source is long forgotten, the question was asked:

‘How many times do you attempt to enter a trade before giving up?’

Years ago as an amateur, I was shocked. I didn’t even know that several attempts could be made.

Was that even allowed?

I thought the ‘professionals’ were supposed to know the market. If they get stopped out, they must be some kind of (idiot or) shill.

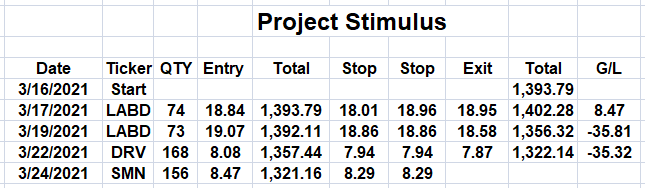
Well, you can make your own call on that one … as for the ‘project’, we’re re-positioned for one more time.

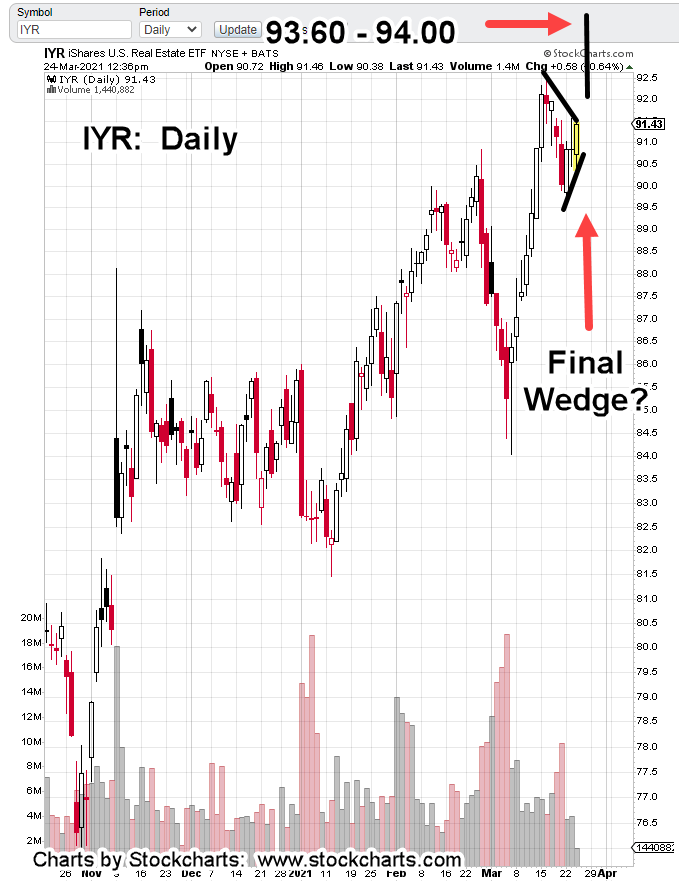
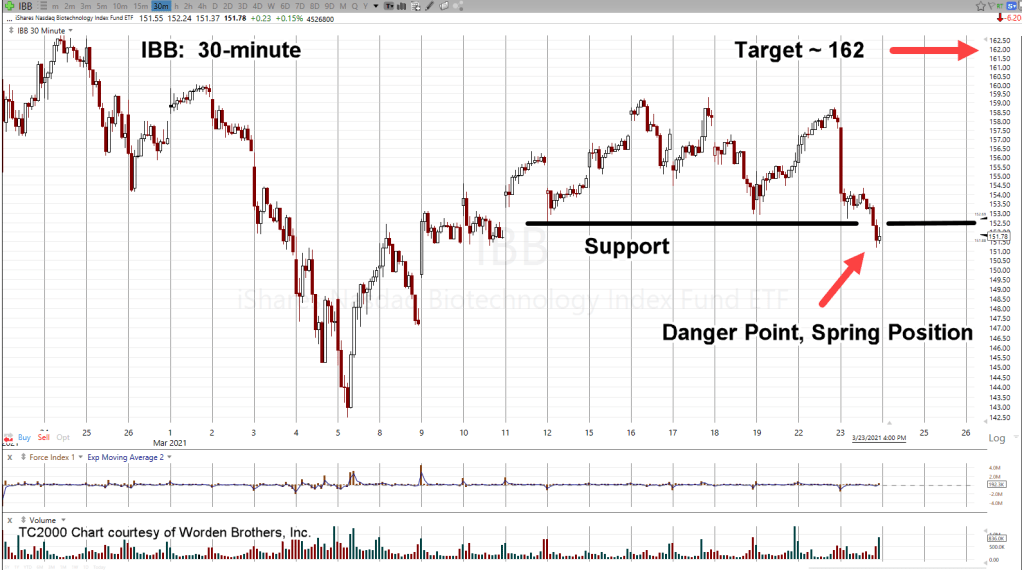
Monitoring price action throughout the day, it became obvious just before 3:00 pm; EST, that IYR was going to make a breakout push.

The DRV short was exited at 7.48 and then, we waited.

The upside breakout came just twenty minutes before the close (forty minutes after exiting). IYR pushed significantly higher while DRV went sharply lower.

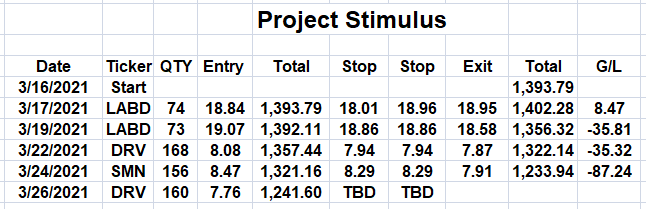
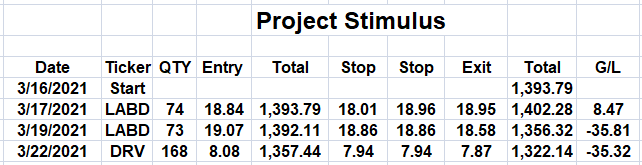
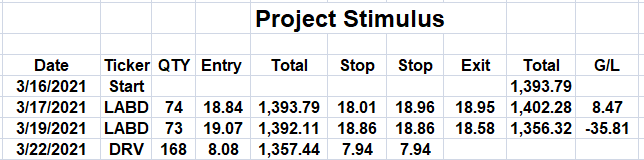
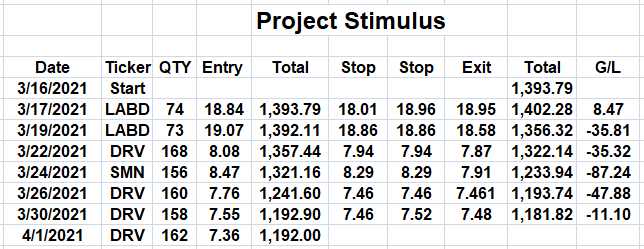
Ten minutes into the breakout, as IYR was still rising, DRV was re-entered at 7.358 (see table below).

Price action continued higher right into the close. DRV finished at 7.25.

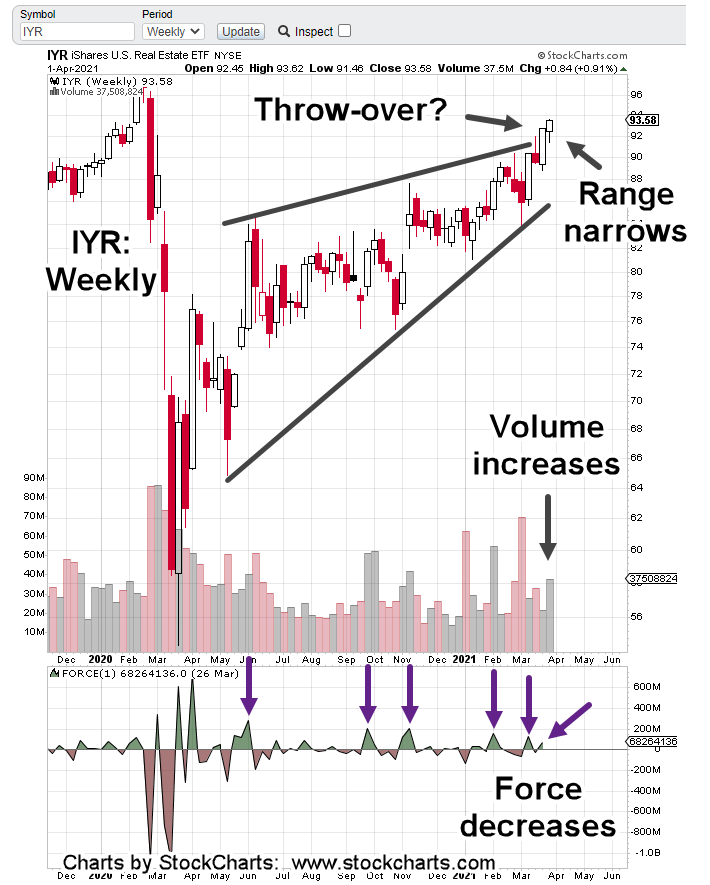
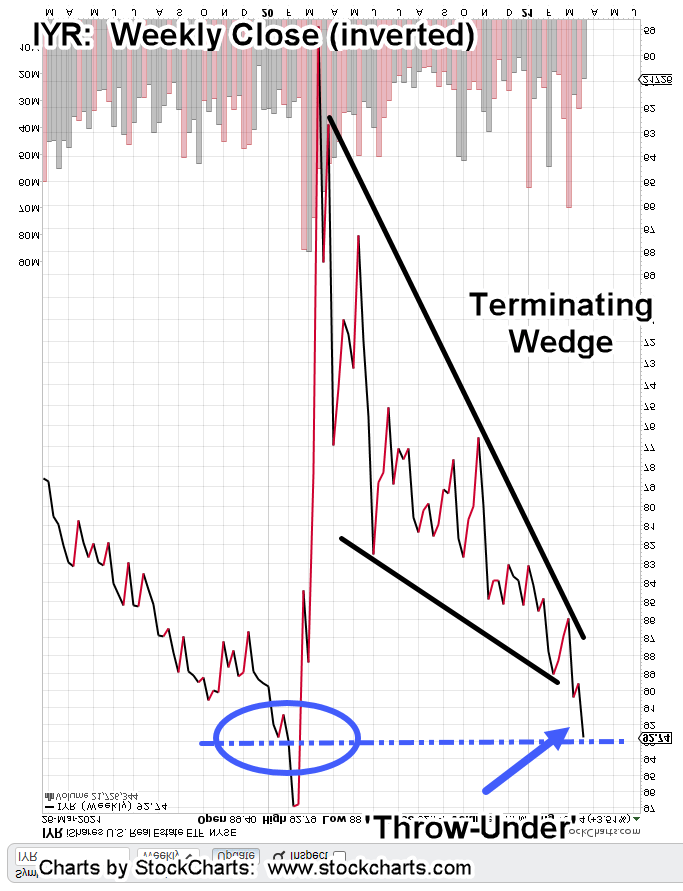
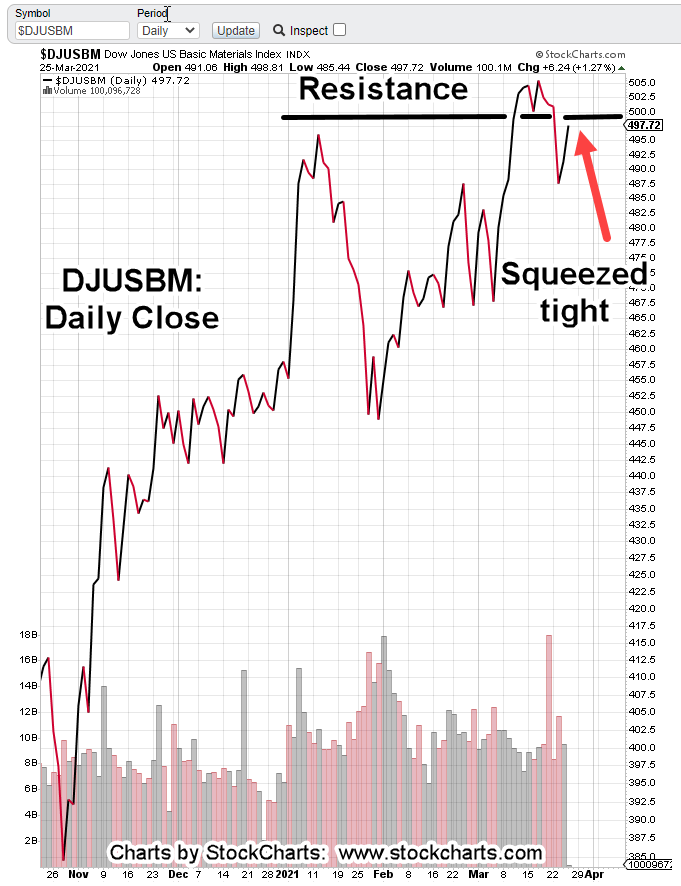
Looking at the weekly chart, the ‘throw-over’ looks terminal.

Price rose for the week but range was more narrow with volume (effort) up and force down.

The amount of volume needed to move price slightly higher increased significantly from the week prior.

Note: Each upside force (from start of the recovery) has declining energy.

For the week just ended, Force Index barely ticks higher while volume increased and range traveled decreased.

Wyckoff termed this “effort vs, result”. The bulls are tired.

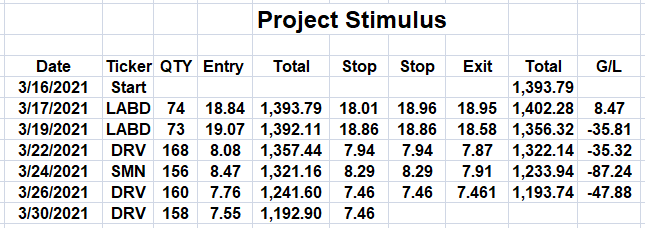
The table shows current status. We’ll decide on a stop (or exit) during the next session.

Charts by StockCharts

Note:  Posts on this site are for education purposes only.  They provide one firm’s insight on the markets.  Not investment advice.  See additional disclaimer here.

Real Estate: Prints and Fails

IYR made an unexpected print high; then failed to hold into the close.

The inverted chart of IYR puts it all in perspective.

It’s obvious we’re working the area of IYR, where medium to long term reversal is possible. The inverted chart shows how each successive thrust lower (blue lines) covered less net distance.

Instead of exiting out of DRV, then getting back in, the position was held with the expectation new IYR, print highs would not hold.

They didn’t.

Not only that, there was plenty of intra-day kabuki:

Early session lower, then reversal to new highs, then fail and lower close. Anything can happen but IYR’s upward action looks exhausted.

If IYR had maintained its new high into the close, DRV would have exited (not advice, not a recommendation).

Charts by StockCharts

Note:  Posts on this site are for education purposes only.  They provide one firm’s insight on the markets.  Not investment advice.  See additional disclaimer here.

What did … and did not happen

What happened: IYR pushed higher, DRV hit the stop.

What didn’t happen: IYR’s action higher, failed.

The hourly chart shows IYR pushing above the 92.50 level previously discussed.

Expectation was for a measured move higher … about 2 – 3 points.

As soon as price action penetrated the stop area, it reversed.

Shown above, is the re-entry (DRV) when IYR action posted an outside down hourly bar.

The chart below has more detail which indicates successive market rejections as price attempts to move higher

There are no guarantees. Some kind of demand could come in to move IYR higher.

However, based on the failed attempts to do so thus far, the market’s saying we’ve seen the highs for this cycle.

Note:  Posts on this site are for education purposes only.  They provide one firm’s insight on the markets.  Not investment advice.  See additional disclaimer here.

‘Project’ Update

The stop on our ‘Project Stimulus’ account was originally listed as “TBD”.

The market itself needed to define the stop. Now, it has.

The 4-Hour chart of IYR shows a wedge pattern that’s right at resistance. The early session is over and posted a narrow red bar.

We’re just into the second half; price action is inching up.

If IYR gets above the inter-session high of 92.50, it’s likely to make one last push higher into a measured move.

We’re short via DRV (not advice, not a recommendation) so we don’t want to be around if that happens.

The Project table has been updated with an approximate location for a DRV stop:

Note:  Posts on this site are for education purposes only.  They provide one firm’s insight on the markets.  Not investment advice.  See additional disclaimer here.

Early or Late?

It may have been Robert Prechter Jr. that said years ago;

‘You’re either going to be early, or late’

He then went on to say his trading method usually puts him in a little early on the move.

That means there are times when the anticipated direction does not materialize.

So, your either suffering through the pain of anticipated reversal (for seconds, minutes, or days), or you’re chasing the market.

You make the call.

There really is no other choice.

Both methods involve psychological pain.

Referring back to Prechter, he also said some of the best traders he knew were former Marines. By definition, they are well trained to deal with pain.

My former mentor, the late David Weis would say after hit on a set-up, if conditions warranted, he would enter again; as he told me, he would ‘stick his chin out’ and effectively tell the market to ‘prove him wrong’.

It was an interesting choice of words for him as one can see from his training video …. he had a distinctive chin.

Trading Style:

The trading style presented on this site is a combination of Wyckoff tape reading coupled with anticipating price action.

As inferred above, that means there may (and will ) be times of draw-down while working to enter a market reversal.

That’s where we are now.

Trade Actions:

Yesterday’s upward action in basic materials forced the ‘project’ out of its short (SMN) position. That sector may attempt to make a new 52-week recovery high before it’s ready for reversal.

Analysis: Real Estate, IYR

One market that did make a new 52-week high, setting up technically for a short, is real estate:

The weekly close of IYR has been inverted (turned upside down) to show the unique technical condition.

IYR has created a large terminating wedge that’s in the process of a ‘throw-under’. At times a market will attempt to breakout of a wedge in the opposite direction of eventual reversal.

This type of breakout tends to fail. Based on the dashed line contacting a prior congestion, there’s’ potential to at least hesitate in this area.

The daily chart below provides additional nuance:

It’s clear price action has contacted two prior areas of support – resistance during ‘throw-under’.

Anything can happen but it seems that IYR’s at maximum extension.

On Friday, IYR price action closed just 0.05-points off its high for the day. That high was also a 52-week high.

We’re now in a support-resistance zone.

If IYR is to move significantly higher, it might need additional fuel (a retrace lower) to break through.

Positioning:

The action then (not advice, not a recommendation) was to short the market via DRV.

Once again, the market itself is telling us where to go for opportunity.

Charts by StockCharts

Note:  Posts on this site are for education purposes only.  They provide one firm’s insight on the markets.  Not investment advice.  See additional disclaimer here.

Dollar Rally

Wasn’t the dollar supposed to crash … go to zero … implode?

This is the flip side of the hyperinflation narrative.

Dollar implosion like hyperinflation, not happening.

Way back in 1921, Livermore said to Wyckoff that his assessment of the markets was, ‘it’s all about deception’.

Nothing has changed.

It’s in the best interests of those controlling the narrative to have as many as possible (always) on the wrong side of the trade.

We haven’t posted this link in a while … the video keeps getting deleted but re-appears every so often. This is how it really works … Period.

Note the date stamp on the comments. The video’s at least 13-years old and it’s still relevant today.

So, the dollar’s in a rally.

Not only that, momentum indicators, MACD, on the monthly, weekly, daily, all point higher. It’s in a rally and a sustainable one.

It’s completely opposite the accepted narrative.

You can feel the tensions building.

Bonds could be reversing but have already pushed rates high enough (long enough) to choke-off critical sectors of the economy like here and here.

Now we see the dollar has bottomed as well.

It looks like a strong multi-month (or year?) rally. Correspondingly, gold is weak. The overall markets are stretched to ever-livin’ extremes; never before seen.

Whenever this baby pops, try logging on to chaos, or exit any position (except maybe for the long bond).

Our approach then (not advice, not a recommendation), is continue work on positioning short. So far, the ‘project’ is taking small hits in those attempts. We’ll see how basic materials (SMN) works out today.

Stay Tuned

Charts by StockCharts

Note:  Posts on this site are for education purposes only.  They provide one firm’s insight on the markets.  Not investment advice.  See additional disclaimer here.

Squeezed Tight

Depending on how you look at it, it doesn’t get any better:

If a short position is going to fall apart, it won’t take much of a move.

Even though DJUSBM closed higher than yesterday, on a price action basis, the index subdivided lower; a lower high, lower low.

We’re maintaining our short position (not advice, not a recommendation).

Tomorrow’s action will likely show if that was a good move or not.

Charts by StockCharts

Note:  Posts on this site are for education purposes only.  They provide one firm’s insight on the markets.  Not investment advice.  See additional disclaimer here.

Basic Materials

Nobody’s paying attention to this index. It may be one of the cleanest (technical) short opportunities.

Basic Materials. Sounds boring.

Sounds like fertilizer … and it is … right along with industrial chemicals.

Three largest cap in the sector are below:

Industrial gasses, Linde AG

Industrial gasses and chemicals, Air Products & Chemicals

Water purification, Ecolab

DuPont is next and then Newmont mining. So, this is a potential deflation play (Newmont) as well.

A post just out yesterday, Uneducated Economist does an excellent job destroying the inflation narrative.

Steven Van Metre has also repeated many times, we’re likely to get a deflation impulse first before inflation.

One of the most important things he’s said, the Fed is not going to correct the public’s (false narrative) perception that inflation’s the danger.

If everyone’s pointed in the wrong direction, and it serves their interests, why correct it?

Which brings us back to Basic Materials. ‘Nobody’s watching’ this index. How do we know?

Look at the inverse fund, SMN.

Russell 2000 inverse, TZA, averages 6 – 10 million shares per day. Compare that to SMN’s 2,500 shares on a good day.

Volume does pick up as price action becomes active. Some days will be 100,000 – 200,000 shares.

Looking at the technical condition, there are bearish divergences on both daily and weekly time-frames. The chart at the top shows a Wyckoff up-thrust (reversal) condition just tested yesterday.

The response is to go short via SMN (not advice, not a recommendation).

Since we’re actively managing accounts throughout the day, it’s not a problem to monitor SMN and the bid/ask of the fund when trading is light.

The ‘project’ table has been updated:

Pre-market has SPY trading down about -1.5 points or -0.40%. The expectation is for Basic Materials to follow suit.

Stay Tuned

Charts by StockCharts

Note:  Posts on this site are for education purposes only.  They provide one firm’s insight on the markets.  Not investment advice.  See additional disclaimer here.

Real Estate Update

IYR may be heading into a wedge top. Breaking out just now.

We’re out of the short position and standing aside to see if IYR reaches the target area

Charts by StockCharts

Note:  Posts on this site are for education purposes only.  They provide one firm’s insight on the markets.  Not investment advice.  See additional disclaimer here.

Biotech Technical Discussion

Yesterday’s swift move lower in IBB looks like the start of the next leg down.

Update 10:34 a.m. EST in red below:

Closer inspection however, shows biotech could pivot and move to higher levels … if only temporarily.

We’re looking at the 30-minute chart of IBB. Yesterday’s action penetrated minor support and stopped dead.

When price action behaves in that manner, it puts the index in what Wyckoff called ‘spring position’ ready to move higher.

Then we have the wide 30-minute (red) bar from the session; likely to be tested. To do that, action needs to move higher.

The target area is near a 62% retrace of the entire down move from the high on February 10th, to the low on March 5th.

Note, yesterday was a Fibonacci Day 13, from that March low.

Even though IBB’s likely to move higher, we’re leaving it alone.

If action gets to the target, we’ll be ready to short (via LABD) if there’s opportunity.

Update:

It’s not called “The Danger Point” for nothing.

Price action penetrates deep below (minor) support effectively negating the ‘spring’ scenario discussed.

We’ve now penetrated below another support level

Price action can still spring upward from here … although probabilities appear to be fading.

Either way, we’re not interested in going long at historic valuations.

Separately, our ‘project’ has maintained short real estate via DRV (not advice not a recommendation), to be covered in a later update.

Stay Tuned

Note:  Posts on this site are for education purposes only.  They provide one firm’s insight on the markets.  Not investment advice.  See additional disclaimer here.