Finally, Inflation Shows Up

Its been nearly twelve years exactly since the market bottom of March 9th, 2009.

At that time gold tracking fund GLD, was trading around 90.

Today, it’s at 167, a gain of about 85%.

Gold futures for April ’21, closed this past Friday at 1,777.4

Either way, it’s a far cry from the $10,000/oz. that has been bandied about for what seems like forever.

Prices for energy and food are rising because of reasons not discussed in the financial media.

That media is certainly not going to educate the public.

In turn, that public has shown there’re certainly not going to educate themselves. If they were awake, news channel ratings (in the link) would be at zero.

Unfortunately, this time around, the game’s up.

The ongoing collapse will decimate those who refuse to wake up and will probably take some of those who are, with them.

Which brings us to the so called inflation, at hand.

What can be said? We can call it lies, misinformation, propaganda but none of those really get to the root.

Input prices are rising not from inflation, but from supply constriction and disruption.

For example, the corporate (big-Ag) food supply chain as reported on many times, is intentionally being destroyed. The result of course, prices go higher.

We’re also in a quiet sun-cycle period that only serves to help with (cold) weather extremes. The only discussion from the media concerning the weather is that’s it’s getting warmer, right? Opposite of reality.

So we’re taking that ‘opposite of reality’ as a contrary indicator.

Whatever inflation we’ve got after nearly twelve years, is probably at or near a peak … ready to head lower.

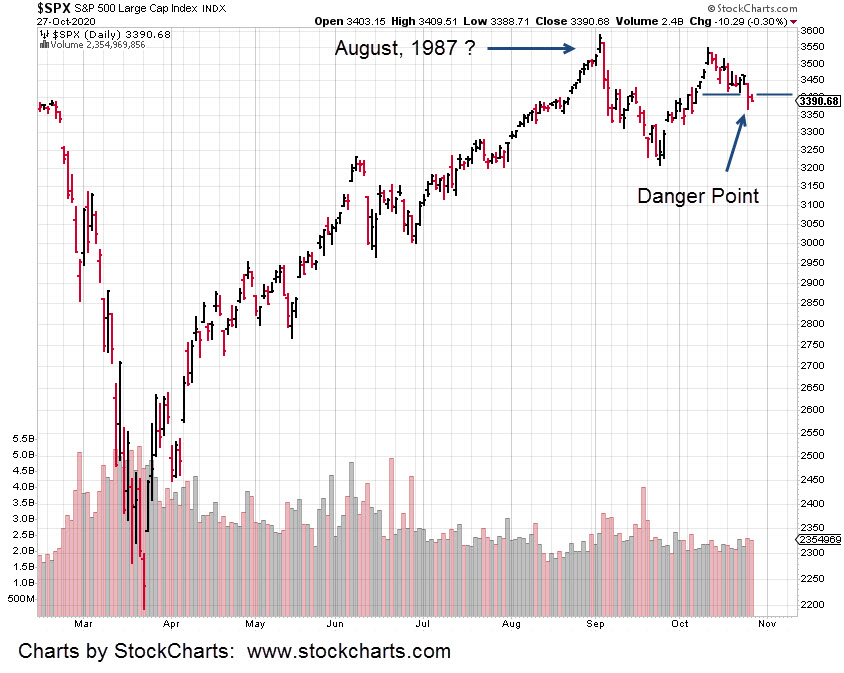
That includes the market as well. The likely outcome:

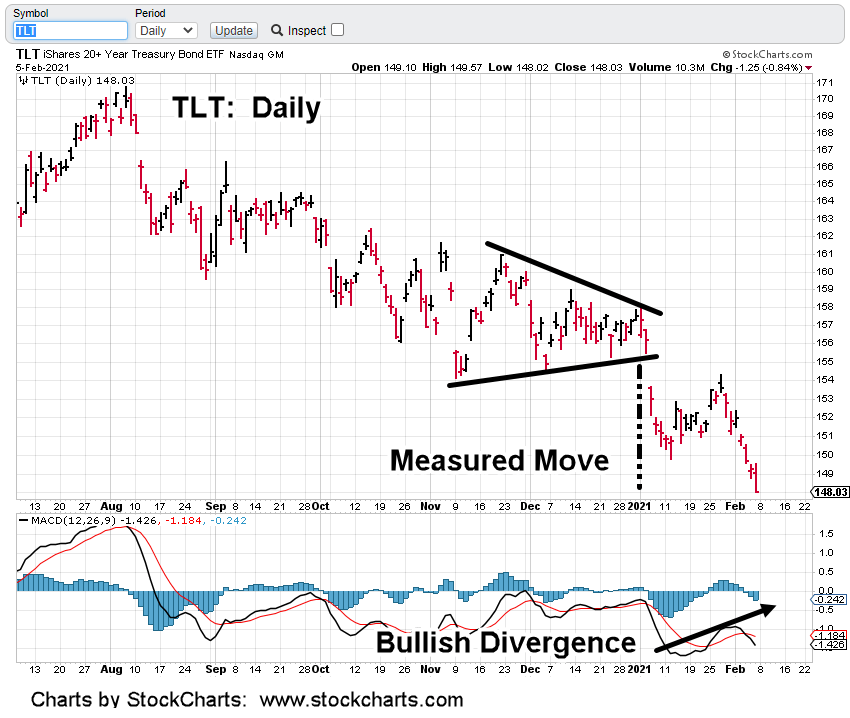
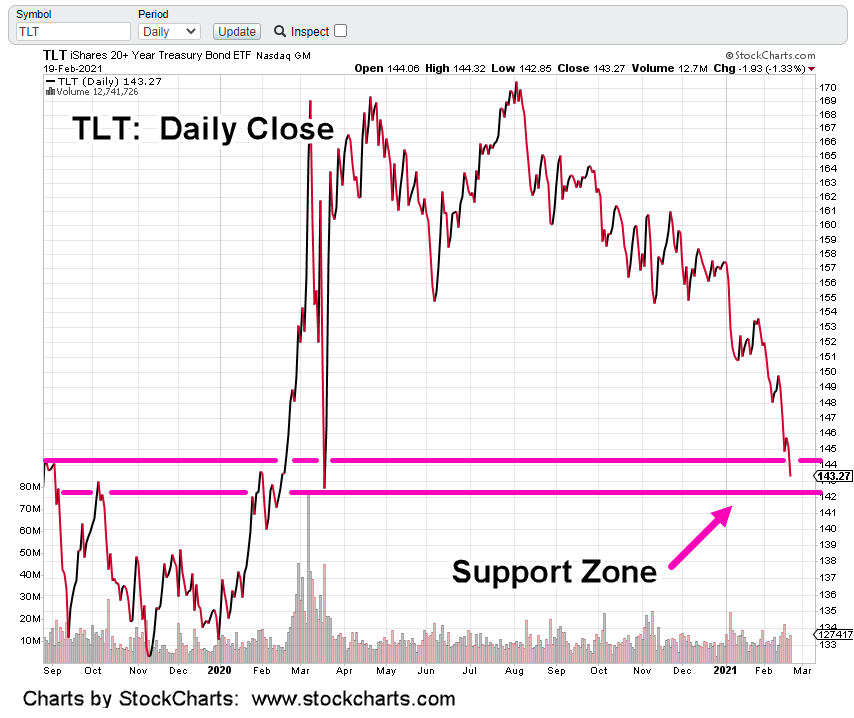
Market down, bonds up.

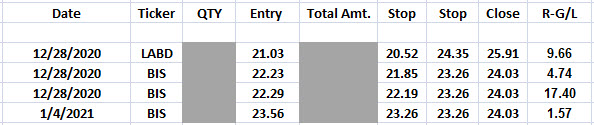
The daily close of long bond TLT, has it in a support zone. One attempt has already been made to position long via TMF (not advice, not a recommendation) as detailed in this report.

Once again this past Friday, another TMF entry.

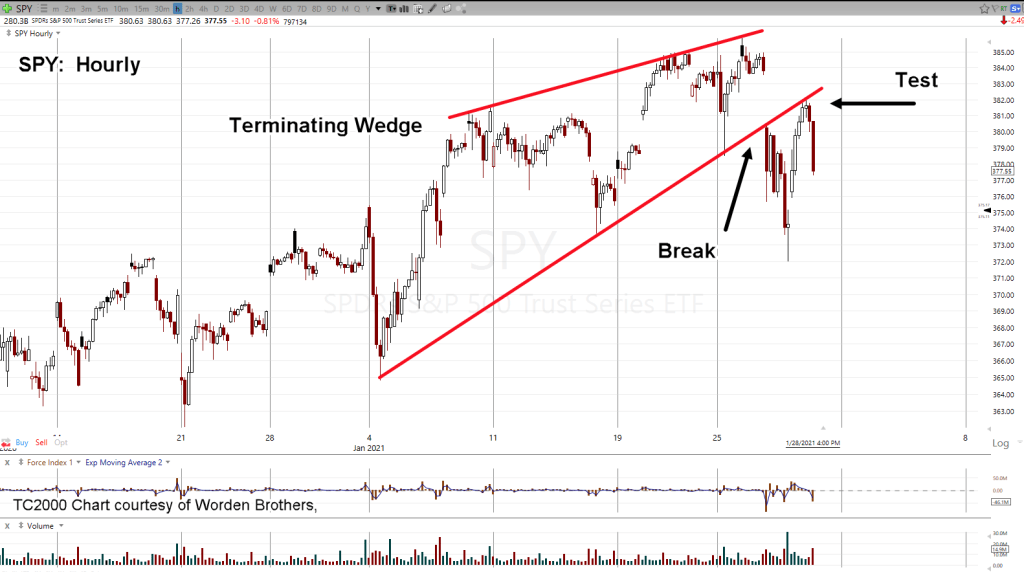
Both bonds and the markets (i.e. S&P 500) are at opposite extremes. The risk of loss in bonds may have reached its nadir.

Charts by StockCharts

Note:  Posts on this site are for education purposes only.  They provide one firm’s insight on the markets.  Not investment advice.  See additional disclaimer here.

Bonds: Measured Move, Met

From the wedge breakout to the downside, Friday’s action in TLT has met the measured move.

Price action finished at the low of the day (+0.01) and is posting a bullish MACD divergence.

On the other end of the spectrum, the S&P 500 finished at all time highs.

Intuitively, we can see how this is setting up.

Each market is at an extreme. That includes real estate, IYR at its own 76.4%, retrace … although severely lagging the S&P.

Unfortunately at such junctures, we can expect some type of ‘incident’ to set things off in the opposite direction.

It may not happen but if it does, the markets define the news; not the other way around.

Stay Tuned

Charts by StockCharts

Note:  Posts on this site are for education purposes only.  They provide one firm’s insight on the markets.  Not investment advice.  See additional disclaimer here.

S&P 500: Trend Break, Test

Yesterday, the S&P tested its trend breakout and then reversed.

This morning’s pre-market action is down again.

The teminiating wedge is clear. Then a decisive break with an upward test. Late in the session that test was rejected and the market headed lower.

That scenario could have easily been from 1931’s stock market action, not 2021.

Buried within the Wyckoff training course material (first published 1931), available here, is a statement to the effect:

‘When a market breaks a trend decisively and with volume, there’s nearly always some type of rally to test the break.’

That’s exactly what we got yesterday. Now, the S&P (SPY) is in a wide pre-market range but essentially trading lower.

A terminating wedge is typically the last stop in a move; whether it’s up or down.

The S&P could of course rally from here. At this point, probabilities favor lower; at lest to a measured move target in the vicinity of 368, for SPY.

Note:  Posts on this site are for education purposes only.  They provide one firm’s insight on the markets.  Not investment advice.  See additional disclaimer here.

All Markets Down

Pre-market action has all major indexes trading lower; SPY, DIA, QQQ, SOXX and IWM; all down.

Real estate, IYR has no real pre-market volume (20-shares) so its open is unknown. However, inverse fund DRV, does have volume (3,700 shares) and its action is up about 4%.

The daily close chart of IYR (above), has price action contacting an established axis line.

That was yesterday. Over the past two-weeks, as price ratcheted higher volume has declined (circled area enlarged).

That decline indicates lack of commitment at these levels.

Yesterday’s close also put IYR firmly in up-thrust position (ready for reversal).

Over the past week, short positions were opened using DRV (not advice, not a recommendation)

Average price of the short equates to DRV @ 9.92; not far from current pre-market trading.

If IYR posts a new daily low (below 86.62), it’s another data point the anticipated reversal may be at hand.

The rising action has changed the P&F forecast reported a few days back. Updates will be forthcoming.

If this is the start of a sustained reversal, the plan is to build the short position as price action dictates.

The downside of the entire market (S&P, Dow, etc.) is immense. Commercial real estate is especially vulnerable. Price action itself tells us that.

Stay Tuned

Charts by StockCharts

Note:  Posts on this site are for education purposes only.  They provide one firm’s insight on the markets.  Not investment advice.  See additional disclaimer here.

Flat-Line: Real Estate

It’s taken over six months for real estate’s IYR gain a net positive 1.9%.

The S&P eclipsed that many times over during the same time frame; gaining nearly 19%.

By this time, everyone knows about margin debt at never before extremes and the latest hedge fund blow-up.

As with earthquakes, cracks in the system appear to start small and then build to a massive disconnect.

Behind all the shiny object headlines, commercial real estate looks terminal. While the rest of the market powered to new recovery highs, IYR went flat-line.

Today’s close may be important.

We’ll see if somehow IYR is going to break out of the six-month sideways action, continuing higher or if this is it; no more upside.

Currently, the firm is short the sector with a negative return. Possibly a debatable position. However, if IYR is going to stall and reverse, this is a high probability location.

It’s not much different than Van Metre’s approach to the bond market. We know how the game is played. The market remains at manic levels … just waiting for the catalyst.

Stay Tuned

Charts by StockCharts

Note:  Posts on this site are for education purposes only.  They provide one firm’s insight on the markets.  Not investment advice.  See additional disclaimer here.

Dow, S&P, Outside Down

So, this is it?

As this juncture (11:06 a.m. EST), both the Dow and S&P have key reversals; and now the QQQs, and Russell 2000, have just joined them.

If they hold and decline from here, reversing from all time highs, we can add that data to our empirical “Holiday Turns

Holiday turns … markets tend to reverse just before, during, or just after a holiday week.

In the biotech arena, this morning’s gap higher (IBB) closed the distance from price action to the stop for inverse funds BIS and LABD.

That closure opportunity was used to increase the short position (via BIS) in one of the managed accounts.  Not advice, not a recommendation.

The IBB bearish divergence is beginning to take shape.

Positions:

Note: “Close” prices as of 11:03 a.m. EST

Charts by StockCharts

Note:  Posts on this site are for education purposes only.  They provide one firm’s insight on the markets.  Not investment advice.  See additional disclaimer here.

October 1987, Is That You?

Price action has an eerie similarity to August 1987 and the months following.

To those old enough … recall how prices just seemed to press higher and higher during the summer months?  Stretched, they were.

Then came a break with a move lower.  After a while, a few weeks or so, it seemed as if the market was going to make another attempt.

The second attempt did not seem as energetic.  Prices continued on though … until they stalled and headed lower.

Just like now?

Continuing on with 1987, price action drifted on down; seemingly with out much fanfare until one day … a Friday there was a huge drop.

That was Friday, October 16, 1987.  We all know the action that followed on Monday.

Getting back to the markets at hand:

The last bond update showed a potential bullish set-up. 

There’s nothing that says bonds can’t start higher now.  In fact, it’s been two up days in a row for TLT.

If TLT penetrates the 160.98, level to the up-side, it’s a classical analysis (not a recommendation, not advice) buy signal on the weekly time-frame.

As of this post (7:01 p.m. EST), the S&P futures are already down -22 points, or about -.65%.  Correspondingly, bonds are higher.       

Charts by StockCharts

Note:  Posts on this site are for education purposes only.  They provide one firm’s insight on the markets.  Not investment advice.  See additional disclaimer here.

June 5th, 2008.

That was the day where the bear market began in earnest.  After that day, it never looked back. 

The final posted low was 666, on March 6th

Let that sink in for a while:   Six-six-six, on the sixth.  There is much more going on than the general public realizes.

We wrestle not with flesh and blood …

Getting back to that day on June 5th, those old enough will remember the market had been trending lower for about three weeks.

Then, on Thursday the fifth, there was a huge rally.  The S&P moved up over 2% on the day.

This rally as it turned out was just short covering.  The next day, price opened gap-lower and moved swiftly lower to new daily lows.

The move down was about -3.5% on the day.  There was no denying at that point, it’s a bear market, potentially a crash (which it was).

Is that same scenario what just happened today, Friday?

Looking at the analysis that Sajad put out on August 15th   He showed “there’s one final move to go”: Time stamp, 5:20

His quote is shown on the chart.  Indeed, the Dow 30, the DIA, had one more move to go before reversal.

If the coming Monday, opens gap lower and posts a new daily low, the market is performing in a way that’s similar to June 5th of 2008.

Charts by StockCharts

Note:  Posts on this site are for education purposes only.  They provide one firm’s insight on the markets.  Not investment advice.  See additional disclaimer here.

Theory vs. Action

Successful market speculators and traders, are not intellectuals.  There’s a difference between smart and savvy.

This is why scientific professionals such as doctors and engineers (author’s empirical opinion), are some of if not the worst market losers.

That statement is backed up by many sources, just two of which are below:

In Dr. Alexander’s book Come Into My Trading Room, he gives a brief reference to a Cybernetics PhD., market trader that had to ‘overcome’ his intellectual superiority to be successful.

In Market Wizards, Ed Seykota discussed a need to use his MIT Engineering degree (his intellect) in ways that won’t hurt him too badly in the marketplace.

There are now two theories on the U.S. bond market (links below) and we’ve been monitoring that market closely.  The bond action, TNX, looks like it’s about to break out with rates higher.

On Friday, we saw the market and bonds move lower together. 

The next meltdown may be a simultaneous collapse of the market and bonds.

The effect of such a move would be to wipe out retirees, the middle class and wealth management firms all at the same time.

Bond theory says, bonds will remain under control and interest rates low.  Bond action says, bonds will be sold off with rates rising.

Going to price action of the 10-year, it’s critical juncture status from the last post has not changed.  In fact, price action shows bonds even more tenuous.

Professional trading is based on price action, not theory.

At this juncture, going short (selling) the bond market (not advice) appears to be the lower risk position.

The past week has the press and public all aghast at a minor (percentage wise) blip lower. 

We’re probably on the last bubble for this cycle.  The markets could ‘air-pocket’ into several gaps lower; say, 25% – 50%, overnight.

Be Prepared

Charts by StockCharts

Note:  Posts on this site are for education purposes only.  They provide one firm’s insight on the markets.  Not investment advice.  See additional disclaimer here.

All But One

Of the nine market indices listed below, only one has a bearish weekly MACD cross-over:  Biotech

IYM:  Basic Materials

IBB:  Biotech

DIA:  Dow 30

IYT:  Dow transports

QQQ:  NASDAQ 100

IYR:  Real Estate

IWM:  Russell 2000

SOXX:  Semiconductors

SPY:  S&P 500

Yesterday, the indices were are at all time highs except for real estate (IYR), biotech (IBB), and Russell 2000 (IWM). 

Looking at IYR and IWM, we can see, although they are below the high, there’s still a persistent up-trend.

Even with today’s on-going reversal (three-hours before close), only biotech has posted a bearish, weekly MACD cross-over.

Of course, it won’t be known until after the fact why biotech is unique.  A hint at what might be the reason, is here (if it’s still available).

A gallery of the weekly index charts, listed above (as of 9/2/20) can be found here.

The focus of this firm, since June 3rd, exactly three months ago, has been biotech and its impending reversal.

A significant short position has been established over those three months via BIS, the 2X, inverse fund. Current Stop: 32.18

So, just what is ‘significant’?  How big is that?

To be transparent, without giving specifics, avoiding the usual internet keyboard warrior, and/or hater, the position is as follows:

We’re short what amounts to a full year’s wage for the typical American worker.  Fair enough?

When the position is closed out, results will be posted on the company site, located here.

Note:  Posts on this site are for education purposes only.  They provide one firm’s insight on the markets.  Not investment advice.  See additional disclaimer here.