Inverse biotech, LABD above, is confirming a pivot.
The magenta arrows show contact points morphing into a pivot that has two more contacts.
The new trendline was copied, then pasted to the far left of the chart.
It’s clear the new (pivot) trend is identical to the one created when LABD bottomed out this past February.
While the overall markets (S&P, Dow, COMPX) are still showing green, biotech looks like it has started the next leg down.
The original short position via LABD, has remained intact (not advice, not a recommendation) and has been increased five times (including today) since the beginning of this month.
In our view, biotech’s signaling the potential for a very dangerous situation.
Biotech’s headed down and we’re already short; not advice, not a recommendation..
As Livermore said a hundred years ago, ‘surprises tend to happen in the direction of trend.’
Stay Tuned
Note: Posts on this site are for education purposes only. They provide one firm’s insight on the markets. Not investment advice. See additional disclaimer here.
This morning’s gap lower in SPBIO (LABD higher) was fully expected.
Expected as well, is the retrace in progress as of this post.
Today, is Fibonacci Day 8 from the LABD, pivot low of June 28th.
Biotech (SPBIO) has posted a fantastic time sequence on the daily as well as the weekly.
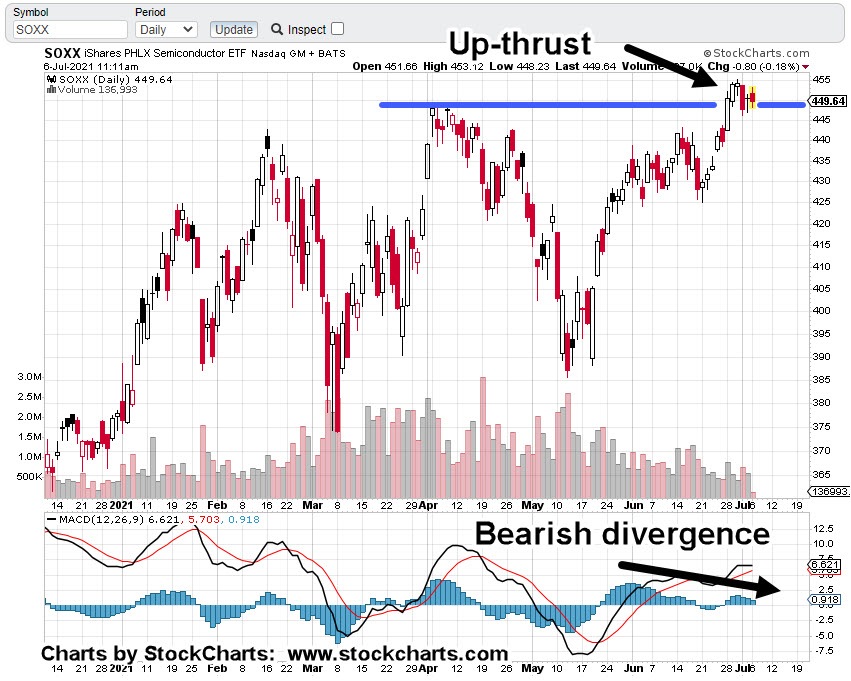
The gap-lower open in the S&P (more so for SOXX) has everyone sharpening their pencils; wondering, if ‘this is it?’.
It could be.
However, with attention now focused on potential downside, the clean Fibonacci sequences are likely to morph into chaotic movement.
The time for low-risk short positioning (not advice, not a recommendation) in this sector may be coming to an end.
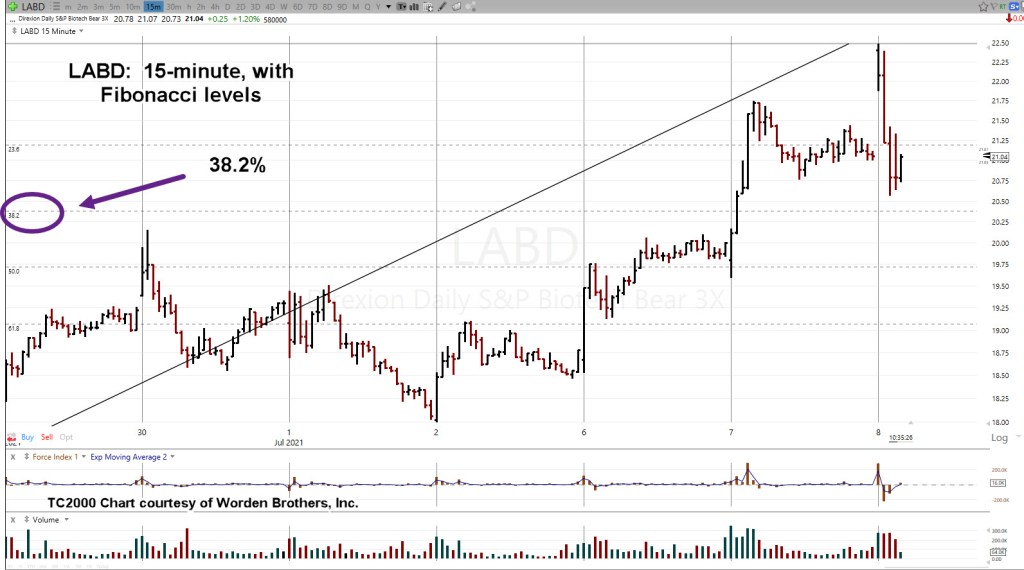
Looking at inverse LABD, and using the Fibonacci retrace tool, it’s likely price action will retrace to at least the 38%, level.
At this point, it’s already close:
The inverse biotech LABD, 15-minute chart (above) shows we’re near the 38%, level.
After today, the expectation is for price action to become SPBIO downside chaotic … long enough to frustrate the late-comers to the sector.
After that, and however long that is, price action may once again become orderly.
Stay Tuned
Note: Posts on this site are for education purposes only. They provide one firm’s insight on the markets. Not investment advice. See additional disclaimer here.
Note: Posts on this site are for education purposes only. They provide one firm’s insight on the markets. Not investment advice. See additional disclaimer here.
At this point, especially after witnessing the ‘lock-step’ positioning of major corporations over the past year, one thing is obvious:
They’re all operating in concert.
The coordinated message is that everything’s getting back on track. No need to worry.
See how ‘normal’ things are? Big companies are even ‘planning’ for the future. Stay calm and take no (preparatory) action.
Indian Summer:
The reality is, just as this link suggests, we’re in an Indian Summer. That is, we’re between two extremes.
The past year can be viewed as the summer heat. Then, we’ve just had a break (advent of fall/winter) with restrictions being lifted … but soon the figurative and literal winter will come.
Think that’s a bit much? Well, let’s just take a look at one item.
The video in the link above, mentions the need for ‘body bags’; that we’ll run out … sounds insane.
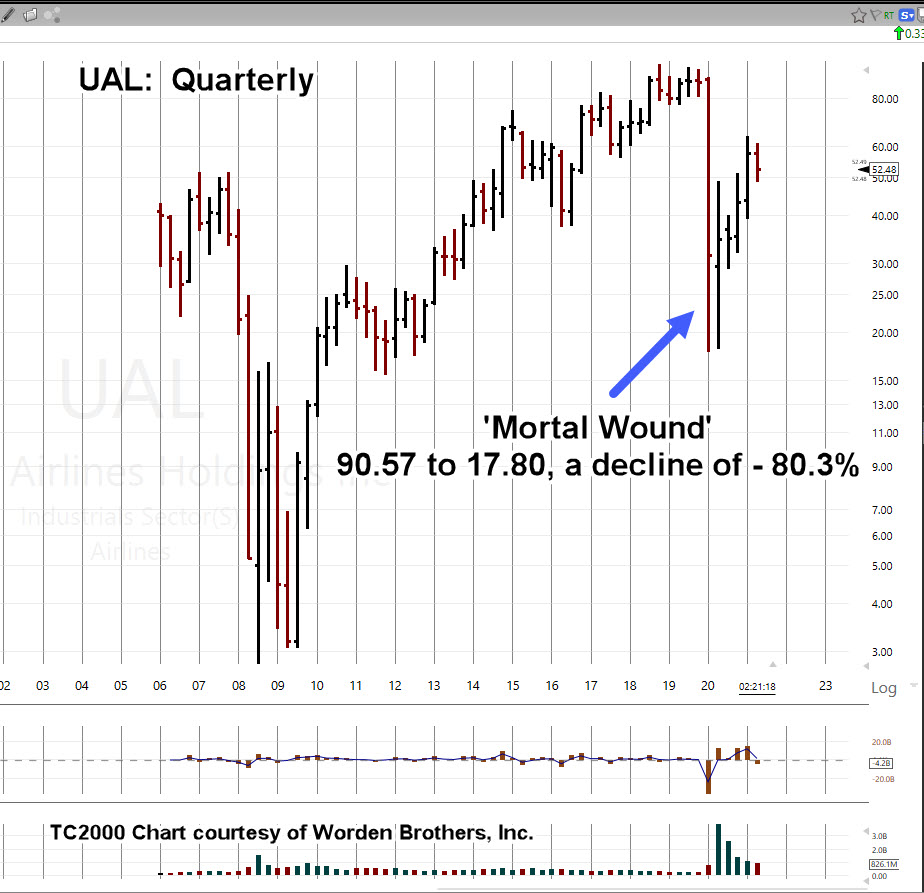
The long term, Quarterly chart shows the extent of the technical damage.
The 80% drop could be the beginning of a multi year (maybe decades long) decline.
If it was a crash (like lumber futures), it will have the typical crash-like structure.
That is: An initial swift, decisive decline; followed by retracement which then rolls over into a sustained and long term move lower.
Meanwhile, the S&P 500, is hovering at its all-time-highs.
Not only has UAL not made a new all time high (posted way back in December of 2018), the weekly chart shows it’s formed a terminating wedge.
At this point, it’s ‘rolling out’ of that wedge indicating sell or sell short; Not advice, not a recommendation.
Stay Tuned
Note: Posts on this site are for education purposes only. They provide one firm’s insight on the markets. Not investment advice. See additional disclaimer here.
Crisis will create opportunity for leadership; at this point, there’s not much if any in the financial sector (i.e. ‘best ever’, above).
When the big melt-down hits, leadership’s not coming from the ranks of the ‘compliant’ or the enforced mediocrity of the ‘fiduciary’.
Therefore, we can all take our cue; like this Irish couple who took it upon themselves, to separate from the crowd and escape quarantine.
With that in mind, on to the markets:
Analysis, Biotech
As we head towards the close with about twenty minutes left, the S&P 500, has posted an all-time high.
Biotech, SPBIO and IBB, are still well below their highs but are nonetheless at a point of instability with today’s action.
As the Hourly chart of LABD shows, we’re at the danger point and in spring condition:
A push back into the range above support, is significantly bullish for LABD and bearish for SPBIO.
Stay Tuned
Note: Posts on this site are for education purposes only. They provide one firm’s insight on the markets. Not investment advice. See additional disclaimer here.
Note: Posts on this site are for education purposes only. They provide one firm’s insight on the markets. Not investment advice. See additional disclaimer here.
Remember the maps at the mall … that showed the layout and where you were?
Well, here we are:
In candlestick lingo, Thursday was a ‘hanging man‘ set-up.
Friday was confirmation with a lower open, lower close, and penetration of the prior day’s low.
Error Correction:
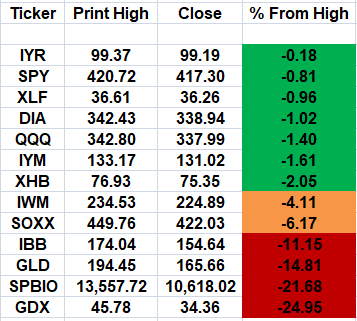
A prior update made somewhat of an error when it said ‘Of all the major indices, biotech on a percentage basis, is the downside leader.’
Sort of.
The Index Table below is updated to include gold (GLD) and the senior miners, GDX.
In fact, GDX is leading the downside.
From a trading standpoint, GDX has been ignored because it’s such a crowded market. Nonetheless, for different reasons than biotech (i.e. deflation), strictly speaking, it’s the downside leader.
Note: Posts on this site are for education purposes only. They provide one firm’s insight on the markets. Not investment advice. See additional disclaimer here.
‘The next twenty minutes are going be long and boring. You might want to skip to the end to see the conclusion.‘
His rabid and loyal fans then proceed to hang on every word of his self professed ‘boring anecdote’ until the very end.
Not saying this site’s in the same league as Harrell’s.
Just saying, the following is going to be a tedious discussion of American Tower (AMT) and how it just might be ready to start an Elliott Wave III, down.
Market Extremes:
Its been no secret. The markets are at price levels and valuations never before seen.
In this site’s opinion, going long anything, is insane.
There could be a break, upset, world event, container ship run aground (oh, wait…), cyber attack, volcanic eruption (oh, wait …), major earthquake, nationwide weather freeze (oh, wait…) food supply disruption (oh, wait…) bond bear raid (oh, wait…) currency devaluation, or any myriad of disconnects that would instantly change the dynamic.
Change the dynamic in such a way as to make low-risk long exit, or short positioning impossible.
This site has documented several times where major brokers have already gone off-line as a result of markets fluctuating to the upside.
What happens when it turns down? Good luck getting out.
Looking for the (short) entry:
Its been an on again, off again, and back on again affair with shorting real estate, IYR. Anecdotal evidence such as Jerimiah Babe’s updates from his area, show the market’s been vaporized and is not coming back.
We’ve shown from a Point & Figure chart perspective, IYR has built significant price action congestion.
In Wyckoff terms, congestion equals potential.
The IYR index has built enough congestion that if/when the reversal comes, price action has potential to decline below the 2009, lows.
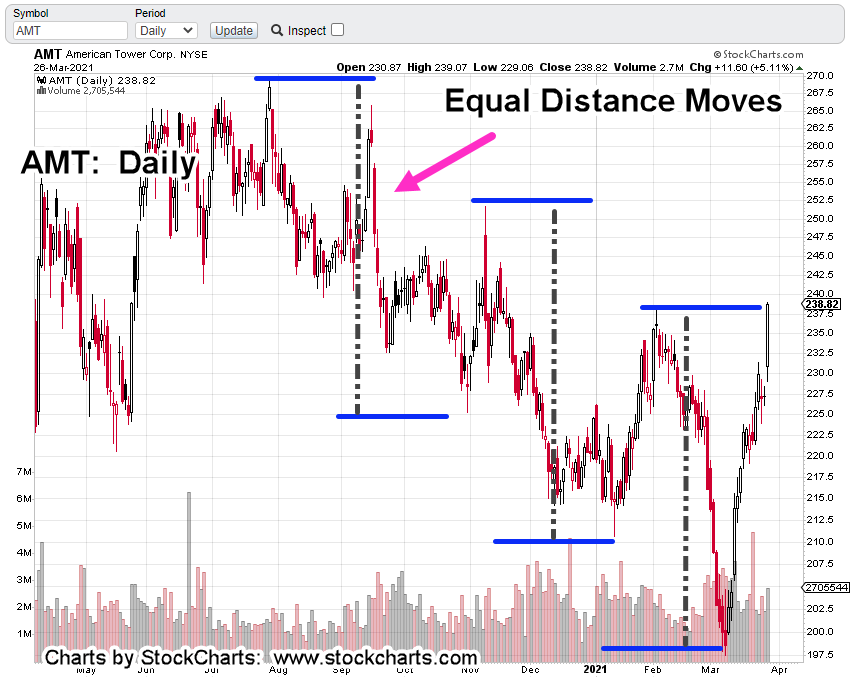
American Tower (AMT) Symmetry:
Now, for the analysis of AMT.
We’re going to start with the daily chart which has an interesting pattern of equal distance moves (or waves):
This equal move structure gives a hint that something’s up. The market’s moving in an orderly fashion. But what order?
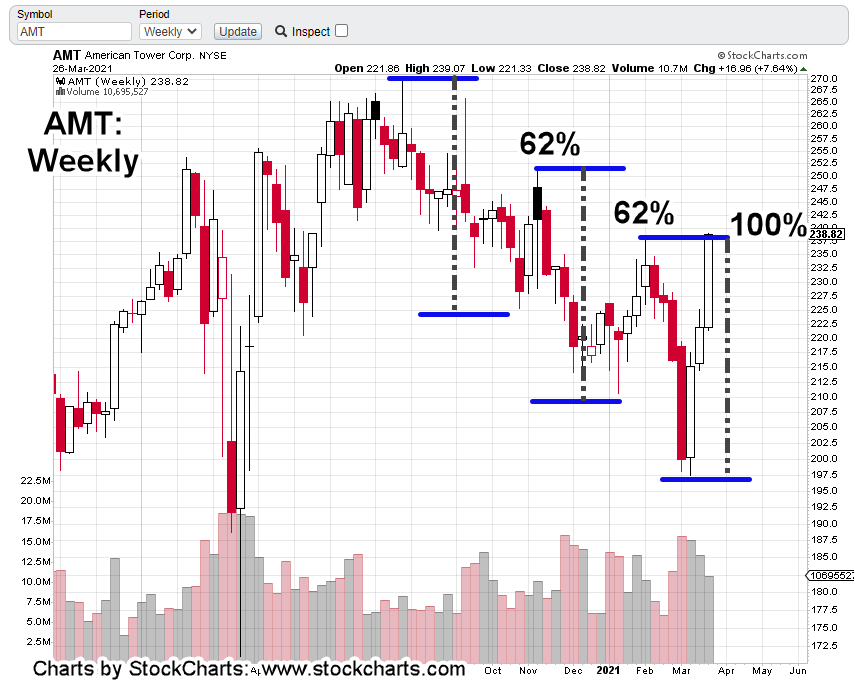
To add more intrigue, we’ll go to the weekly chart. We see each retrace of the two initial waves, was Fibonacci 62%.
The last retrace (up to Friday’s close) is essentially 100%.
Looking up Elliott Wave “equal waves” turns up this presentation. It helps some but does not cover the current situation. The take away from the video is that equal waves do occur.
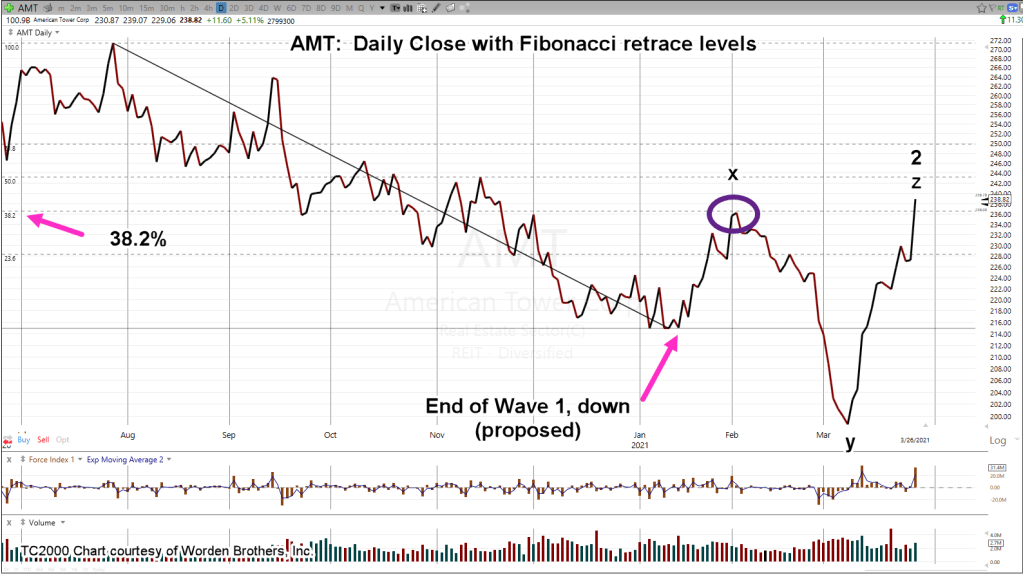
Looking at the daily close chart of AMT gives us this:
The Wave 1, down is placed at the low extreme. Price action then corrects to pivot (magenta oval) at the Fibonacci 38.2% retrace level.
It’s a near perfect retrace.
The reason to think AMT just finished a complex correction that terminated at “z” which is also “2”, is the structure of the fifteen-minute chart below.
The first chart is unmarked except where price action changes character:
Then we put in the Fib projection tool at that location; the inflection point, to get the following:
Incredibly, the top of Friday’s price action is also a Fibonacci target (423.6%) projection.
Getting back to the daily chart and labeling it using the above information gives us this:
Removing all but the labels is more clear:
There could be other ways to label the structure. It may become (very) apparent at the next open whether this interpretation is correct.
However, coupled with yesterday’s analysis of IYR, and its technical condition (at the extreme), we get the sense we’re close to some type of price action hesitation or outright reversal.
Summary:
We’re short this sector via DRV (not advice not a recommendation).
Price action appears to be at extremes and is meeting Fibonacci and support-resistance levels simultaneously.
Not related but an interesting coincidence (maybe): Van Metre’s update on Friday night:
“Is This a Sign Real Estate Prices Have Peaked?”
The futures markets just opened … S&P down 7-points. Let’s see what happens next.
Note: Posts on this site are for education purposes only. They provide one firm’s insight on the markets. Not investment advice. See additional disclaimer here.
Note: Posts on this site are for education purposes only. They provide one firm’s insight on the markets. Not investment advice. See additional disclaimer here.
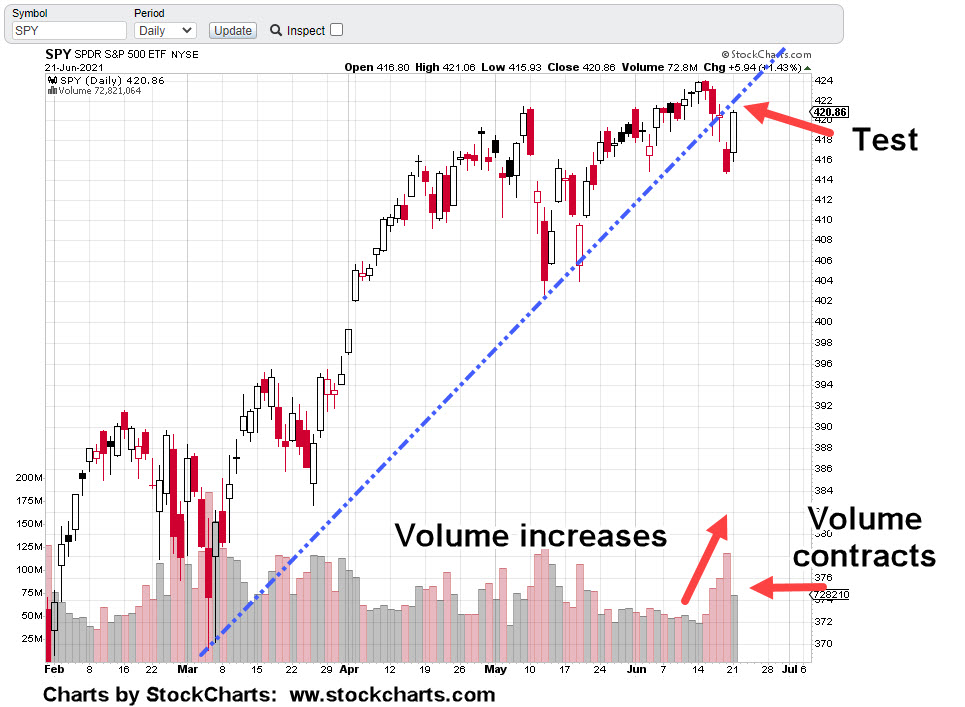
Early in the pre-market, SPY is trading unchanged.
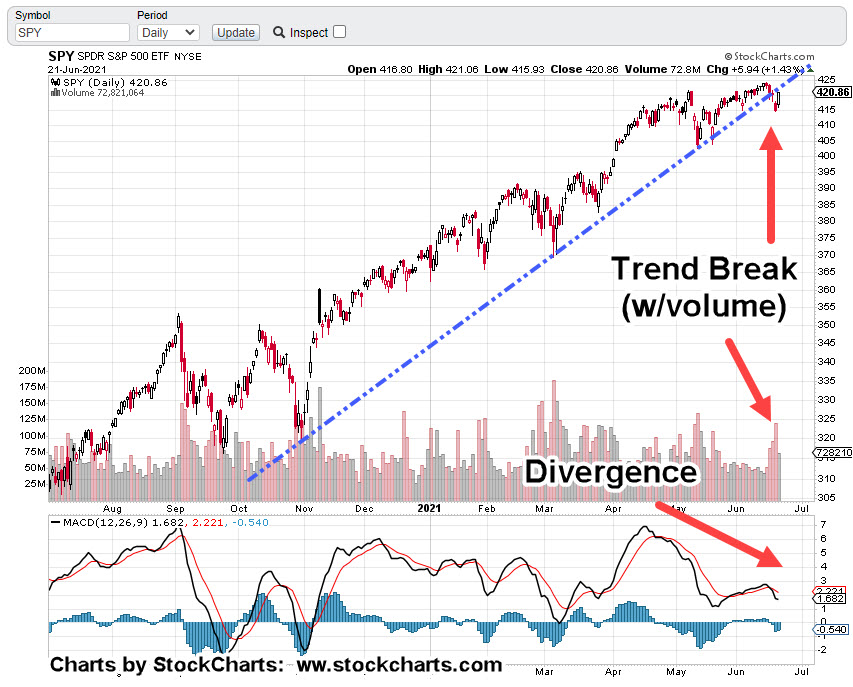
Looking at the daily SPY close, we’ve got a tentative breakout just above resistance (black line).
Lower right of the chart shows upward thrust energy has declined significantly … right along with volume.
Yesterday’s update showed longer term momentum (monthly, weekly) for the S&P was pointed up. Continued price action drifting higher is possible.
However, if there’s a reversal in the making, this is a good place to start.
The buyers (volume) have backed off at this level; leaving the SPY hanging just above breakout resistance.
The SOXX, QQQ, and IBB are well off their highs and may be leading the way lower. Our focus remains on shorting biotech IBB, which is the weakest of the three (not advice, not a recommendation)
Note: Posts on this site are for education purposes only. They provide one firm’s insight on the markets. Not investment advice. See additional disclaimer here.