1907, 1929, 1974, 1987, 2000, 2007, … and Now

As Scott Walters has said:
‘It’s different this time.
It’s Worse!‘
That ‘worse’ part includes the adverse moves in the market.
This time around, as opposed to ’07 – ’08, they really do seem to be worse.
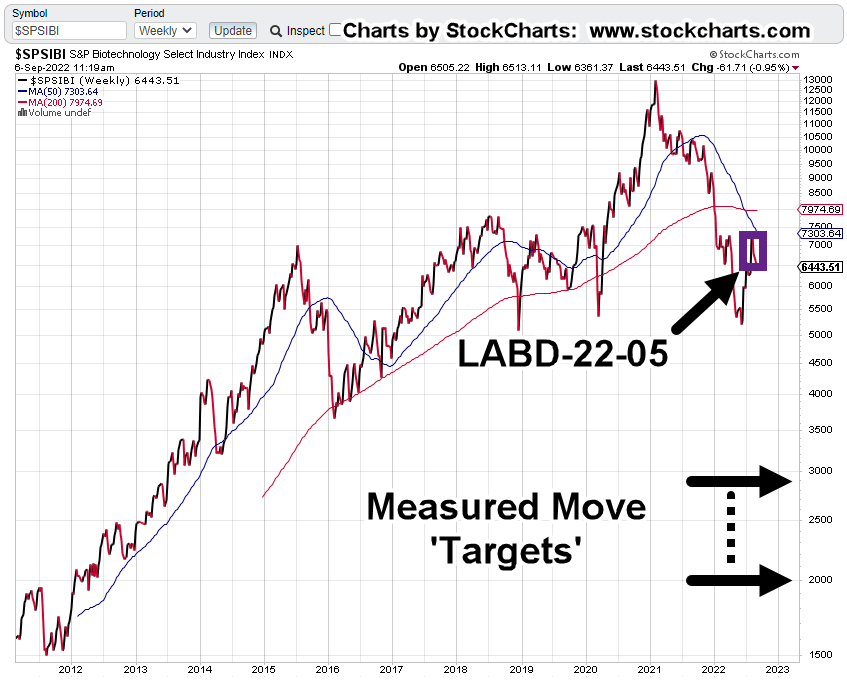
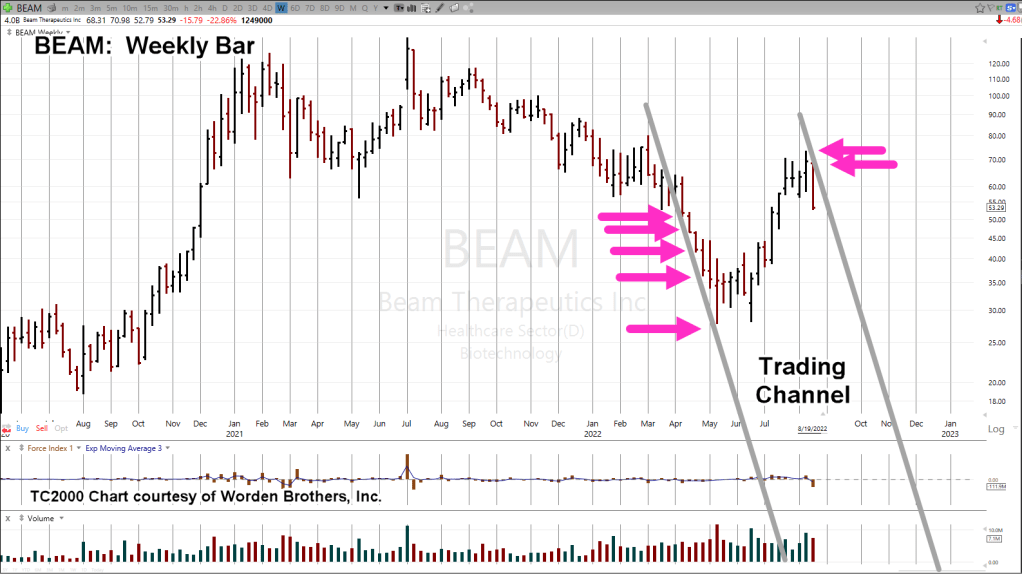
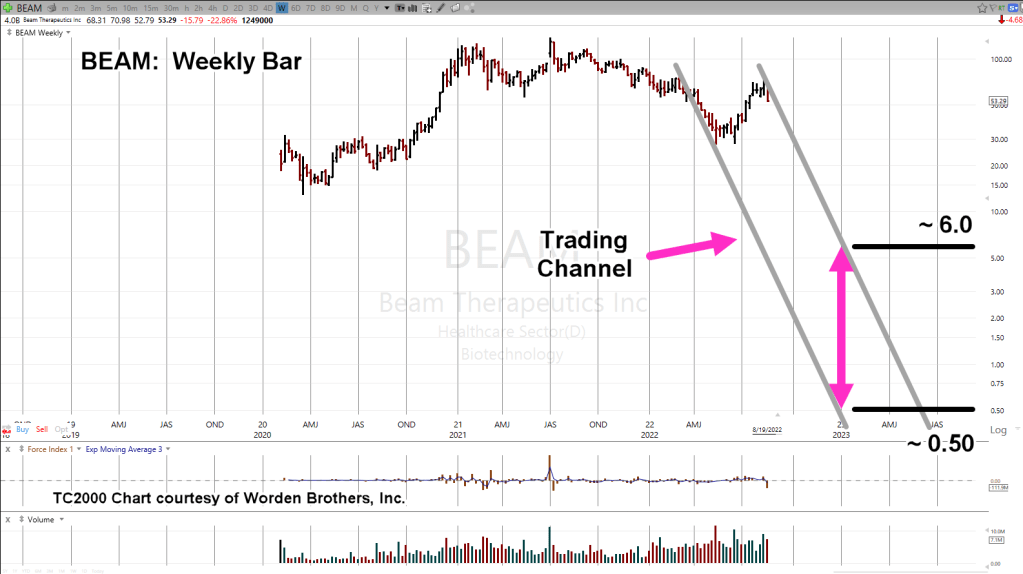
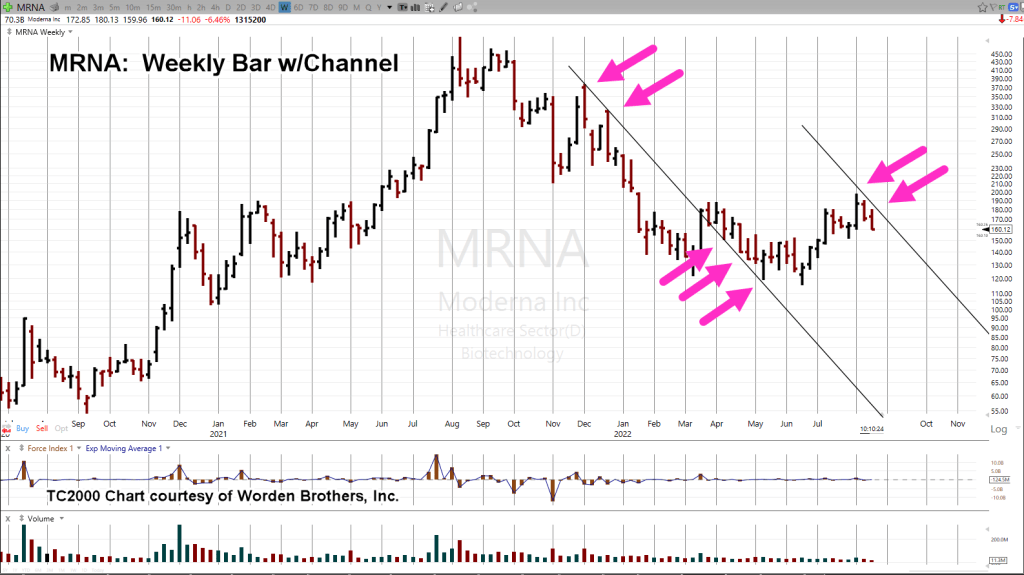
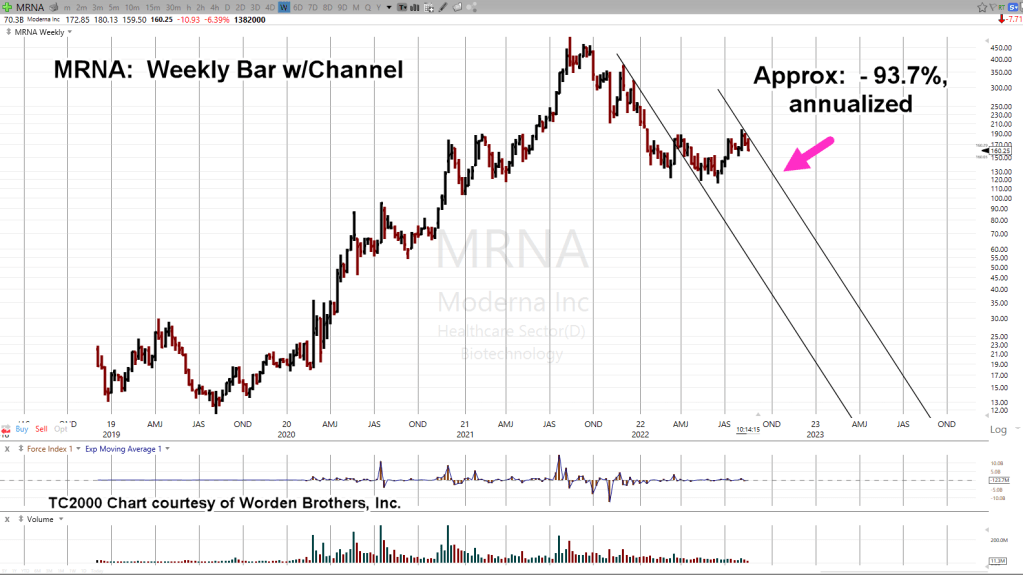
Which, brings us to biotech SPBIO.
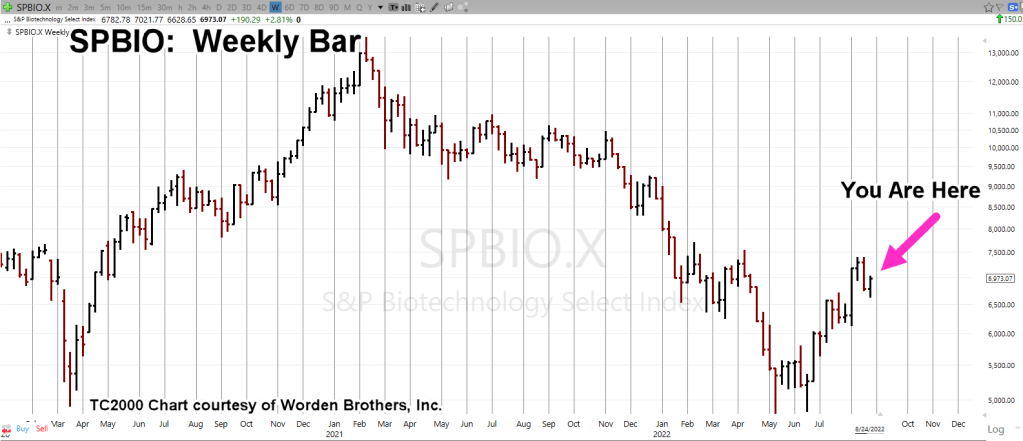
Biotech SPBIO, Weekly
Just to remind ourselves where biotech is at the moment, we have the un-marked weekly chart.
This sector’s the only one (miners excluded) that’s trading below the 50-Week and 200 Week Moving Averages with a 50-wk cross to the downside.
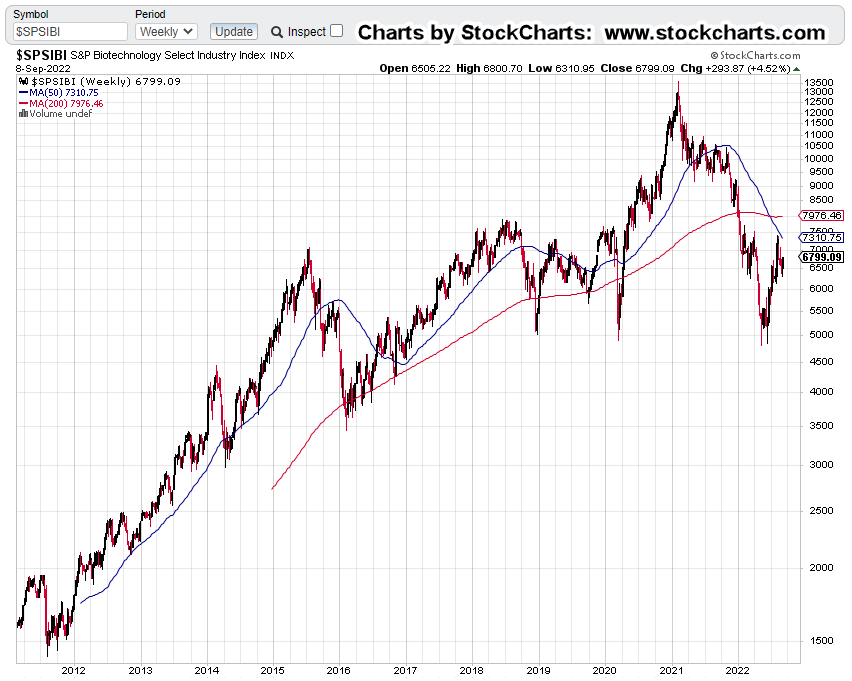
On a weekly basis, we’re in a major long-term downtrend that looks to have finished its upside correction.
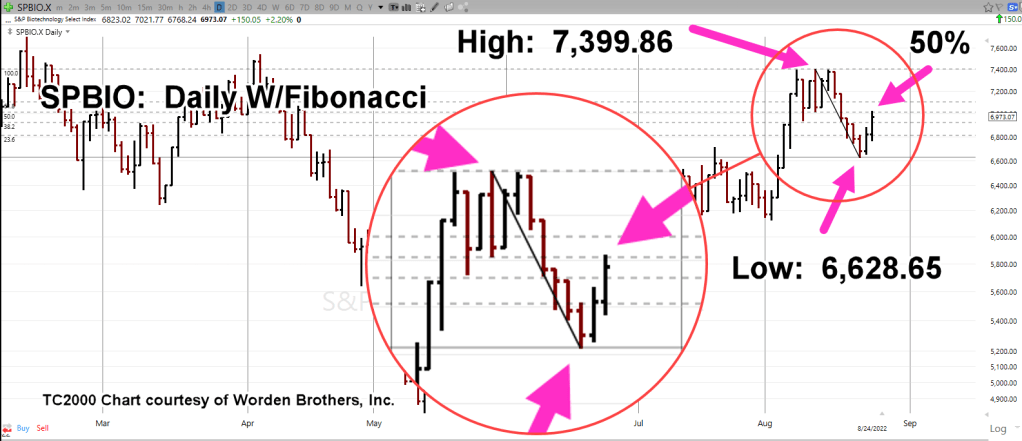
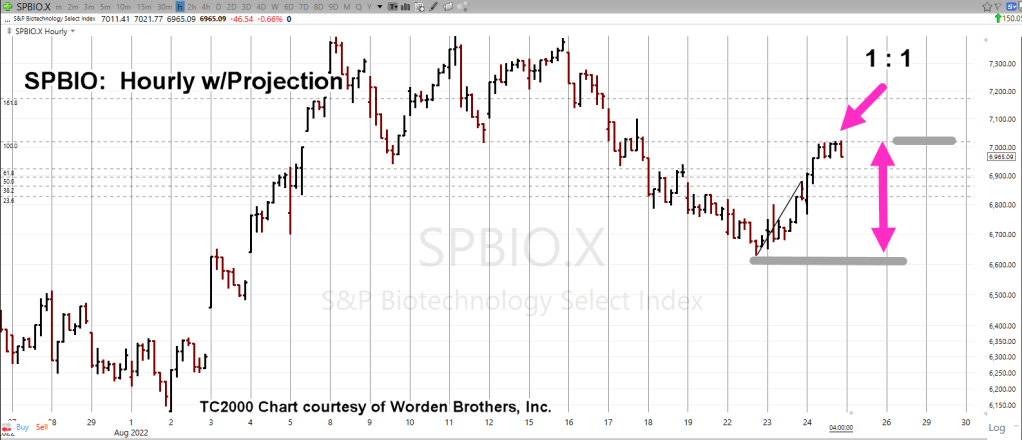
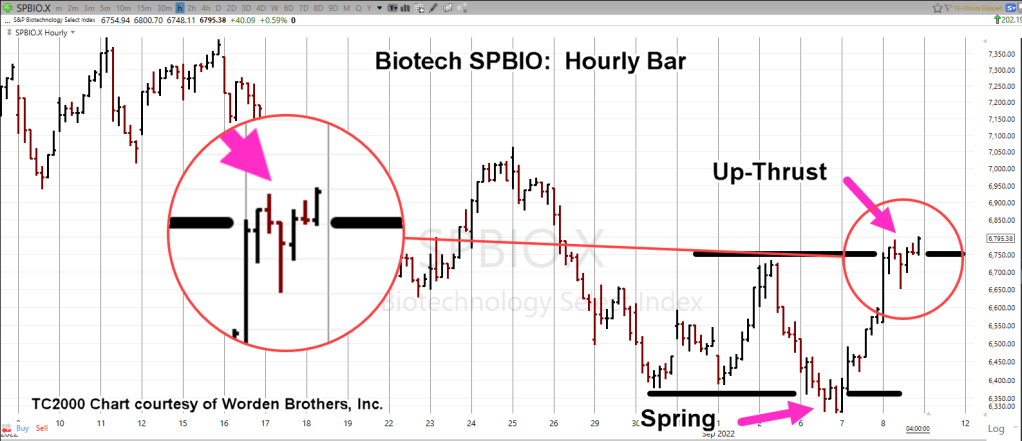
Getting closer-in on the hourly chart we have the following.
SPBIO, Hourly
What do you see?

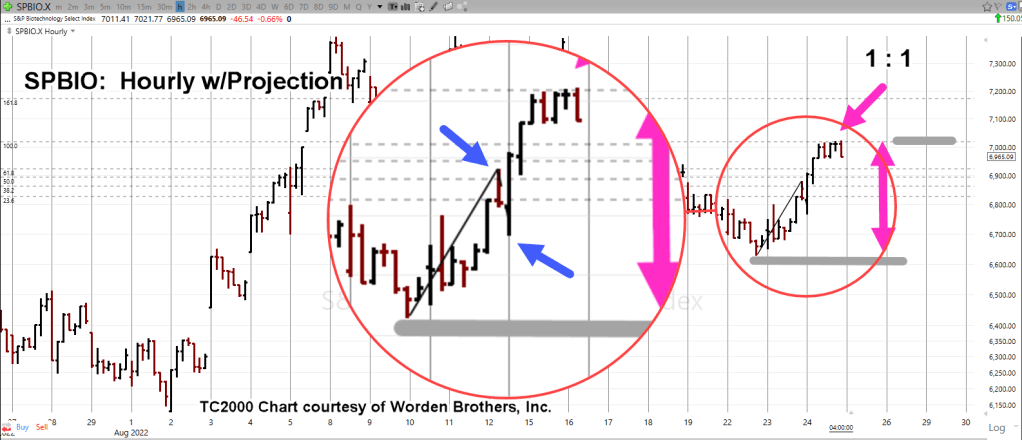
Here’s the marked-up version.

Over and again; a fractal set-up called ‘Spring-to-Up-Thrust‘.
The zoom chart below shows that price action appears to be struggling at the resistance area (black line).
Danger Point
At this juncture we’re at The Danger Point®
Enough of a push higher and SPBIO, could continue on upward, overcoming significant technical and fundamental barriers.
However, since we’re trending lower in the longer timeframes, probabilities suggest that downtrend may be ready (or near ready) to re-assert itself.
Stay Tuned
Charts by StockCharts
Note: Posts on this site are for education purposes only. They provide one firm’s insight on the markets. Not investment advice. See additional disclaimer here.
The Danger Point®, trade mark: No. 6,505,279