Deadliest in World History

3:37 p.m., EST

Injections, Deadliest Ever

Forced Compliance

Biotech Danger Point

By this time, it’s no secret.

The ‘speck’ injections as we call them, have been proven to be the deadliest in world history.

Even with manipulating data by deleting deaths, delaying updates, pressuring medical professionals not to report, the data at this link paints a stark picture.

For reasons likely to be revealed later, major corporations are ‘requiring’ their employees to comply.

Not only that, in the link above it’s the clients as well. One has to wonder, who are ‘clients’ beneficiaries?

Before we leave the topic and move on to the chart, one of the ‘features’ of the injection, is sterilization.

No more employees. No more clients. No more future clients. Somehow that’s an effective business model.

Finally, a cursory review of the local ‘certified’ financial advisers and their websites has not one word about what’s really going on.

Do these people think by avoiding the truth, somehow they’re going to increase their business?

One major nationwide adviser/broker even has (in print, mind you) that ‘we’re going to have the best recovery ever!’

What are they going to say when there’s a “no bid” market and nobody can get in or out?

Crisis will create opportunity for leadership; at this point, there’s not much if any in the financial sector (i.e. ‘best ever’, above).

When the big melt-down hits, leadership’s not coming from the ranks of the ‘compliant’ or the enforced mediocrity of the ‘fiduciary’.

Therefore, we can all take our cue; like this Irish couple who took it upon themselves, to separate from the crowd and escape quarantine.

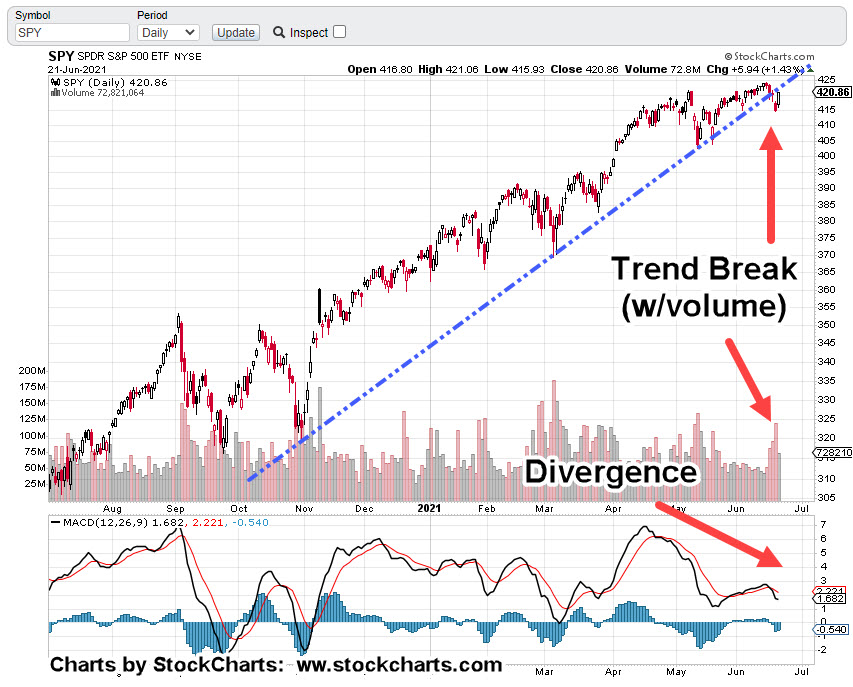
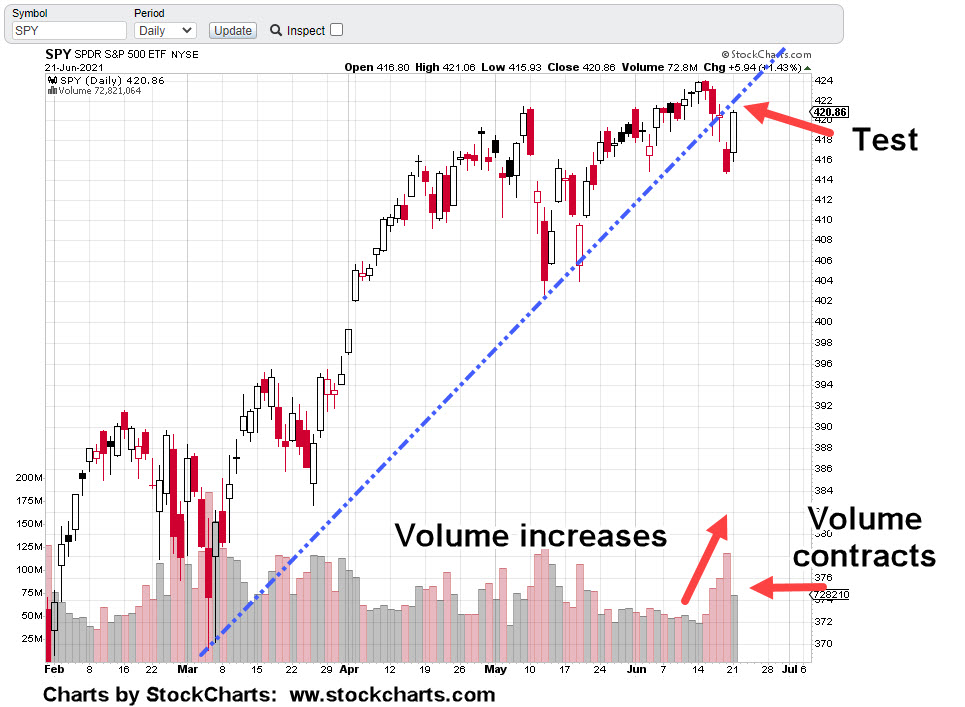
With that in mind, on to the markets:

Analysis, Biotech

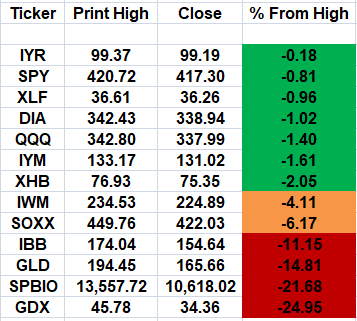
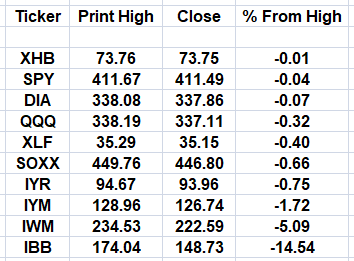
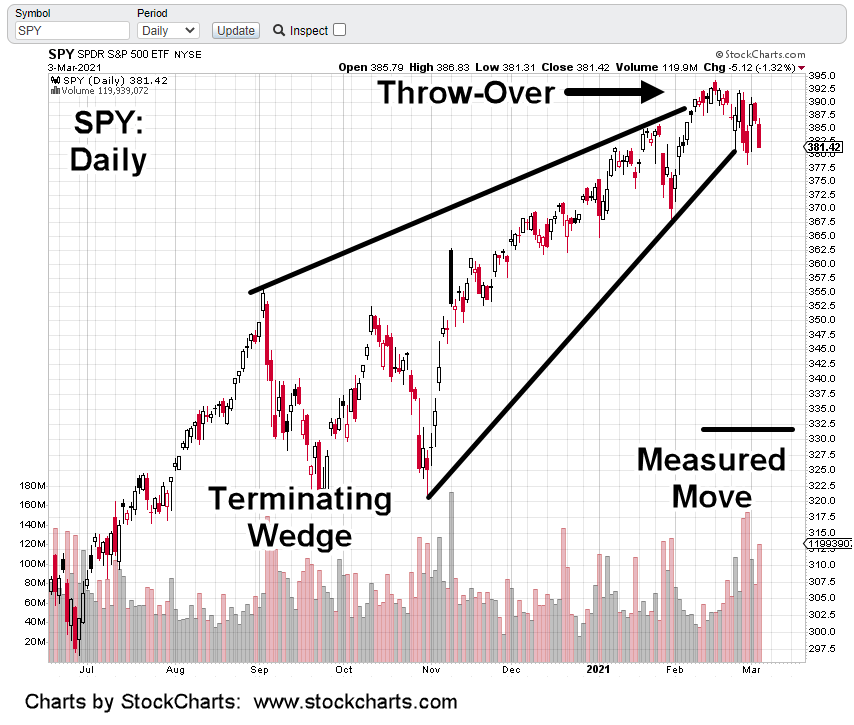
As we head towards the close with about twenty minutes left, the S&P 500, has posted an all-time high.

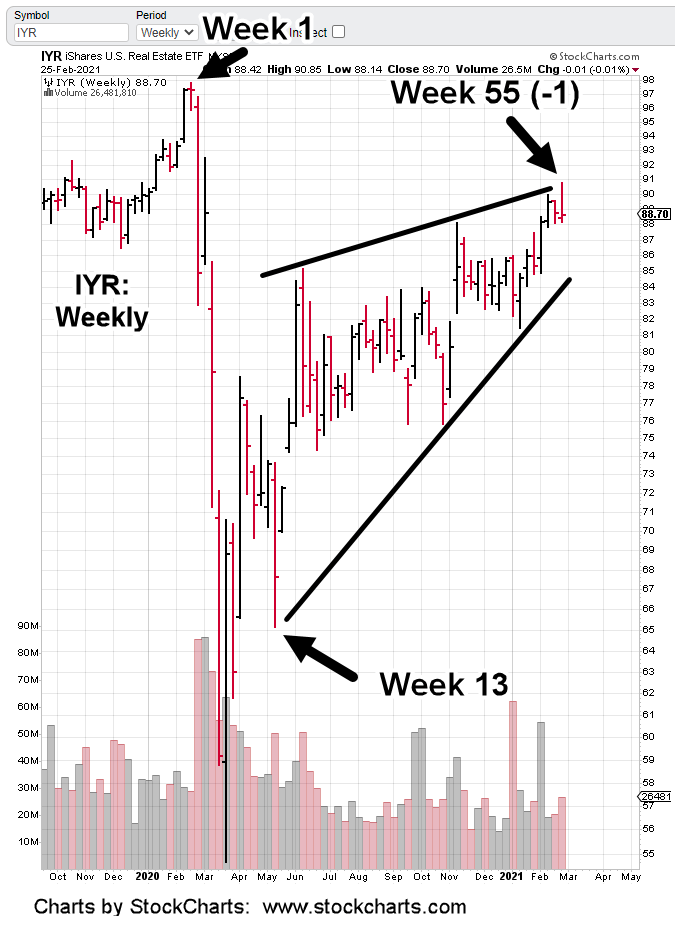
Biotech, SPBIO and IBB, are still well below their highs but are nonetheless at a point of instability with today’s action.

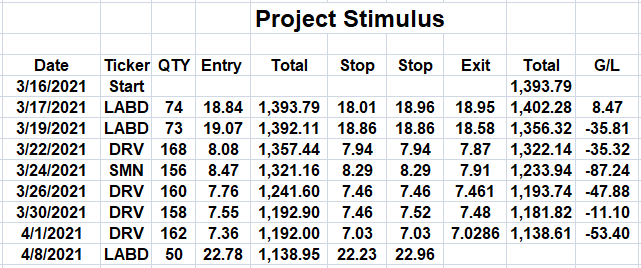
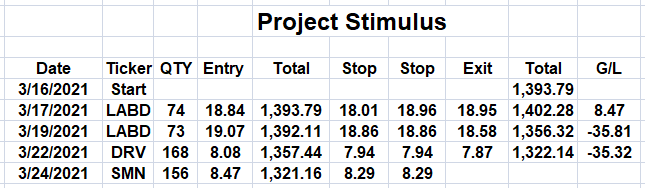
As the Hourly chart of LABD shows, we’re at the danger point and in spring condition:

A push back into the range above support, is significantly bullish for LABD and bearish for SPBIO.

Stay Tuned

Note:  Posts on this site are for education purposes only.  They provide one firm’s insight on the markets.  Not investment advice.  See additional disclaimer here.

S&P 500: Trend Break & Test

9:12 a.m., EST

Trend Break Last Friday

Underside Test, In-Process

End Of The Line?

It’s about twenty minutes before the open. SPY, is trading essentially flat.

The daily chart above, shows the up-trend break was last Friday on increased volume.

SPY, has also posted a bearish divergence appearing to show significant weakness; attributed to MACD lines and histogram declining in parallel.

Getting a closer look (below):

Volume increases on the way down and decreases on the way up: Bearish

We also have a terminating wedge:

Yesterday was a test of the underside trend break. Today may continue that test or reverse at the open.

If SPY can somehow get above the trend break, it has a new lease on life.

However, with bonds, the dollar and gold already in reversals, probabilities suggest we’re at the end of the line.

Stay Tuned

Charts by StockCharts

Note:  Posts on this site are for education purposes only.  They provide one firm’s insight on the markets.  Not investment advice.  See additional disclaimer here.

You Are Here

Remember the maps at the mall … that showed the layout and where you were?

Well, here we are:

In candlestick lingo, Thursday was a ‘hanging man‘ set-up.

Friday was confirmation with a lower open, lower close, and penetration of the prior day’s low.

Error Correction:

A prior update made somewhat of an error when it said ‘Of all the major indices, biotech on a percentage basis, is the downside leader.’

Sort of.

The Index Table below is updated to include gold (GLD) and the senior miners, GDX.

In fact, GDX is leading the downside.

From a trading standpoint, GDX has been ignored because it’s such a crowded market. Nonetheless, for different reasons than biotech (i.e. deflation), strictly speaking, it’s the downside leader.

Charts by StockCharts

Note:  Posts on this site are for education purposes only.  They provide one firm’s insight on the markets.  Not investment advice.  See additional disclaimer here.

Print High & Close

The table lists well known index ETF’s; along with most recent highs and current (Friday) close:

All the usual suspects are there:

S&P 500, SPY, The Dow 30, DIA, Nasdaq, QQQ, and on.

What’s also listed is how far each index (ETF) is from its most recent all time high or ‘recovery’ high (in percentage terms).

Obviously, one of these is completely out of bed: Biotech, IBB

We’ll be discussing the technical condition of biotech tomorrow. For now, the updated ‘project’ chart’s included below:

Note:  Posts on this site are for education purposes only.  They provide one firm’s insight on the markets.  Not investment advice.  See additional disclaimer here.

Basic Materials

Nobody’s paying attention to this index. It may be one of the cleanest (technical) short opportunities.

Basic Materials. Sounds boring.

Sounds like fertilizer … and it is … right along with industrial chemicals.

Three largest cap in the sector are below:

Industrial gasses, Linde AG

Industrial gasses and chemicals, Air Products & Chemicals

Water purification, Ecolab

DuPont is next and then Newmont mining. So, this is a potential deflation play (Newmont) as well.

A post just out yesterday, Uneducated Economist does an excellent job destroying the inflation narrative.

Steven Van Metre has also repeated many times, we’re likely to get a deflation impulse first before inflation.

One of the most important things he’s said, the Fed is not going to correct the public’s (false narrative) perception that inflation’s the danger.

If everyone’s pointed in the wrong direction, and it serves their interests, why correct it?

Which brings us back to Basic Materials. ‘Nobody’s watching’ this index. How do we know?

Look at the inverse fund, SMN.

Russell 2000 inverse, TZA, averages 6 – 10 million shares per day. Compare that to SMN’s 2,500 shares on a good day.

Volume does pick up as price action becomes active. Some days will be 100,000 – 200,000 shares.

Looking at the technical condition, there are bearish divergences on both daily and weekly time-frames. The chart at the top shows a Wyckoff up-thrust (reversal) condition just tested yesterday.

The response is to go short via SMN (not advice, not a recommendation).

Since we’re actively managing accounts throughout the day, it’s not a problem to monitor SMN and the bid/ask of the fund when trading is light.

The ‘project’ table has been updated:

Pre-market has SPY trading down about -1.5 points or -0.40%. The expectation is for Basic Materials to follow suit.

Stay Tuned

Charts by StockCharts

Note:  Posts on this site are for education purposes only.  They provide one firm’s insight on the markets.  Not investment advice.  See additional disclaimer here.

S&P, Down in Pre-Market

The last update on the SPY said this:

“The SPY shows a nascent reversal. Price could come back to test resistance (black line) or continue to decline from here.”

That’s what it did. Price came back to test.

It’s early in the pre-market and SPY is showing a slightly lower open; currently down -1.29 points, or about -0.32%.

Thrust energy on the test was low. There’s potential for continued down action from here.

Recall that last week’s price bar was a reversal. A new weekly low would help confirm there’s more (sustained) downside ahead.

The ‘project’ is already short real estate via DRV (not advice, not a recommendation). If it follows suit, downward action in IYR can be expected.

Charts by StockCharts

Note:  Posts on this site are for education purposes only.  They provide one firm’s insight on the markets.  Not investment advice.  See additional disclaimer here.

Sentiment Shift

There’s been a change in direction; a sentiment shift.

Not in any particular order:

The Fed will not, or does not want to control the long end of the curve (long bond).

Interest rates (mortgage rates) are now rising and have been there long enough to start affecting the real estate market.

As reported by Uneducated Economist, there’s been a shift in behavior of his lumber customers.

Instead of furiously attempting to secure lumber (as prices continue to rise), now, there’re backing off; Not wanting to be holding overpriced inventory if/when there’s a reversal.

Remember:

Sentiment first. Then volume. Then direction

From way across the pond, Bjorn Andreas Bull-Hansen gives his input that ‘Things are changing … the entire structure of society’.

He also sates, as this site has done many times … ‘it’s not coming back’.

Has all this fed into the markets?

Let’s take another look at the S&P 500 (SPY), analyzed on the 15th.

At that time, we stated the SPY’s at the danger point.

The original location of that analysis is the orange arrow. Indeed, the SPY continued a brief rise before reversing.

Downward pressure (thrust energy) has increased.

Unless it’s a flash-crash, markets do not go straight down.

The SPY shows a nascent reversal. Price could come back to test resistance (black line) or continue to decline from here.

It’s important to note the overall market position (of the large indices) as they affect everything else.

With that, our focus remains on biotech (IBB) as it appears to be the weakest of the major sectors (not advice, not a recommendation).

Sunday futures open in a few hours.

Stay Tuned

Charts by StockCharts

Note:  Posts on this site are for education purposes only.  They provide one firm’s insight on the markets.  Not investment advice.  See additional disclaimer here.

S&P 500, Danger Point

Early in the pre-market, SPY is trading unchanged.

Looking at the daily SPY close, we’ve got a tentative breakout just above resistance (black line).

Lower right of the chart shows upward thrust energy has declined significantly … right along with volume.

Yesterday’s update showed longer term momentum (monthly, weekly) for the S&P was pointed up. Continued price action drifting higher is possible.

However, if there’s a reversal in the making, this is a good place to start.

The buyers (volume) have backed off at this level; leaving the SPY hanging just above breakout resistance.

The SOXX, QQQ, and IBB are well off their highs and may be leading the way lower. Our focus remains on shorting biotech IBB, which is the weakest of the three (not advice, not a recommendation)

Charts by StockCharts

Note:  Posts on this site are for education purposes only.  They provide one firm’s insight on the markets.  Not investment advice.  See additional disclaimer here.

S&P 500: Downside Target

If the analysis is correct and the S&P’s completing a terminating wedge, then we have a downside target.

The measured move is around 330 – 333. Reaching that level would put the SPY down about 16% from all-time highs.

If that happens, expect the usual suspects (the financial press) to say, ‘well, a bear market is 20% or more … so we’re good’.

Let’s see how that works out.

Charts by StockCharts

Note:  Posts on this site are for education purposes only.  They provide one firm’s insight on the markets.  Not investment advice.  See additional disclaimer here.

Real Estate … Implosion?

Watching J.B.’s (Jerimiah Babe’s) Los Angeles walkabouts, proves commercial real estate’s already imploded.

The instant the linked video starts, we see the root of the problem.

Neo-feudalism.

Of course, it’s all part of the plan but that’s a topic for another time.

What’s shown in J.B.’s video(s) is that one after another, commercial properties are boarded up and fenced off.

One might think it’s only progressive utopia California that’s having a rough time; taking a look at comments to his videos shows otherwise.

Just one example taken from the video link:

“Even if the U.S. lifted all lockdown restrictions 100% TODAY, I still think for many companies, its too late.”

The economy is not coming back … not in our lifetimes anyway.

No matter what happens, re-building will take many decades. Even so, the destruction has to be completed first.

We’re nowhere near downside end (economy, markets or otherwise).

On Thursday you would’ve thought from the news, we just collapsed by 50% or more. In fact, the S&P (SPY) was only down -2.41%.

Think about what happens we get the hit … that does not come back.

As early as May 12th of last year, this site began to note the similarities of the markets to August of 1987. In retrospect, that post (and the ones that followed) seemed a little premature.

It’s a different story now.

Markets even more extended; bond rates higher.

Throughout the years, going back to the early 1900’s, the professionals always preferred down markets. Profits (and fortunes) can be made much faster and with more reliability.

Fear is much easier to gage (on the charts) than greed.

With that in mind, we can look at real estate with a clear head and assess the opportunities.

It turns out, not only has IYR got itself into a terminating wedge, it’s doing so at Fibonacci time frames.

During the past six-weeks, my firm (link here) has been positioning in and out, and back in, several times using short fund DRV (not advice not a recommendation).

Just yesterday, before IYR broke decisively lower, that DRV position was increased to its maximum level thus far.

Obviously, a new high in IYR is not anticipated. The reason for selecting real estate as a strategic short (unlike the LABD swing trade) is for the downside potential.

Inverse leveraged funds work best during a sustained, directional move. It remains to be seen if DRV was a good selection; not only for a trade vehicle, but for the anticipated collapse in real estate.

Stay Tuned

Charts by StockCharts

Note:  Posts on this site are for education purposes only.  They provide one firm’s insight on the markets.  Not investment advice.  See additional disclaimer here.