The 2021 Top

Empirical data shows market tops tend to occur before, during, or just after a holiday week.

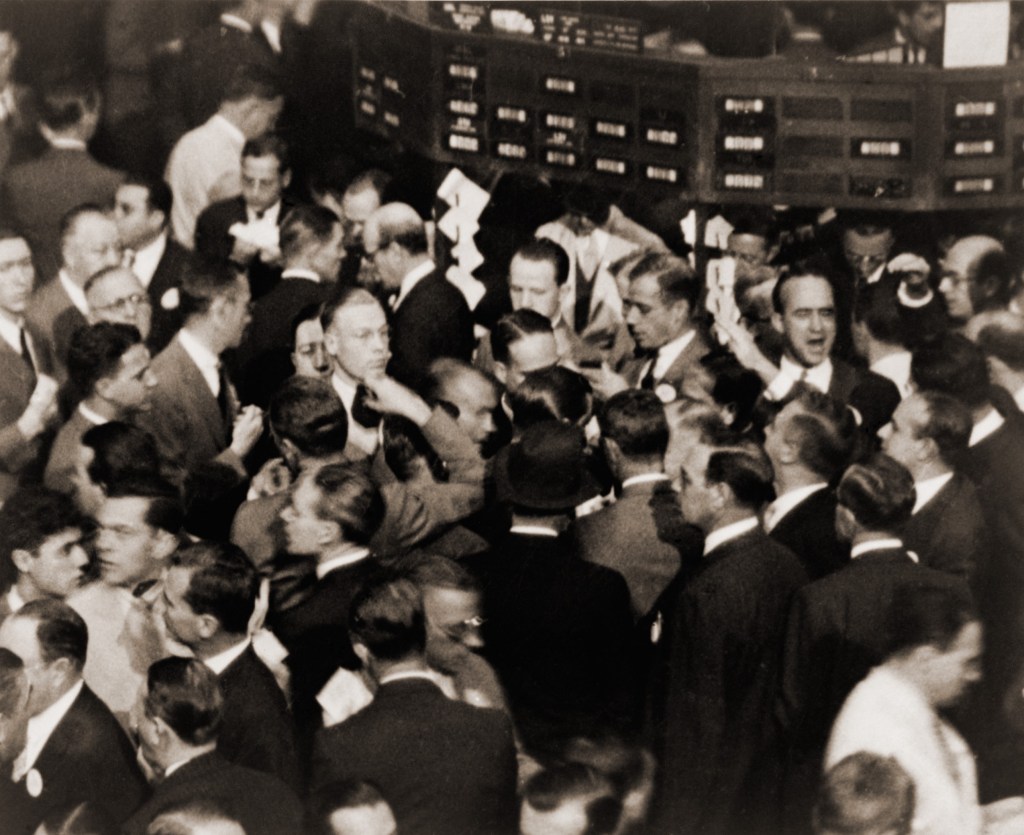
Probably the most famous market top, was September 3rd, 1929.

That top was the Tuesday following the Labor Day weekend.

Now, we have another potential Tuesday top; February 16th. The Tuesday following the President’s Day Weekend.

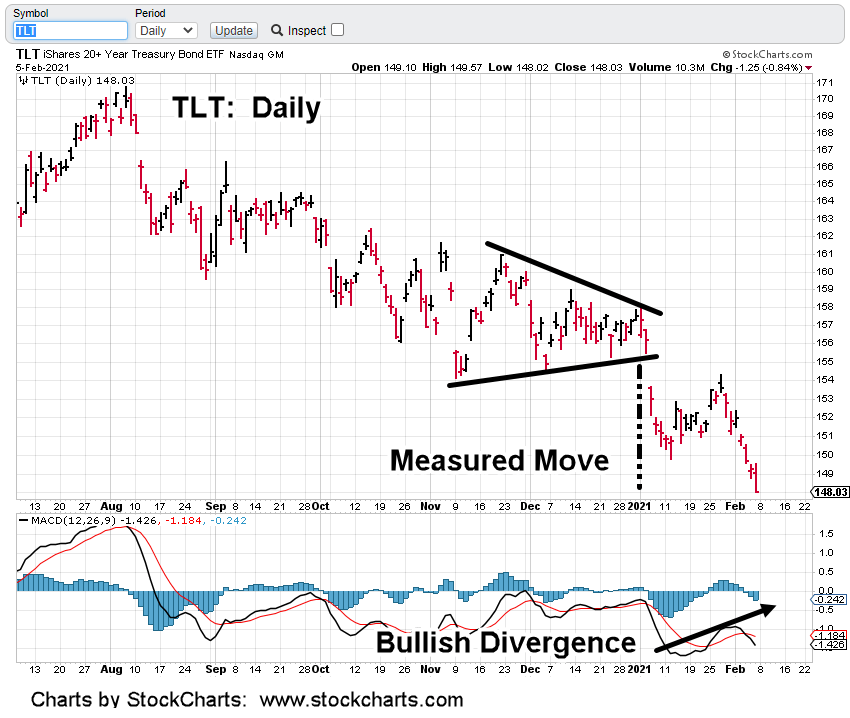
While shiny object distractions abound; Game Stop (GME) hearings, Silver (SLV) squeeze, Bond (TLT) rout and more, the market may have quietly and without fanfare, put in the highs for the year.

Judging from the internet and YouTube chatter, everyone’s expecting some type of immediate crash.

Well, since everyone’s expecting it, it’s not likely to happen. Or more accurately, not the way anyone expects.

The last meltdown about a year ago was pretty much a straight-down affair. If we’ve seen the highs, what happened last time won’t happen this time.

That leaves at least two options:

  1. Gap down 15% – 30% or more, overnight.
  2. Slow, grinding decline, hardly noticeable until one day …

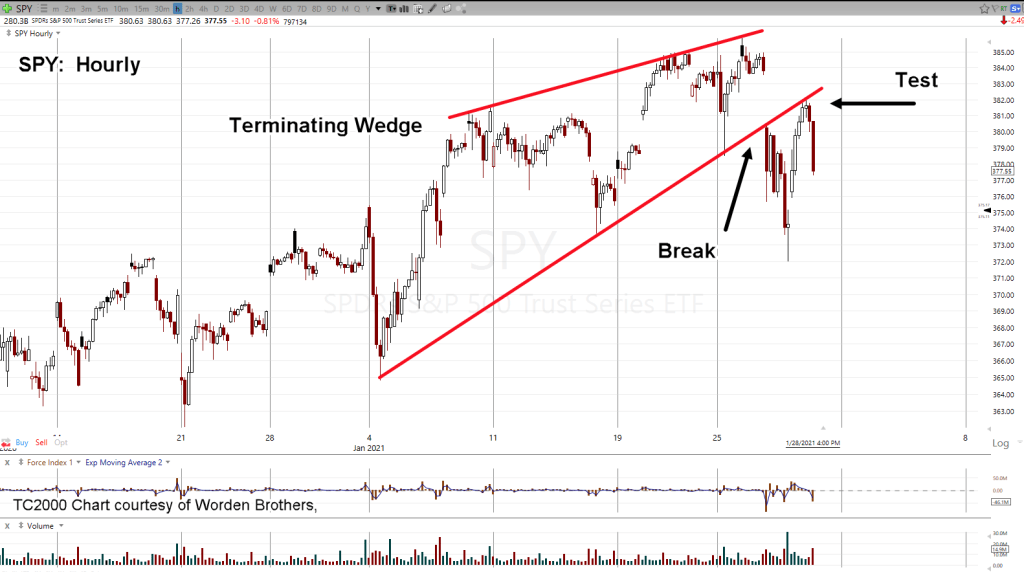
The chart of SPY below shows a possible Head & Shoulders, top formation. It’s still very early in the chart as even the head of the pattern’s not yet complete.

Nonetheless, it’s important to be ahead of the game and anticipate the next moves of the market.

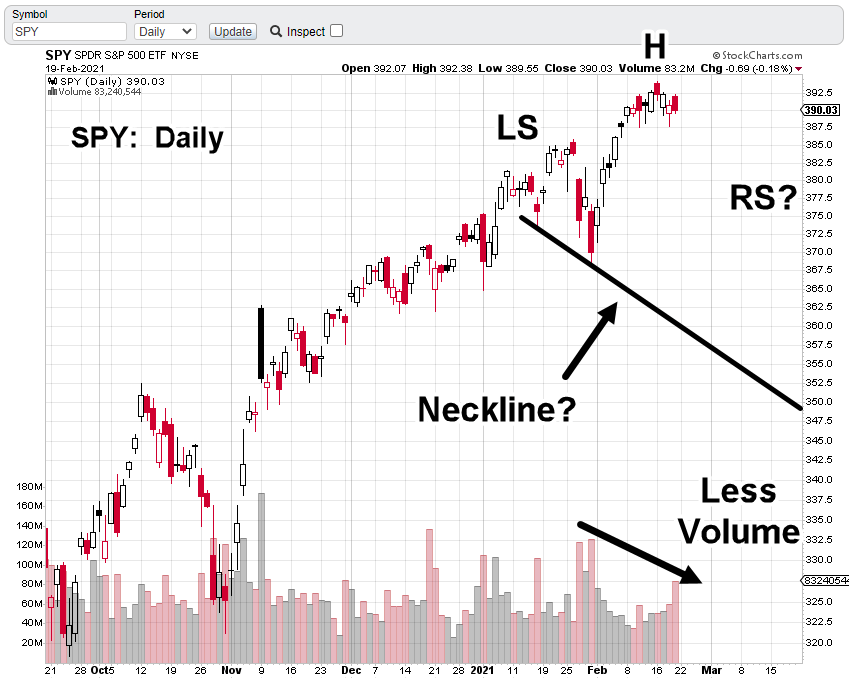
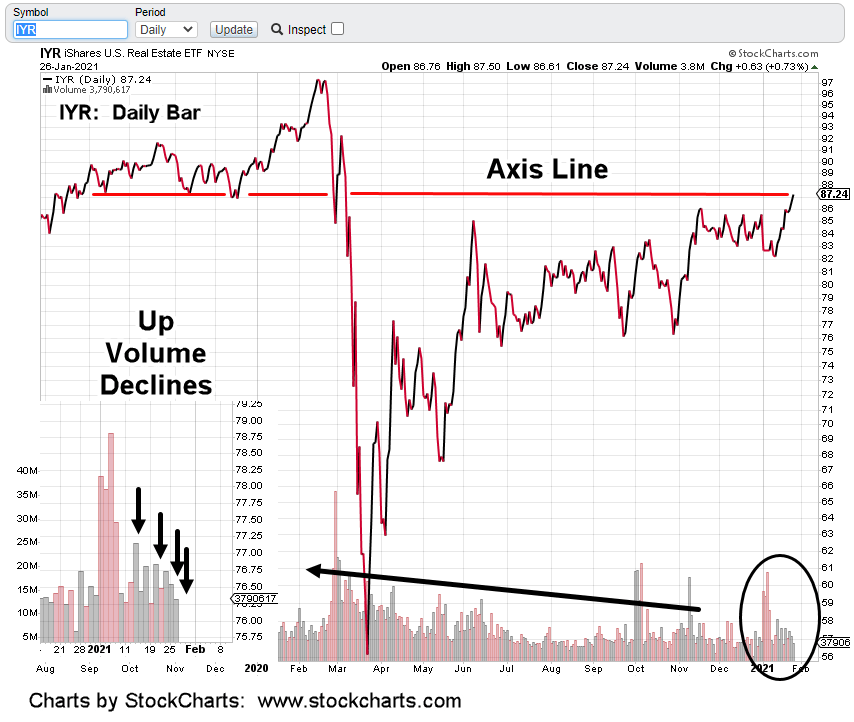
Note the volume’s tapering off as we get into a possible head formation. If there’s to be a Right Shoulder, a textbook case will have volume fall away even more.

It’s about a half-hour to go before the open. SPY is trading down -0.65% to -0.80%, while TLT is unchanged.

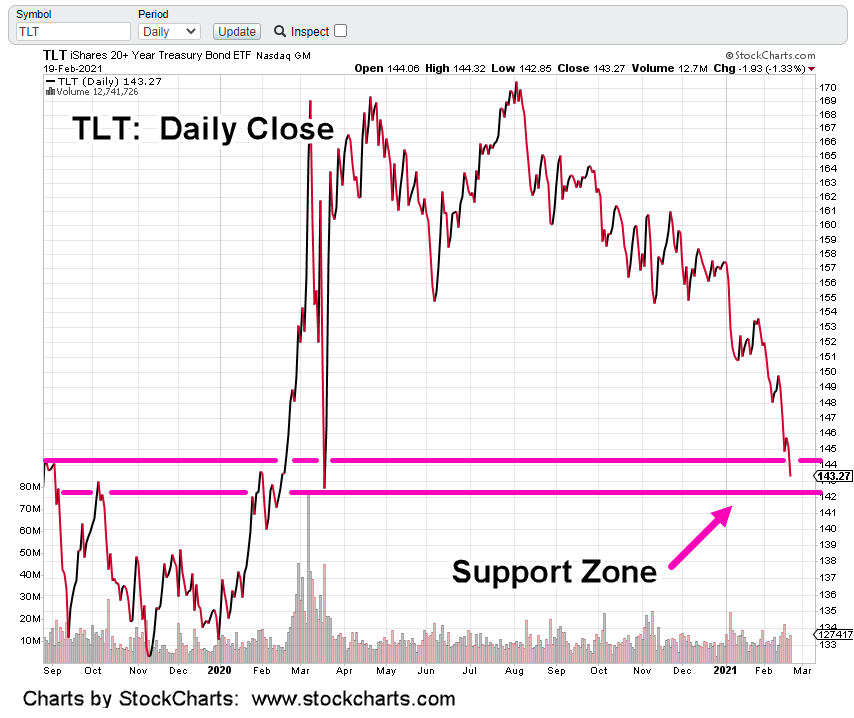
If TLT makes a new daily high above 144.32, it’s a good sign we may have seen the bottom of that market.

Stay Tuned

Charts by StockCharts

Note:  Posts on this site are for education purposes only.  They provide one firm’s insight on the markets.  Not investment advice.  See additional disclaimer here.

Finally, Inflation Shows Up

Its been nearly twelve years exactly since the market bottom of March 9th, 2009.

At that time gold tracking fund GLD, was trading around 90.

Today, it’s at 167, a gain of about 85%.

Gold futures for April ’21, closed this past Friday at 1,777.4

Either way, it’s a far cry from the $10,000/oz. that has been bandied about for what seems like forever.

Prices for energy and food are rising because of reasons not discussed in the financial media.

That media is certainly not going to educate the public.

In turn, that public has shown there’re certainly not going to educate themselves. If they were awake, news channel ratings (in the link) would be at zero.

Unfortunately, this time around, the game’s up.

The ongoing collapse will decimate those who refuse to wake up and will probably take some of those who are, with them.

Which brings us to the so called inflation, at hand.

What can be said? We can call it lies, misinformation, propaganda but none of those really get to the root.

Input prices are rising not from inflation, but from supply constriction and disruption.

For example, the corporate (big-Ag) food supply chain as reported on many times, is intentionally being destroyed. The result of course, prices go higher.

We’re also in a quiet sun-cycle period that only serves to help with (cold) weather extremes. The only discussion from the media concerning the weather is that’s it’s getting warmer, right? Opposite of reality.

So we’re taking that ‘opposite of reality’ as a contrary indicator.

Whatever inflation we’ve got after nearly twelve years, is probably at or near a peak … ready to head lower.

That includes the market as well. The likely outcome:

Market down, bonds up.

The daily close of long bond TLT, has it in a support zone. One attempt has already been made to position long via TMF (not advice, not a recommendation) as detailed in this report.

Once again this past Friday, another TMF entry.

Both bonds and the markets (i.e. S&P 500) are at opposite extremes. The risk of loss in bonds may have reached its nadir.

Charts by StockCharts

Note:  Posts on this site are for education purposes only.  They provide one firm’s insight on the markets.  Not investment advice.  See additional disclaimer here.

Bonds: Measured Move, Met

From the wedge breakout to the downside, Friday’s action in TLT has met the measured move.

Price action finished at the low of the day (+0.01) and is posting a bullish MACD divergence.

On the other end of the spectrum, the S&P 500 finished at all time highs.

Intuitively, we can see how this is setting up.

Each market is at an extreme. That includes real estate, IYR at its own 76.4%, retrace … although severely lagging the S&P.

Unfortunately at such junctures, we can expect some type of ‘incident’ to set things off in the opposite direction.

It may not happen but if it does, the markets define the news; not the other way around.

Stay Tuned

Charts by StockCharts

Note:  Posts on this site are for education purposes only.  They provide one firm’s insight on the markets.  Not investment advice.  See additional disclaimer here.

S&P 500: Trend Break, Test

Yesterday, the S&P tested its trend breakout and then reversed.

This morning’s pre-market action is down again.

The teminiating wedge is clear. Then a decisive break with an upward test. Late in the session that test was rejected and the market headed lower.

That scenario could have easily been from 1931’s stock market action, not 2021.

Buried within the Wyckoff training course material (first published 1931), available here, is a statement to the effect:

‘When a market breaks a trend decisively and with volume, there’s nearly always some type of rally to test the break.’

That’s exactly what we got yesterday. Now, the S&P (SPY) is in a wide pre-market range but essentially trading lower.

A terminating wedge is typically the last stop in a move; whether it’s up or down.

The S&P could of course rally from here. At this point, probabilities favor lower; at lest to a measured move target in the vicinity of 368, for SPY.

Note:  Posts on this site are for education purposes only.  They provide one firm’s insight on the markets.  Not investment advice.  See additional disclaimer here.

All Markets Down

Pre-market action has all major indexes trading lower; SPY, DIA, QQQ, SOXX and IWM; all down.

Real estate, IYR has no real pre-market volume (20-shares) so its open is unknown. However, inverse fund DRV, does have volume (3,700 shares) and its action is up about 4%.

The daily close chart of IYR (above), has price action contacting an established axis line.

That was yesterday. Over the past two-weeks, as price ratcheted higher volume has declined (circled area enlarged).

That decline indicates lack of commitment at these levels.

Yesterday’s close also put IYR firmly in up-thrust position (ready for reversal).

Over the past week, short positions were opened using DRV (not advice, not a recommendation)

Average price of the short equates to DRV @ 9.92; not far from current pre-market trading.

If IYR posts a new daily low (below 86.62), it’s another data point the anticipated reversal may be at hand.

The rising action has changed the P&F forecast reported a few days back. Updates will be forthcoming.

If this is the start of a sustained reversal, the plan is to build the short position as price action dictates.

The downside of the entire market (S&P, Dow, etc.) is immense. Commercial real estate is especially vulnerable. Price action itself tells us that.

Stay Tuned

Charts by StockCharts

Note:  Posts on this site are for education purposes only.  They provide one firm’s insight on the markets.  Not investment advice.  See additional disclaimer here.

Dow, S&P, Outside Down

So, this is it?

As this juncture (11:06 a.m. EST), both the Dow and S&P have key reversals; and now the QQQs, and Russell 2000, have just joined them.

If they hold and decline from here, reversing from all time highs, we can add that data to our empirical “Holiday Turns

Holiday turns … markets tend to reverse just before, during, or just after a holiday week.

In the biotech arena, this morning’s gap higher (IBB) closed the distance from price action to the stop for inverse funds BIS and LABD.

That closure opportunity was used to increase the short position (via BIS) in one of the managed accounts.  Not advice, not a recommendation.

The IBB bearish divergence is beginning to take shape.

Positions:

Note: “Close” prices as of 11:03 a.m. EST

Charts by StockCharts

Note:  Posts on this site are for education purposes only.  They provide one firm’s insight on the markets.  Not investment advice.  See additional disclaimer here.

Before The Open

In the pre-market (8:52 a.m. EST) action continues to grind higher.  Both the Dow and S&P have posted new highs thus negating the Holiday Turns scenario … but not by much.

Important to note is each market continues to post on the underside of a long-term trend-line.  The Dow chart (DIA) is farther down this post.

Also added to the chart is the dashed trend-line underneath the recent price action.  A wedge is being formed; typically last stop before reversal.

In other markets, looks like Biotech may continue higher but along with the others, action appears labored.

The short position could be stopped out at the open. 

This area of price action is where cost of being wrong is least.  We’re at The Danger Point.

Update: 9:04 a.m. EST: Both AMGN and MRNA have now posted lower in pre-market.

Stopped out does not mean there’s no opportunity.  The bearish MACD divergence is still there.

If IBB continues higher, the original ‘150’ target is back in play.

The market extremes are still there:  Bonds and the Dollar are short the most in history.  Stretched all around.

It’s not unreasonable to expect several attempts to position short.

Charts by StockCharts

Note:  Posts on this site are for education purposes only.  They provide one firm’s insight on the markets.  Not investment advice.  See additional disclaimer here.

June 5th, 2008.

That was the day where the bear market began in earnest.  After that day, it never looked back. 

The final posted low was 666, on March 6th

Let that sink in for a while:   Six-six-six, on the sixth.  There is much more going on than the general public realizes.

We wrestle not with flesh and blood …

Getting back to that day on June 5th, those old enough will remember the market had been trending lower for about three weeks.

Then, on Thursday the fifth, there was a huge rally.  The S&P moved up over 2% on the day.

This rally as it turned out was just short covering.  The next day, price opened gap-lower and moved swiftly lower to new daily lows.

The move down was about -3.5% on the day.  There was no denying at that point, it’s a bear market, potentially a crash (which it was).

Is that same scenario what just happened today, Friday?

Looking at the analysis that Sajad put out on August 15th   He showed “there’s one final move to go”: Time stamp, 5:20

His quote is shown on the chart.  Indeed, the Dow 30, the DIA, had one more move to go before reversal.

If the coming Monday, opens gap lower and posts a new daily low, the market is performing in a way that’s similar to June 5th of 2008.

Charts by StockCharts

Note:  Posts on this site are for education purposes only.  They provide one firm’s insight on the markets.  Not investment advice.  See additional disclaimer here.