Note: Posts on this site are for education purposes only. They provide one firm’s insight on the markets. Not investment advice. See additional disclaimer here.
The last update on ProLogis, PLD, proved to be (somewhat) incorrect.
There was no definitive assessment on direction, but from the sidebar, one could see an open short position in sector index IYR, as DRV-25-01.
That short was closed nearly immediately at the next session as PLD, ratcheted higher along with IYR.
Since we’re at ‘-04’, increment on DRV, there have been four attempts to position short with DRV-25-04, currently open (not advice, not a recommendation).
Gain/loss (all positions) is near break-even, at -0.38%
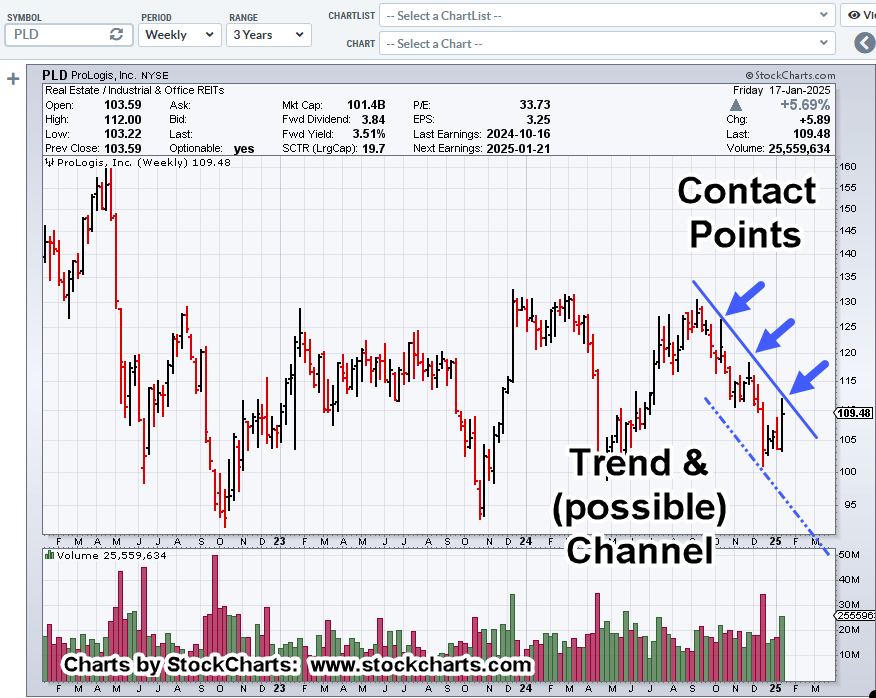
All of which brings us to ProLogis … again.
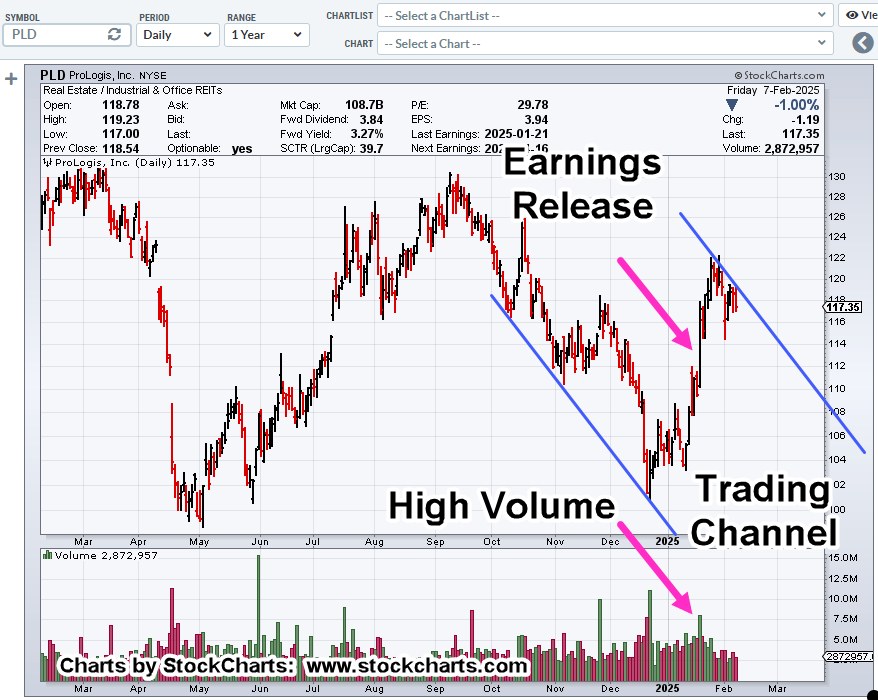
ProLogis, PLD, Daily
There’s a lot going on in this chart.
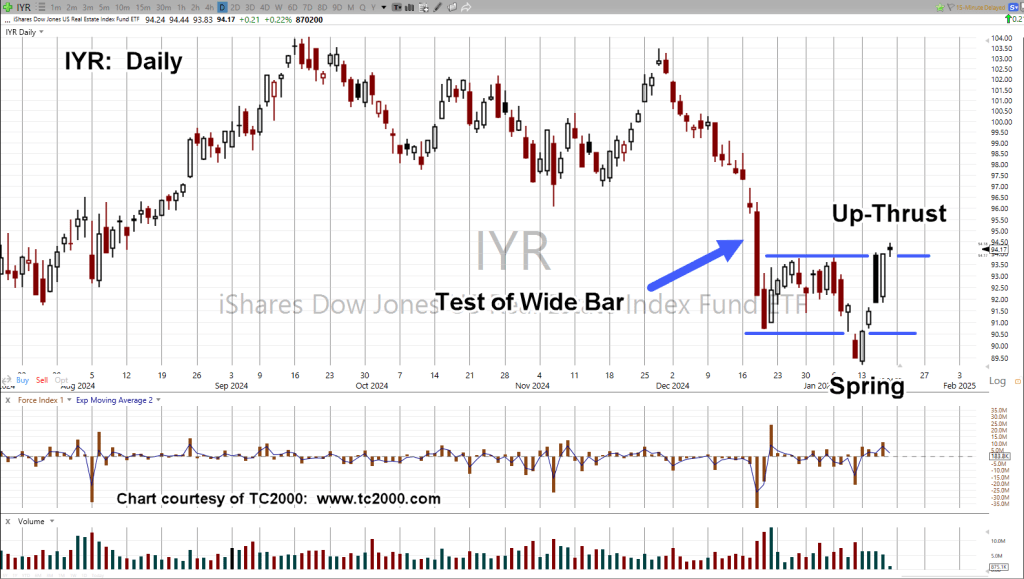
The last earnings release for PLD, resulted in a wide bar on heavy volume.
Nearly instantly, and from a Wyckoff standpoint, we should know what that means … or what is probable:
The wide bar, volume, are likely to be ‘tested’ (not advice, not a recommendation).
Next update, we’ll discuss the Up-Thrust (reversal) condition for PLD.
Note: Posts on this site are for education purposes only. They provide one firm’s insight on the markets. Not investment advice. See additional disclaimer here.
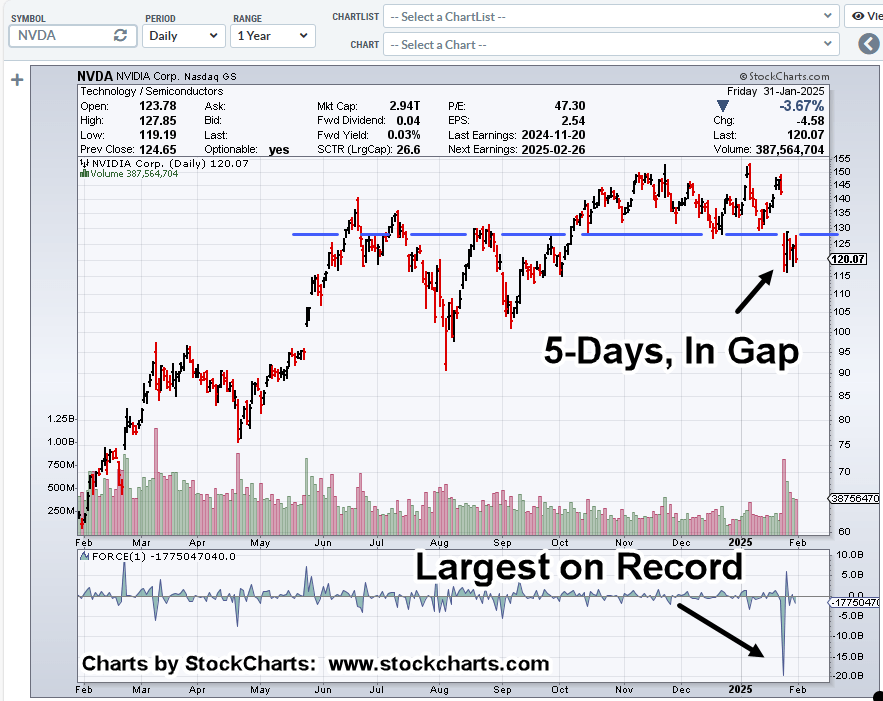
The gap-lower open Monday, January 27th, was only retraced by a Fibonacci 23.6%, the next day before continuing lower.
If that percentage holds, it’s a rare occurrence and represents extreme weakness (not advice, not a recommendation).
The chart for NVDA, shows we’ve had the largest down-thrust energy in history (NVDA began trading 1/22/99).
Now, it’s hanging below resistance (blue line).
Nvidia NVDA, Daily
Last Friday closed lower; after-hours, lower, still.
Strategy, Tactics, Focus
As the ‘About‘ section says, techniques on this site are laid out by three masters and coached, mentored, by one of, if not the best in the industry (the late David Weis).
With that said, everyone has their own style.
Currently short the sector via SOXS, as SOXS-25-04 (not advice, not a recommendation).
Note: Posts on this site are for education purposes only. They provide one firm’s insight on the markets. Not investment advice. See additional disclaimer here.
On the daily bar-chart (not shown), we have a massive gap-lower open.
Will that gap be filled or is this a real breakaway and the start of a long-sustained bubble deflating decline?
That of course, is unknown.
What is known and presented on this site, Wyckoff analysis, with its century old technique, spotted the potential for reversal well ahead of the actual fact (not advice, not a recommendation).
Final Note
As the sidebar shows, since the beginning of this year, there have been several attempts to position short in the SOXX via leveraged inverse fund SOXS.
Trades SOXS-25-01 (not discussed), and SOXS-25-02, were first, then closed, with trade SOXS-25-03, opened last Friday (not advice, not a recommendation).
Note: Posts on this site are for education purposes only. They provide one firm’s insight on the markets. Not investment advice. See additional disclaimer here.
During the internet bubble of the 2000s, after the trend break in the QQQs, price action immediately began its long (multi-year) descent.
Naturally, it would follow when comparing that bubble, with the A.I. bubble, as was done here, one would have thought once the trend is broken, down we go.
Not so, today.
Instead, we have depending on how it’s measured, at least ten-weeks (so far), testing of that break.
Is it all about to change? Are we at ‘tests’ end?
Semiconductors SOXX, Daily Close
The most recent update showing the ‘trend break’ as discussed above, is here.
The chart below, presents a possible ‘last gasp’ for the SOXX (not advice, not a recommendation).
From a Wyckoff analysis standpoint, the market ‘by its own action’, has told us the axis line above, is important.
If the chart is correct and we’ve had a false breakout (Wyckoff Up-Thrust), the expectation is for downside follow-through (not advice, not a recommendation).
Note: Posts on this site are for education purposes only. They provide one firm’s insight on the markets. Not investment advice. See additional disclaimer here.
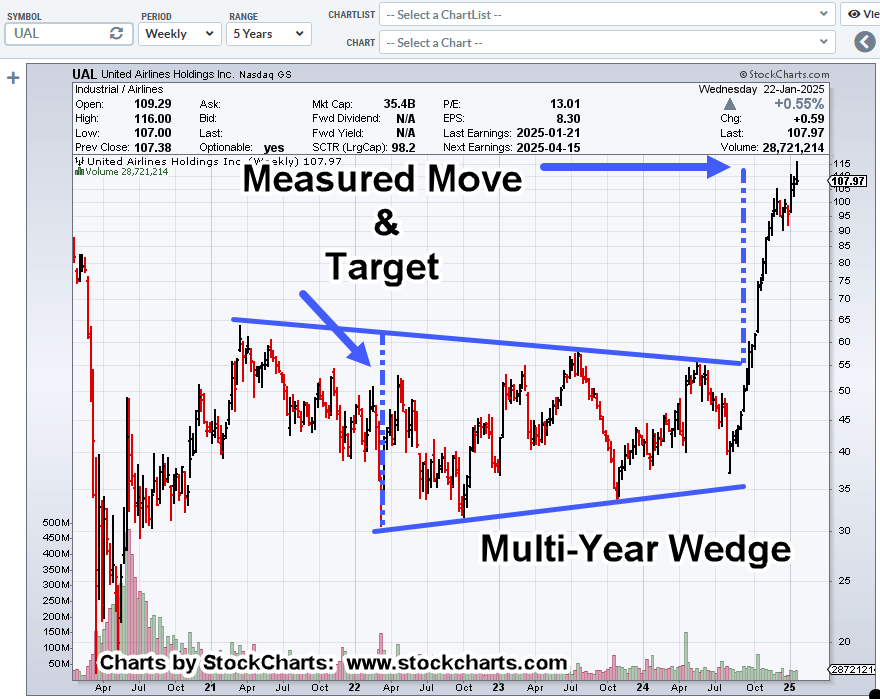
Looking at United Airlines (UAL), with the precise set-up, four-year wedge, measured move, the top, timed exactly at an earnings release, you have to ask yourself …
Was it all part of a (secret) plan?
Wyckoff Writes on Manipulation
Way back in 1910, Wyckoff wrote the following concerning manipulation (emphasis added, quote used with permission).
“Manipulators are giant traders, wearing seven-leagued boots. The trained ear can detect the steady ‘clump clump’ as they progress, and the footprints are recognized in the fluctuations and quantities of stock appearing on the tape.”
United Airlines UAL, Weekly
When looking at the chart, it all makes sense … it just took over four years to play out.
Note: Posts on this site are for education purposes only. They provide one firm’s insight on the markets. Not investment advice. See additional disclaimer here.
When looking at the chart, we see a potential upside breakout (blip) from the wedge.
From an experience standpoint, extremely narrow wedge patterns posting near or at the apex before breakout, rarely if ever, produce a lasting move (not advice, not a recommendation).
We could get more of the ‘blip’ higher. However, a ‘blip’ is not a directional move. 🙂
Jawboning The Market
Anyone dictating what the market will or won’t do or what it should do (in the opinion of your website host) is misguided, or inexperienced.
The market itself decides what it’s going to do.
As Wyckoff said a hundred years ago (1902, to be exact), the market is moving based on its ‘own forces’ that are not connected to valuations.
Note: Posts on this site are for education purposes only. They provide one firm’s insight on the markets. Not investment advice. See additional disclaimer here.
Note: Posts on this site are for education purposes only. They provide one firm’s insight on the markets. Not investment advice. See additional disclaimer here.
Click on the side bar under the same name to see all posts related to this set-up.
Note: A set-up does not guarantee anything.
It’s just a market observed phenomenon that may result in a directional move (not advice, not a recommendation).
Real Estate IYR, Daily
There it is:
This is what’s called The Danger Point®
The risk of being wrong on a short position is at its least (not advice, not a recommendation).
Positioning (updates)
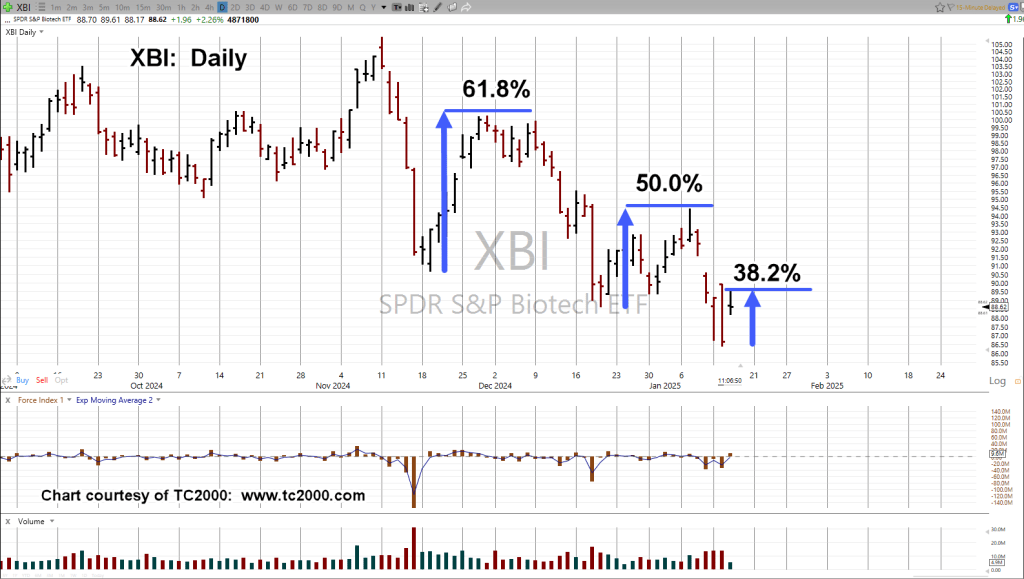
Biotech XBI is spending a lot of time hovering around support and not progressing downward (no matter all the Fibonacci correlations).
With that, LABD-25-01 was closed at slightly above break even (not advice, not a recommendation).
Real estate IYR was entered short early in the session via leveraged inverse DRV, as trade DRV-25-01. Stop for the trade is currently the session low. (not advice, not a recommendation).
Note: Posts on this site are for education purposes only. They provide one firm’s insight on the markets. Not investment advice. See additional disclaimer here.
Note: Posts on this site are for education purposes only. They provide one firm’s insight on the markets. Not investment advice. See additional disclaimer here.