Gold Miners … The Reversal

Each Peak Is Lower

Gold’s reversal or potential for reversal, has already been covered here, here and here.

We’re going to focus on the Junior Miners GDXJ but start first, with an updated chart of gold (GLD).

Gold GLD, Weekly Close

This is how it looked back on April 15th.
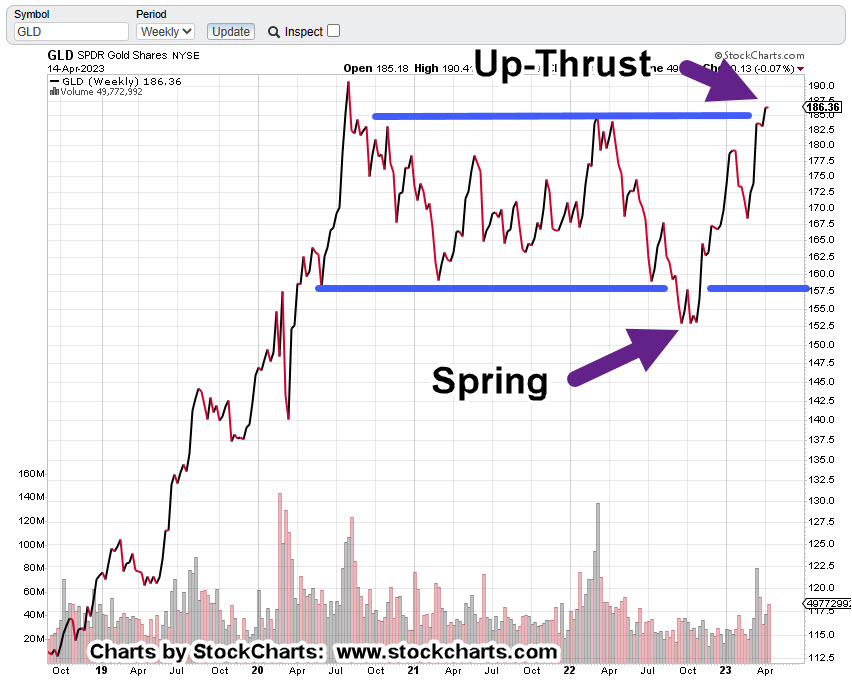
As of the close yesterday, we have this:

It’s arguable GLD, is now below the resistance line (completing the Spring-to-Up-Thrust) but that’s not the most important part from a trading standpoint.

When looking at the Junior Mining Index GDXJ, there’s an ominous pattern.

Junior Miners GDXJ, Weekly Close

Each extreme peak over the last three-years has been labeled; the Derecho of 2020, the so-called Ukraine ‘invasion’, and now, the banking crisis.

Note: The SVB bank failure was on March 10th. There was a ‘knee-jerk’ reaction by the public into gold and related components … that peak appears to have stalled at the location shown.

What’s going on is obvious; it’s a bear market.
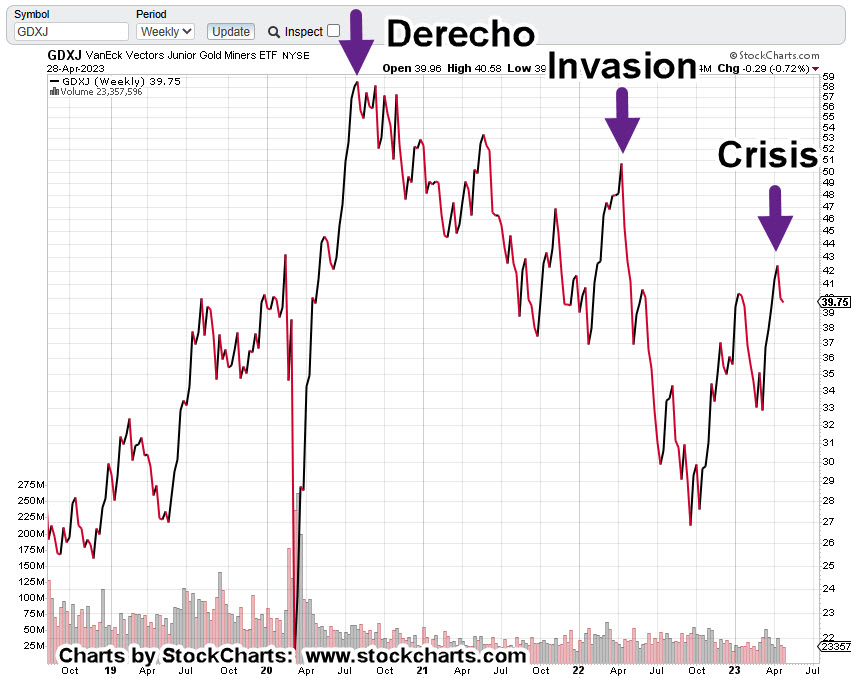
Each major peak, lower than the last.

Now, the interesting part.

The Junior Miners are in Wycoff Up-Thrust condition.
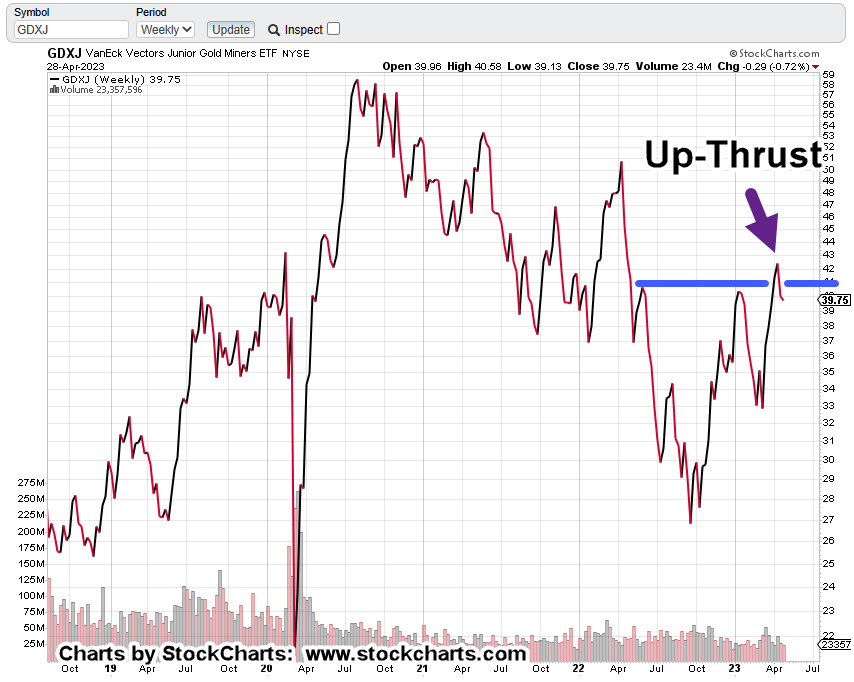
In this case, price action’s solidly below the resistance line.

Looking at the daily (not shown), there may have been a ‘test’ of resistance this past week for a move higher; if so, it failed and GDXJ closed slightly lower.

Summary & Positioning

So, here we are: The market (SPY) has rallied over the past week, giving the illusion that all is well.

However, it too is now in up-thrust (reversal) position.

For my business accounts, it looks like being short the miners at this juncture is lower risk than being short biotech (not advice, not a recommendation).

Typical short vehicles that could be used (not a recommendation) are DUST and JDST.

As always, anything can happen. If the markets ‘implode’, they might be closed for any number of days or weeks.

Stay Tuned

Charts by StockCharts

Note:  Posts on this site are for education purposes only.  They provide one firm’s insight on the markets.  Not investment advice.  See additional disclaimer here.

The Danger Point®, trade mark: No. 6,505,279

Short Squeeze … Biotech

Running The Stops

It looks like we’re in a squeeze with price action screaming higher.

As shown in the last update, the LABD hard stop was @ 16.79 (not advice, not a recommendation).

With that said, the entire short position was exited at 16.7501, early in the session.

Overall gain was around 3.96%

With the housekeeping out of the way, let’s move on to the chart and see where price action’s likely to head next.

Biotech SPBIO, Daily

We’ll get right to the point and show the most likely area to clear out stops and potentially set up for the next reversal.

The moving averages have been left in the chart (not a usual practice) because that’s the focus of the crowd.

In their minds, a close above the 200-Day MA, would be bullish.

If that happens, from a Wyckoff standpoint, we could be in up-thrust (reversal) position.

Fibonacci Time

Also of note: When a Fibonacci sequence becomes obvious, that’s when it tends to fall apart or morph into some other type of sequence.

That may be happening now.

Strategy

As always, price action can and will do whatever is necessary to extract as much from both sides (bull, bear) as possible.

It may contact the 200-MA or not. It all depends on where the most stop oerders are hiding.

Slightly above the recent highs looks like a good area for those stops.

Stay Tuned

Charts by StockCharts

Note:  Posts on this site are for education purposes only.  They provide one firm’s insight on the markets.  Not investment advice.  See additional disclaimer here.

The Danger Point®, trade mark: No. 6,505,279

Mastering The Reversal … Biotech

At The Extreme

We’re about to find out if Biotech’s in a new bull market or at the retrace extreme, ready for reversal.

The last update gave us the big picture on the index; a massive H&S pattern, five years in the making.

A potential trendline was shown on the daily chart of inverse fund LABD. That trend was subsequently negated by price action just hours later.

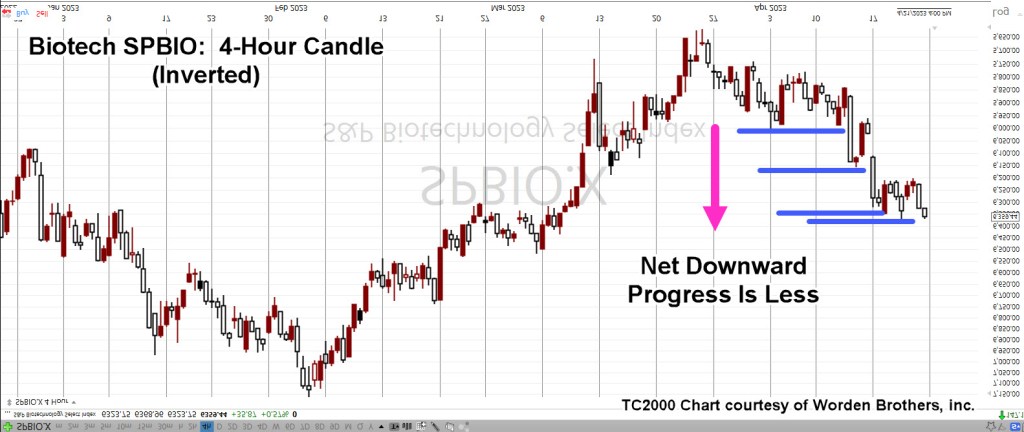
Let’s look at SPBIO, more specifically, the 4-Hour Chart.

To mimic price action of leveraged inverse LABD, we’ll invert the SPBIO.

The reason for inverting, not using LABD, is that leveraged funds have a downward bias which distorts the actual data.

Biotech SPBIO, 4-Hour, Inverted

The chart highlights Point No. 1 and Point No. 2. These areas are identified as a reminder; the prior set-up and reversal was identified, to-the-day.

There’s no guarantee the same performance will be repeated, i.e., spotting the next reversal.

The chart below, shows why we’re at The Danger Point®

Wyckoff discussed a phenomenon he called ‘shortening of the thrust’. When price action’s ready to reverse, the directional thrusts become shorter.

We’ll zoom-in on the recent action to show that Friday’s session failed to post a new daily low (high for non-inverted).

Now new low, may be the reversal nuance or not … we’ll find out at the next open (not advice, not a recommendation).

Not shown on the chart, price action’s retraced a Fibonacci 50%, of the entire move from the set-up and reversal of February 2nd, and 3rd.

Summary

Taking it all in aggregate, we’re obviously at an extreme and either going to reverse from here or launch into a sustained continuing directional move.

Stay Tuned

Charts by StockCharts

Note:  Posts on this site are for education purposes only.  They provide one firm’s insight on the markets.  Not investment advice.  See additional disclaimer here.

The Danger Point®, trade mark: No. 6,505,279
Nat-Gas … New Lows ?

The Tape Is Always Right

The Nat-Gas futures contract for May (NGK23), needs to post above 2.383 soon (in the next day or so), or the contract is at risk of pressing to new lows.

We’ll look at the ETF proxy for nat-gas UNG, below, showing a Wyckoff up-thrust (downside reversal) condition.

As this post is being created (8:51 a.m., EST), the pre-market session shows the futures and UNG, oscillating about unchanged.

Natural Gas UNG, Daily

As with the upside reversal identified in the biotech sector (link here), we’re just reading the tape and acting accordingly (not advice, not a recommendation).

With that said, a trade was executed and closed in leveraged fund BOIL, with the following details:

BOIL Entry: 3.15

BOIL Exit: 3.45

Profit (Loss): 9.52%

The expectation was for a much larger profit.

However, price action is not behaving as if it’s in a strong up-trend. It’s even at risk of posting new lows as a result of the Up-Thrust condition noted above.

Meanwhile, biotech looks like it’s about ready to reverse.

Stay Tuned

Charts by StockCharts

Note:  Posts on this site are for education purposes only.  They provide one firm’s insight on the markets.  Not investment advice.  See additional disclaimer here.

The Danger Point®, trade mark: No. 6,505,279

Biotech … Testing Resistance

Test & Reverse ?

The Wyckoff ‘spring’ position in biotech was identified correctly.

Two days later, SPBIO launches straight-up.

So, let’s take a look at what’s likely to happen next.

Going way back to 1931 and Wyckoff’s teachings and course material (still available here), he stated:

‘When an up-trend is decisively broken to the downside, more often than not, there’s some type of attempt to rally as a test of that break.’

We’ll use a Fibonacci 3-Day Closing chart of Biotech SPBIO, to see if Wyckoff’s timeless market insight still holds up in today’s world.

Biotech SPBIO 3-Day Close

Starting with an un-marked chart, first.

Putting in the notations with a zoom into the recent action.

Well, it looks like nothing has changed in the last 100-years because there it is. 🙂

Biotech broke down out of its trendline and bear flag of the past five months and has now come back to test that area.

Fundamentals

By this time, we all know the story on this sector. The fundamentals are nothing short of horrific.

Just in case there’s someone new to this site and they’ve not yet got the memo, we’ll add two more to ‘The List‘

Contentious COVID-19 Drugs Are All Anti-Malarial: May Not Be A Coincidence

UK Study Finds “No Evidence” Face Masks Protect Vulnerable Against COVID

As always, it’s the comments from the ‘ZeroHedge Guys’, that are more valuable than the article itself.

Strategy

For my corporate accounts, I’m already re-positioning short via LABD, starting during the last session (not advice, not a recommendation).

The initial entry has been quite small as this market could push a bit higher (lower for LABD) just because of momentum alone.

We see that in today’s pre-market session (LABD down about 2%).

It’s now about five minutes before the open.

Stay Tuned

Charts by StockCharts

Note:  Posts on this site are for education purposes only.  They provide one firm’s insight on the markets.  Not investment advice.  See additional disclaimer here.

The Danger Point®, trade mark: No. 6,505,279
‘Panic’ Into Gold … Reversal Risk

Gold Bulls Exhausted

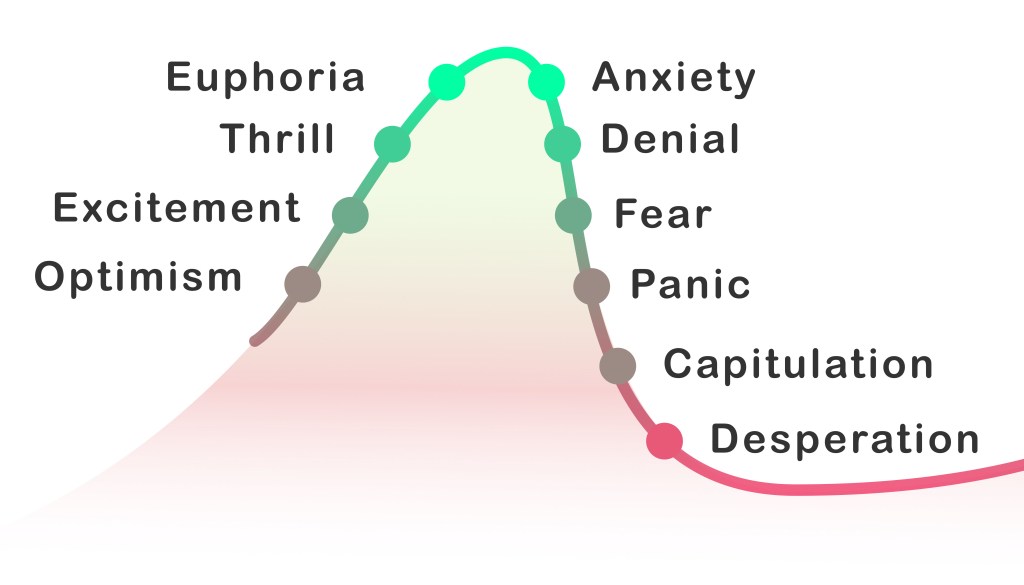
With Friday’s downside reversal we’re now between Euphoria and Anxiety for gold.

This past week was inundated with stories of panic at the bullion dealers.

YouTube ‘content creators’ were going berserk with hyper-inflationist rants; other ‘influencers’ telling us the dollar’s about to collapse; they say the Fed’s the only reason the dollar’s not at zero right now.

Then, rumors warning of gold to $5,000/oz. and higher.

The result as you would expect, is a highly emotional, manipulated public.

Different This Time?

At this point, whether or not the dollar will collapse is probably irrelevant.

Long time visitors to this site already know, battle lines (like here and here) are being drawn and it’s not in precious metals (not advice, not a recommendation).

As always, anything can happen and gold could go higher but with Friday’s reversal, probabilities have now shifted to the downside.

With that, we now have an ominous chart of gold below.

It shows the set-up to a repeating market characteristic:

Wyckoff ‘Spring to Up-Thrust’.

Gold (GLD) Weekly Close

Gold’s momentum wanes just as it’s pushing up through resistance.

Obviously, what happens next is the important part.

Strategy

Looking at the economic calendar for the coming week, there’s a Fed speaker every single day. If we’re really at a significant reversal, next week’s likely to put the panic into unsustainable overdrive and mark the top.

For the bulls, we’re looking for the GLD, highs to be maintained. If it can’t hold, there’s reversal trouble ahead.

A Reversal?

If this is the ‘big one’ and gold reverses, a likely (medium-term) target is in the area of $1,300/oz., – $1,350/oz. (not advice, not a recommendation).

If that happens, gold’s still expensive but it’s the mining sector GDX, GDXJ, that would potentially be devastated.

Both the Seniors and Juniors are already printing an MACD bearish divergence (not yet confirmed) when looking at the weekly charts.

Stay Tuned

Charts by StockCharts

Note:  Posts on this site are for education purposes only.  They provide one firm’s insight on the markets.  Not investment advice.  See additional disclaimer here.

The Danger Point®, trade mark: No. 6,505,279

Nat-Gas … Spike & Reversal

Doing What It Does

Nat-Gas likes to spike at reversals.

In that sense, it’s similar to the silver futures market; it’s just what they do.

A spike does not guarantee reversal.

However, when we get one like today’s early morning (pre-market) session, it’s time to watch and position for what happens next (not advice, not a recommendation).

The futures chart link here, shows the early morning spike to 1.946. Now, we’re getting a recovery and test.

So, What’s Next?

The fundamentals say, nat-gas is lower on ‘over-supply’.

That may be true but here’s where it gets interesting; supply can be ‘destroyed‘ in an instant.

In the above article, the colloquial ‘ZeroHedge Guys’ with astute comments, shed light here and here.

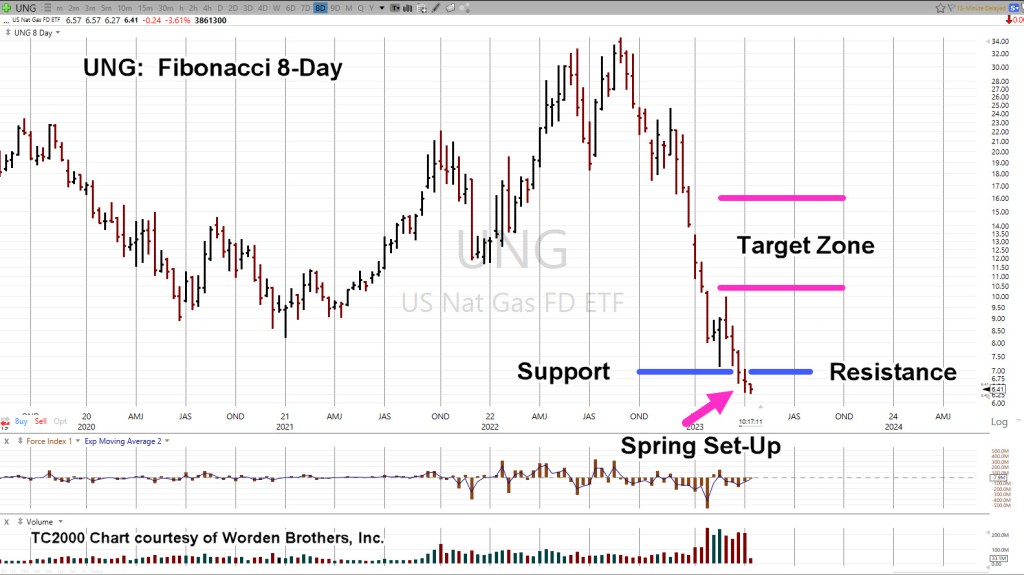
Moving on to the chart of Nat-Gas we’re looking at UNG on a Fibonacci 8-Day, basis.

Natural Gas UNG, 8-Day

The chart shows a Wyckoff spring set-up in progress.

We’ve pushed below support.

Now, early in the session (11:20 a.m., EST), price action is inching its way back to test the resistance.

Positioning long at this juncture is potentially both strategic and tactical (not advice, not a recommendation).

Strategic in the sense, we’re operating in an environment of possible ‘shortage’ and ‘disruption’.

Tactical in the sense, nat-gas tends to reverse on a spike (either up or down).

Probabilities have put the odds to the upside.

Target Area(s)

If nat-gas gets to the target area shown, we can expect the requisite chaos to be part of the picture.

As Livermore frequently said, we’re looking at ‘what is’ and not what we want it to be.

If this is a medium to long-term move, we’re still in the very early stages.

Stay Tuned

Charts by StockCharts

Note:  Posts on this site are for education purposes only.  They provide one firm’s insight on the markets.  Not investment advice.  See additional disclaimer here.

The Danger Point®, trade mark: No. 6,505,279

Biotech … Penetrates & Hesitates

Price Action, The Last Word

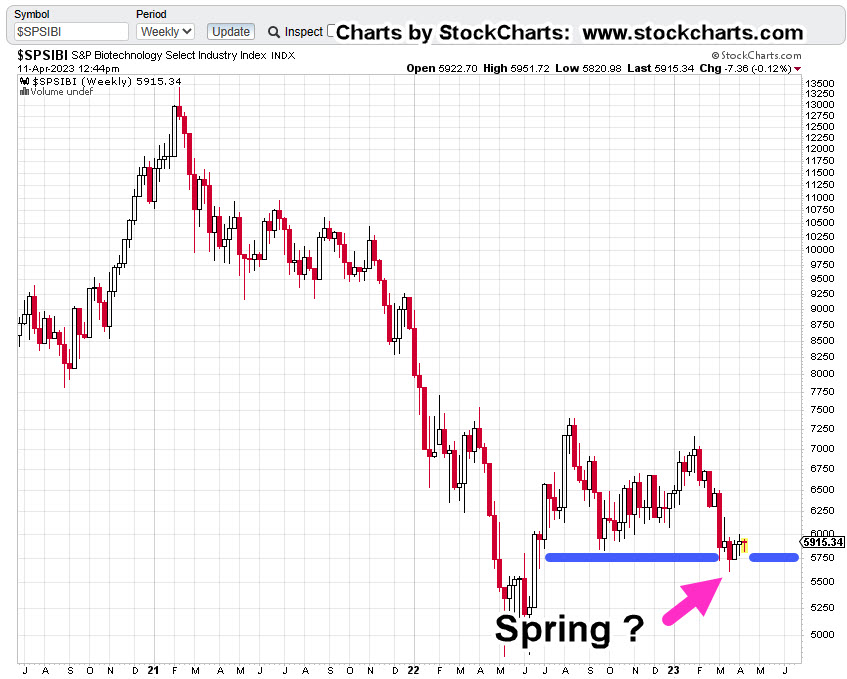
For the bearish case, something’s wrong with price action on biotech SPBIO (not advice, not a recommendation).

As the weekly chart shows, SPBIO has penetrated support and stopped-dead.

Technically speaking, as unbelievable as it may be, we’re in Wyckoff spring position.

Biotech SPBIO, Weekly

Price action penetrates support and hesitates … potentially setting up a rally.

Until there is some indication of downside continuation, all shorts (via LABD) have been exited (not advice, not a recommendation).

Stay Tuned

Charts by StockCharts

Note:  Posts on this site are for education purposes only.  They provide one firm’s insight on the markets.  Not investment advice.  See additional disclaimer here.

The Danger Point®, trade mark: No. 6,505,279

Salt … or … Gold

‘Stacking’, The Right Thing?

“One ounce of gold for half kg of salt”

That’s what it cost for salt during the reign of the Khmer Rouge, as reported by a Cambodian in the comment section at this link.

One-half kilogram, is roughly 1.1 lbs., or 17.6 oz.

One ounce of gold for about 18-oz. of salt … sounds about right … if you’re starving.

Salt is essential for life; gold, not so much.

Strategy, First

This site’s primary focus is strategy.

It has adhered to the premise (for years), we’re in a situation that mimics Genesis 41

That means, it’s the corn and the grain, i.e., food, first, then gold and silver (not advice, not a recommendation).

A brief list for further review is, here, here, here, and here.

The ‘Price’ of Salt

For the ‘stackers’, consider this:

In our example above, the commentor said their family survived in part, because they had “100kg of salt”.

That amount equates to about 220 lbs.

Converting 1oz gold for (roughly) 18-oz. salt, at today’s gold prices, is about $392,000 ‘worth’ of salt.

When they came out other side, the salt may have been gone, but they had the gold. 🙂

Now, moving on to the chart.

Gold (GLD), Weekly

Gold is at a critical juncture.

We’re either in a potential ‘throw-over’ on the wedge formation (with reversal) or about to pressure higher into all-time highs (not advice, not a recommendation).

We see a rising (terminating) wedge, along with a decline in volume (thrust).

We’re at The Danger Point®

Gold’s price action does not need much of a push to go either way.

Then, The Dollar

Recall, from the dollar update (link here), there’s a possibility for it to decline from current levels; potentially setting up a Wyckoff spring condition.

A dollar decline would naturally provide a likely correlation for gold rising into new all-time highs.

If either one happens, there’s probably going to be panic.

Stay Tuned

Charts by StockCharts

Note:  Posts on this site are for education purposes only.  They provide one firm’s insight on the markets.  Not investment advice.  See additional disclaimer here.

The Danger Point®, trade mark: No. 6,505,279

Dollar ‘Collapse’ … The Reality

Reading The Chart

Before we even get started, let’s take a look at the last time there was this much dollar ‘collapse’ hysteria.

The update at this link, shows the analysis of what was likely for the dollar during the previous round of hysterics.

That was over two-years ago and in itself, highlights the ‘strategic’ nature of the analysis presented on this site.

The UUP (dollar index) chart is re-printed below and shows the location of the ‘reversal’ update.

Dollar UUP, Weekly

That was then; so, let’s move on to what could happen at this point in time.

The chart below shows three potential scenarios based on current price action and location.

No. 1

The dollar rallies from here; moving on to test the highs.

No. 2

The dollar continues lower, tests or penetrates the prior lows, then rallies in a Wyckoff spring to the highs and potentially higher.

No. 3

We really do get a collapse.

The dollar breaks the support area, comes back to test the underside and then heads lower.

Hysteria In … Hysteria Out

Of the above three scenarios, which one is going to create the most media hysteria?

A better way to ask the question, which scenario would be the most profitable for those entities that ‘control’ (manipulate) this market?

If the dollar is still in an uptrend and this is just a pull-back, then Scenario No. 2, would likely be the most profitable.

Played Like A Fiddle

Remember, the general public is being played like a fiddle.

The recent and on-going mass exodus from the small banks to the larger ones right into the potential CBDC trap, is a good case in point (not advice, not a recommendation).

So, it could be as well for the dollar in Scenario No. 2

If the dollar heads lower and manages to penetrate support, there’s likely to be media pandemonium.

That would go right along with YouTube grifters losing their minds … all the while, getting those important ‘clicks’.

If it happens, that would be a fantastic, potential set-up for a short-covering rally.

Stay Tuned

Charts by StockCharts

Note:  Posts on this site are for education purposes only.  They provide one firm’s insight on the markets.  Not investment advice.  See additional disclaimer here.

The Danger Point®, trade mark: No. 6,505,279