Beginning at time stamp 6:24, at this link, The Maverick goes through an investigation into NVDA, projections.
‘Something doesn’t add up here ….’
That report was three weeks ago. What’s happened, lately?
As of the close this past Friday, NVDA, the largest in the SOXX, was at $1.1-Trillion, market cap. A distant second, is Taiwan Semi (TSM) at $545.5-Bln.
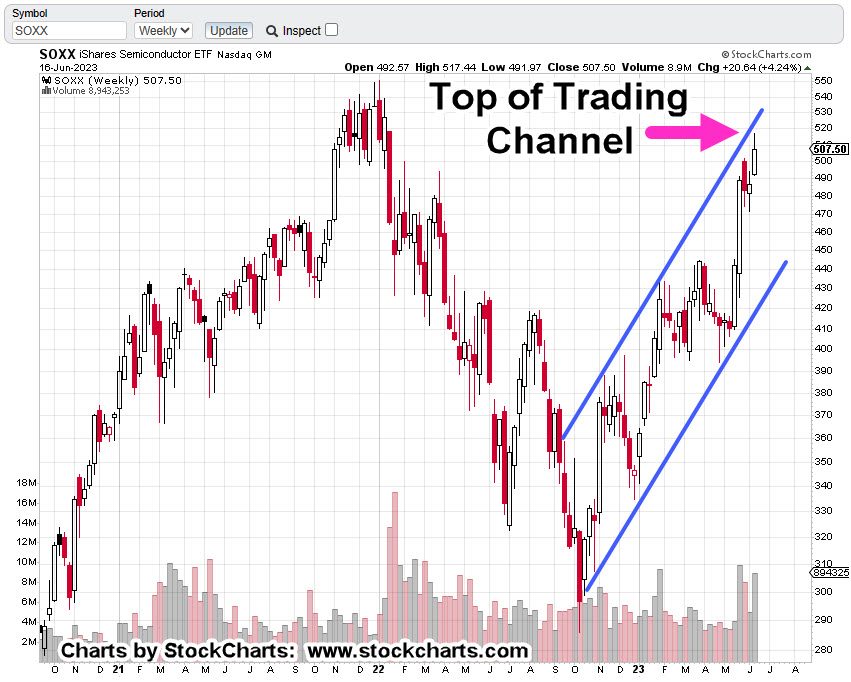
Below, we have a confluence of events for the SOXX.
Semiconductor (ETF), SOXX, Weekly Candle
We’re at the top of a trading channel.
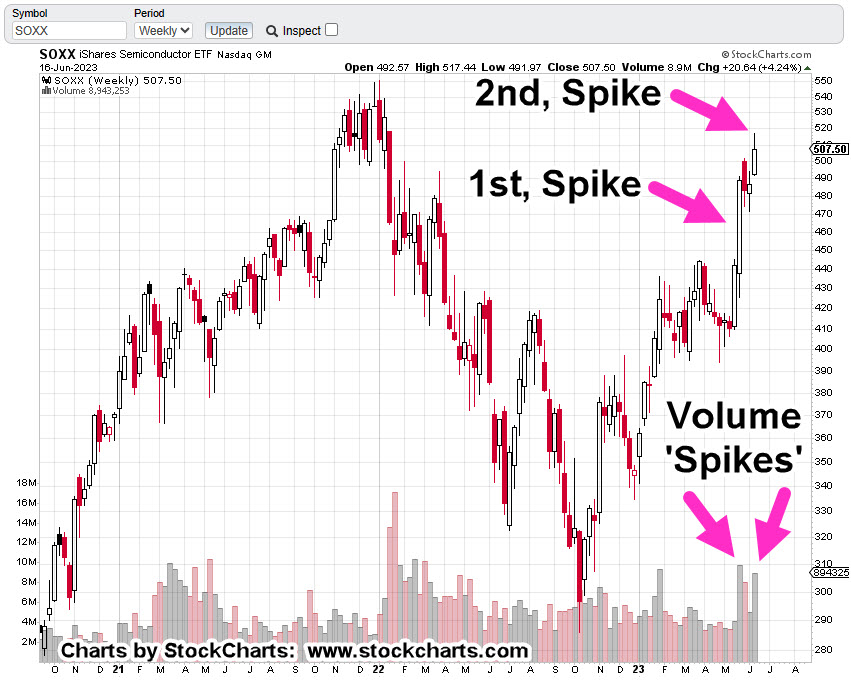
We’re in Wyckoff ‘Up-Thrust’ (reversal) position.
A lot of volume expended with less (net) upward progress than previous volume spike; ‘effort vs. reward’.
Getting down to the daily, we see a terminating wedge that’s coupled with reduced volume.
Semiconductor Index SOXX, Daily Candle
So, what does that mean?
The ‘probabilities’ for more upside are, or have been, reduced significantly (not advice, not a recommendation).
Note: Posts on this site are for education purposes only. They provide one firm’s insight on the markets. Not investment advice. See additional disclaimer here.
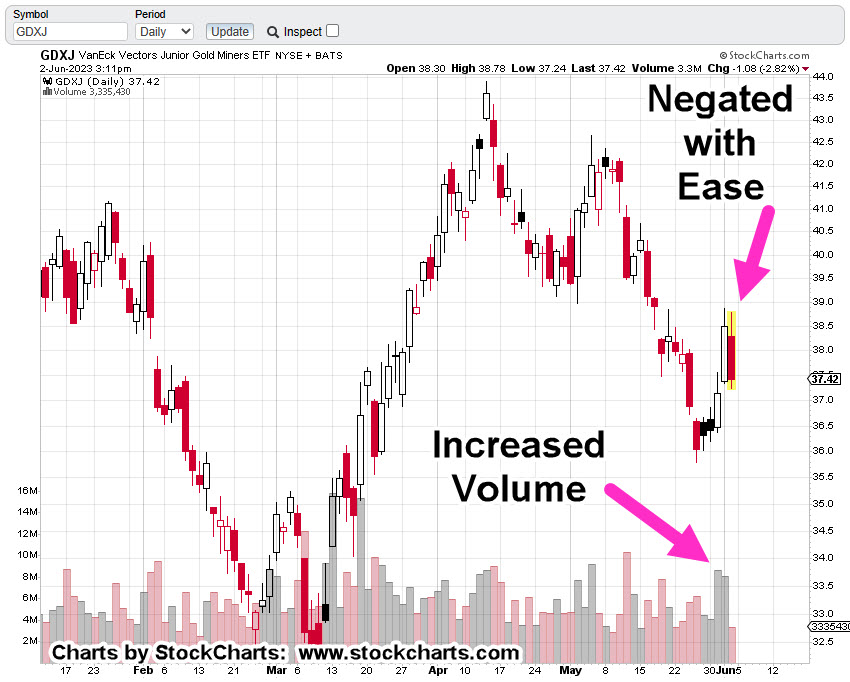
Early in today’s session, the Junior Miners GDXJ, posted a new daily low and new weekly low. That helps the downside probabilities (not advice, not a recommendation).
As mentioned in the prior update, when price action penetrates existing lows, there’s a good chance of ‘spring’ action as a result. The market attempts to rally.
Sometimes it’s successful; other times, not.
The attempt to rally after posting new lows is what GDXJ is doing now (as of 2:15 p.m., EST).
Junior Gold Miners GDXJ, Weekly Bar
In the weekly chart below, note how the close, then open, then close and then open again, are to each other.
That ‘narrowness’ signifies either resistance or support, in this case, resistance.
Where the sector closes for the day may an important clue if we’ll continue to the downside.
Note: Posts on this site are for education purposes only. They provide one firm’s insight on the markets. Not investment advice. See additional disclaimer here.
Note: Posts on this site are for education purposes only. They provide one firm’s insight on the markets. Not investment advice. See additional disclaimer here.
Note: Posts on this site are for education purposes only. They provide one firm’s insight on the markets. Not investment advice. See additional disclaimer here.
You would think with all the handwringing, mental machinations, ‘debt ceiling’, we’re all going bankrupt, YouTube gold grifters et al, gold (GLD) would be in a monstrous rally.
Instead, we have what appears to be exhaustion and non-confirmation.
Gold (GCM23), is the only monetary metal (gold, palladium, platinum, silver) anywhere near its all-time highs.
Old-timers would call it a huge non-confirmation. The other metals are not on board with the ‘inflation’ narrative.
Time and again, we’re back to actually reading price action and having it tell us what’s real, not the mainstream.
So, trading ‘kabuki’ seems to be straightforward; just read the chart. Here’s one explanation from an unlikely source on why that simple task is so difficult: absolute, total, unrelenting focus.
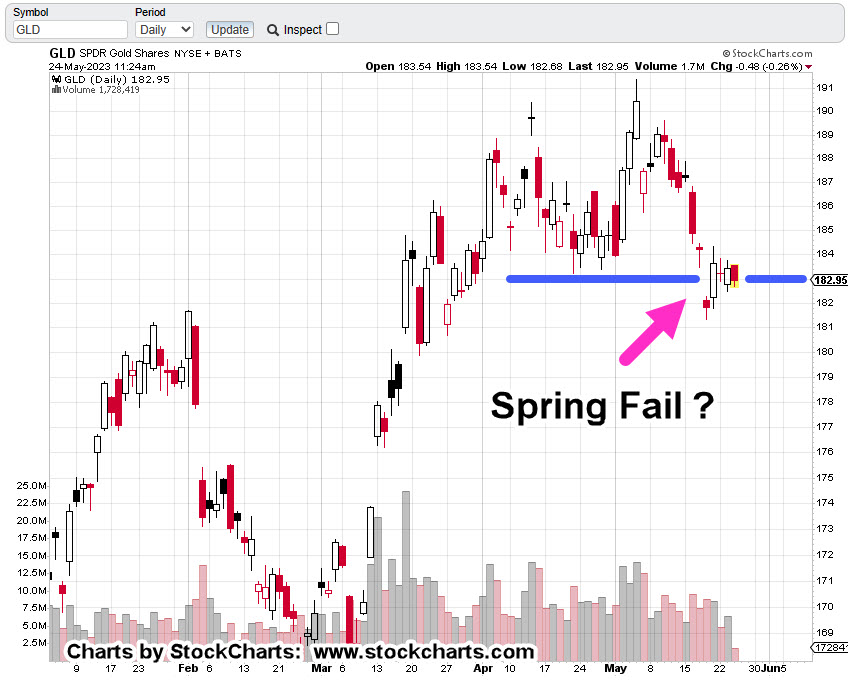
Gold (GLD), Daily
When we look at gold (as of 12:05 p.m. EST), from a technical standpoint, it’s in Wyckoff spring position; a set-up to move higher.
The difference in this set-up as opposed to the one on November 3rd, of 2022 (not shown), price action’s ‘hugging the lows’ as David Weis used to call it.
We’re not springing higher.
The miners on the other hand (GDX, GDXJ) have already made their decision, moving decisively lower during this session (not advice, not a recommendation).
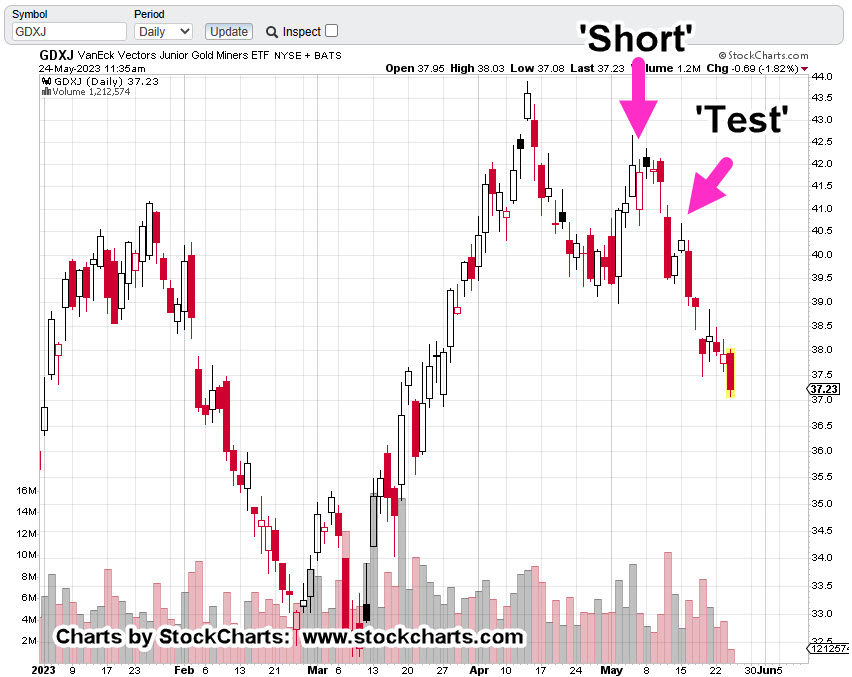
Junior Miners GDXJ, Daily
The chart below has two locations identified.
The first is this post identifying GDXJ, as a potential short opportunity.
The second is this post identifying the ‘test, reverse’ of the up-thrust with high probability of more downside (not advice, not a recommendation).
We can see the result.
Even though gold (GLD) had declined modestly with silver (SLV) more-so, the mining sector appears to be responding dramatically to the downside.
This ‘elevated metals, miners collapsing’ potential has been discussed previously.
Now, it appears that strategy is coming into play (not advice, not a recommendation).
Note: Posts on this site are for education purposes only. They provide one firm’s insight on the markets. Not investment advice. See additional disclaimer here.
If gold does not go higher, it’s because of ‘manipulation’, right?
The typical YouTube gold grifter acts like manipulation is a new discovery.
It’s the ‘go-to’ excuse when their forecasts don’t work out.
Way back in the early 1900s, Wyckoff discovered the market has always been manipulated.
His insight was, it’s up to the speculator to figure out the objective of the manipulation and then act accordingly (not advice, not a recommendation).
Livermore knew about manipulation and even engaged in it himself. He looked at things in a slightly different way; meaning, what is, not, what should.
A very key difference.
So, let’s look at what is happening with gold (GLD), and where it may head from here.
It took gold (GLD) several weeks to labor higher on ever shortened thrusts before finally exhausting itself and rolling over into a reversal … where we are now.
Is price action hesitating before heading higher or is this a significant downside move in the making?
It probably won’t be long before we have the answer.
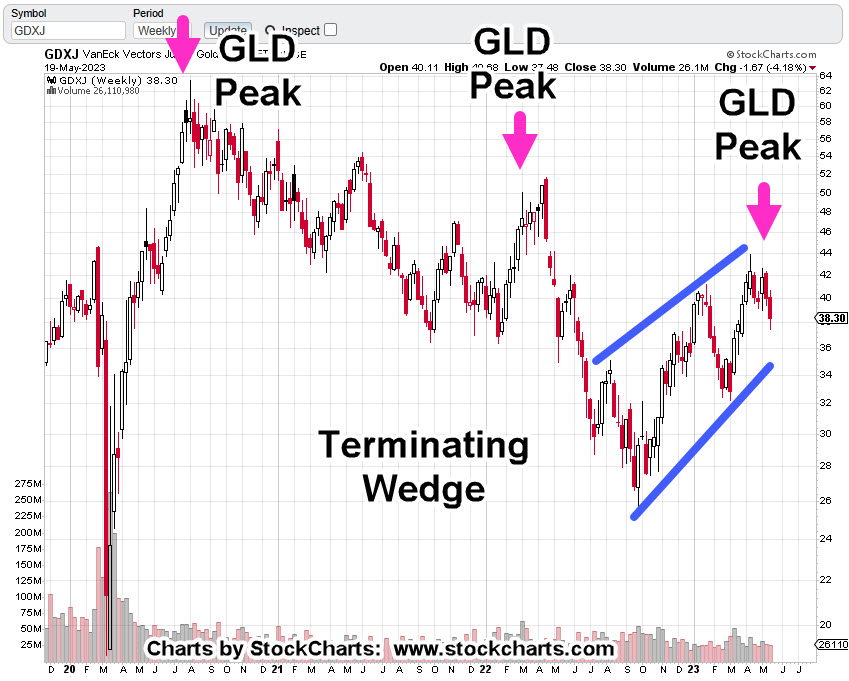
Junior Mining Sector GDXJ, Weekly
The gold mining indices GDX, and GDXJ, have already made their decision, reversing to the downside.
Note: Each reversal from a gold peak in the Junior Sector GDXJ below, is at significantly lower levels. This is not gold miner ‘bull market‘ behavior (not advice, not a recommendation).
It’s clear, the Junior Miners are in a bear market …
The GDXJ, is completing or has completed what is an obvious bear flag or terminating wedge.
Unless price action shows us differently, this is the current assessment; lower prices ahead (not advice, not a recommendation).
Fundamentals
From a fundamental standpoint, where’s the demand for inedible (possibly fake) metal going to come from? The consumer’s already tapped-out and borrowing money just to buy the weekly groceries.
Maybe something else is going on.
Something else that’s causing precious metals miners to anticipate another huge (economic) move lower.
Possibly completely unrelated (in a way) to the mining sector … maybe yet another ‘Speck’ event, shown at time stamp 3:40, at this link.
At the same link, time stamp 5:25, we’re back to the food supply … yet again.
“And all countries came into Egypt to Joseph for to buy corn; because that the famine was so sore in all lands.”
Note: Posts on this site are for education purposes only. They provide one firm’s insight on the markets. Not investment advice. See additional disclaimer here.
The last update on the Junior Gold Miners GDXJ, said they were hanging by a thread.
That update even included a forecast which turned out to be wrong and right at the same time (not advice, not a recommendation).
The miners have reversed … it just did not happen the next day as shown on the forecast chart.
The decisive rejection of the resistance (and test) level happened four days later.
Today, continued a slight retrace of that down-move as shown on the daily close chart below.
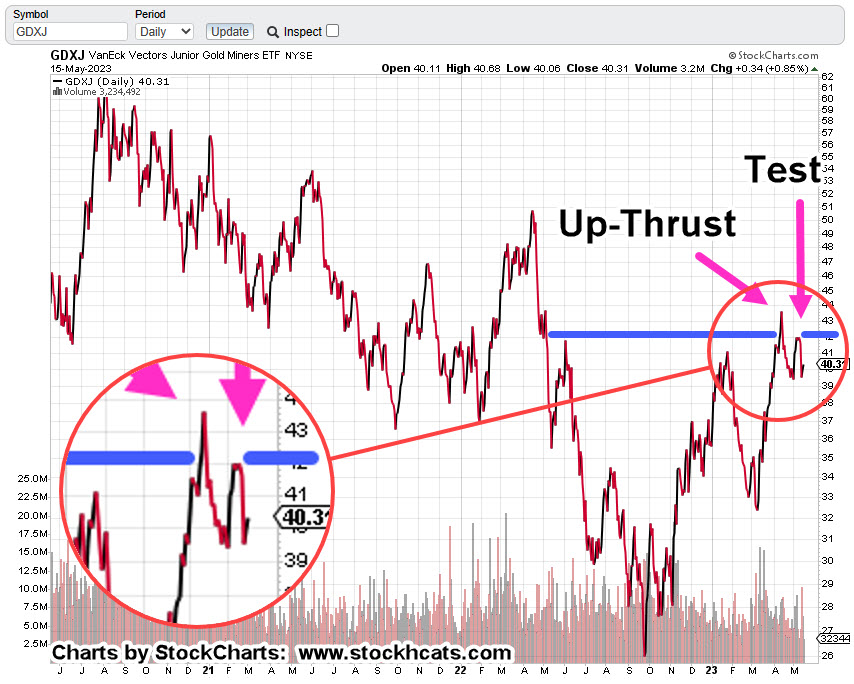
Junior Miners GDXJ, Daily Close
The attempt to push above known resistance (blue line) has failed. Price action had a false breakout (Wyckoff Up-Thrust), then a test and subsequent failure of that test.
The zoom of the reversal area shows more detail.
Last Friday’s session closed higher as did today … however today’s volume (i.e., commitment) was down – 49.4% when compared to the prior session.
The buyers are pulling back … price action is drifting higher.
On a weekly basis, we still have a bearish MACD divergence (not shown). Probabilities at this point indicate lower prices ahead (not advice, not a recommendation).
Note: Posts on this site are for education purposes only. They provide one firm’s insight on the markets. Not investment advice. See additional disclaimer here.
We’re not in Kansas anymore and to expect things to operate ‘normally’, is a strategic error (not advice, not a recommendation).
The last update on Nat-Gas, specifically the futures, warned of new lows before a significant reversal:
“The Nat-Gas futures contract for May (NGK23), needs to post above 2.383 soon (in the next day or so), or the contract is at risk of pressing to new lows.”
Well, we’ve moved on from the May contract to the June contract and that contract indeed posted a new low this past Friday, the 5th.
Just Because …
Just because nat-gas is down, does not mean that it has to go up. That type of thinking is another error, typically called a ‘mind trap‘.
A better way to think about the situation, is to figure on a ‘disruption’ of some type, resulting in either a destruction of supply or excess demand over the usual conditions for the season (weather) at hand.
So, let’s see if the charts agree with that premise from a Wyckoff analysis standpoint.
Nat-Gas UNG, Weekly
Each significant downward thrust is becoming shorter in net distance traveled.
The horizontal blue lines tell the story. We’re nearing the end of the down move (not advice, not a recommendation).
Now, on to the daily. Price action penetrated support and has reversed … it’s in Wyckoff ‘spring’ position.
Natural Gas, UNG Daily
Of course, what happens next is the question.
Just as this post said we’d revisit it towards the summertime, showing there’s no Fed ‘pivot’, we can also propose there’s likely to be a severe disruption in the supply of nat-gas (not advice, not a recommendation).
Housekeeping & The Junior Miners, GDXJ
The expected lower open in the GDXJ did not happen.
So far, it’s been a narrow range day (as of 10:47 a.m., EST).
Price action is oscillating around unchanged and there appears to be no urgency to move either direction.
Standing on the sidelines for now (not advice, not a recommendation).
Note: Posts on this site are for education purposes only. They provide one firm’s insight on the markets. Not investment advice. See additional disclaimer here.
If we’re at the downside pivot for gold and the miners, there’s only one right answer for the next market session.
That answer is:
Lower open, lower high, lower close.
Not advice, not a recommendation.
However, it is an assessment of where we are in the market cycle for gold and the miners.
The focus is on the Juniors GDXJ, as they are the weakest of both gold GLD, and the Seniors GDX.
If GDXJ, does not open lower, there’s something else happening; that would mean the downside reversal potential is in question and/or it could morph into more testing at the Axis Line, previously discussed.
Here’s a close-up of the sector.
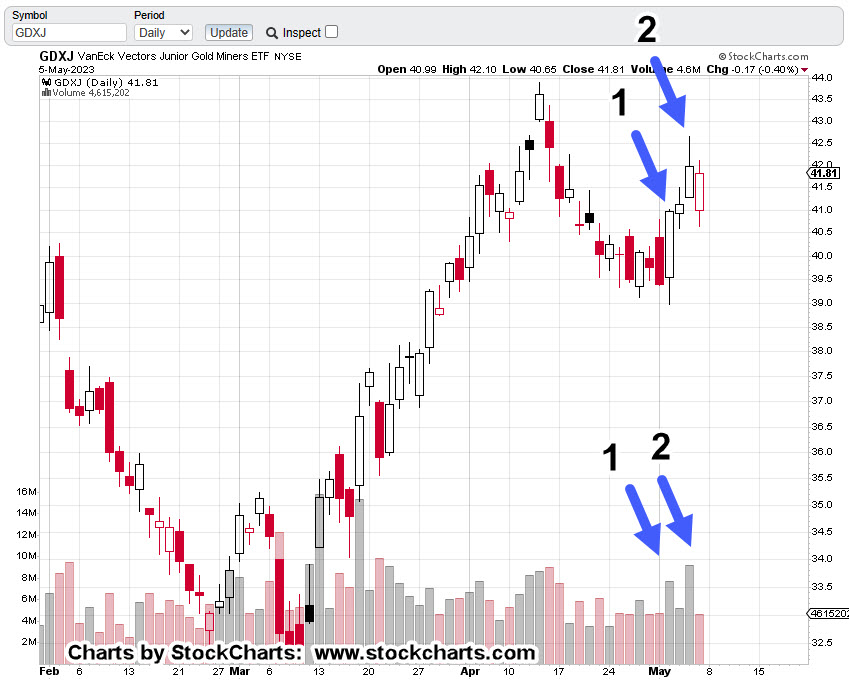
Junior Miners GDXJ, Daily
Volume bar No. 1, corresponded with a solid up move for that session; shown as Price Bar No. 1.
Volume Bar No. 2, is where it gets interesting.
Specifically, higher volume, more narrow range (net distance) and a close well off the high.
Wyckoff called this: ‘effort vs. reward’.
Lots of effort (volume) with less reward (distance) than the previous move.
The next session confirmed that assessment by opening gap-down and then spending the entire day attempting to close higher … which did not happen.
That day (last Friday) may have been short covering. If so, we’re about to find out.
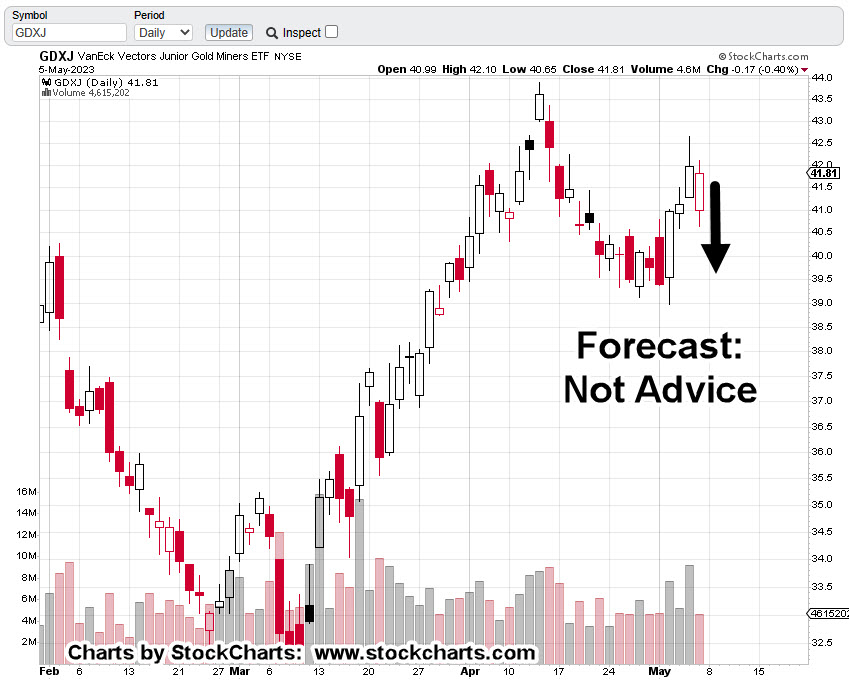
Junior Miners, GDXJ, Daily (forecast)
If we’re in a reversal (a big if), then we’ll get some variation of the price bar (black arrow) as shown (not advice, not a recommendation).
For the bearish option to remain intact, GDXJ needs to open lower and close lower for the day.
However, it does not need to post a new daily low, although that would help the case for more downside.
Anything other than what’s just described, would indicate a more complex price action environment.
Note: Posts on this site are for education purposes only. They provide one firm’s insight on the markets. Not investment advice. See additional disclaimer here.
Nearly everyone expects gold to go higher; much higher.
You want ‘clicks’ on your website? Then talk about how gold’s going to the moon.
It’s an easy grift. Everybody’s doing it.
However, gold’s truth is in the price action, not the grift.
We’re going to look at that truth and more specifically, what gold’s (GLD) volume is telling us.
With full understanding that anything can happen, gold could go higher, there’s a case for a significant downside reversal (not advice, not a recommendation).
Gold GLD, Weekly
In Wyckoff analysis terms, volume is the energy behind the move. It’s the commitment … or lack thereof.
Last week’s volume is far below the prior spike high set during the ‘invasion’.
It’s down over 56% from the ‘invasion’ spike and down 26% from the most recent spike.
Demand, commitment and thrust energy, are backing away from the gold market.
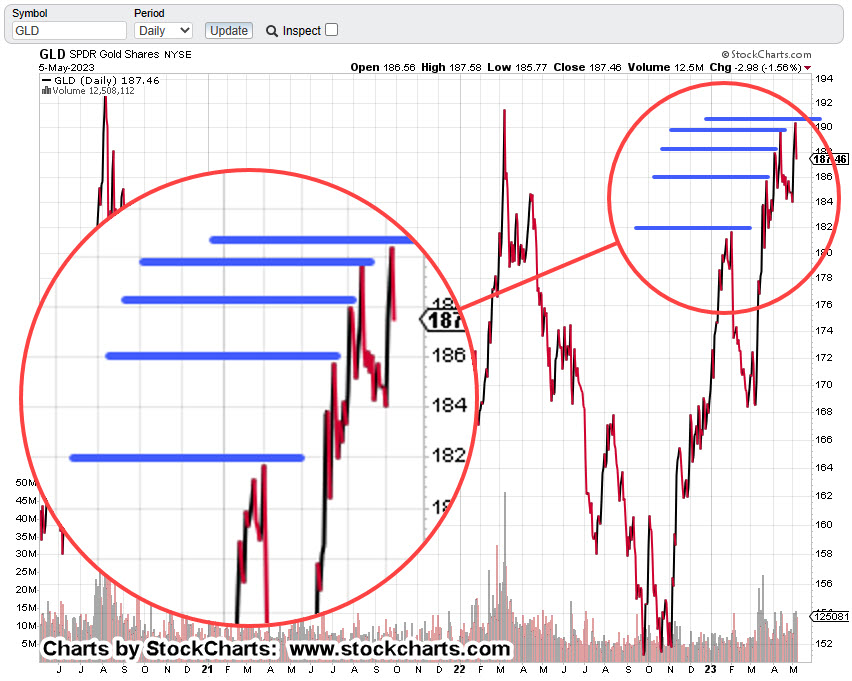
Moving down to the daily, we see the net distance traveled with each significant thrust is shorter than the last.
Gold GLD, Daily Close
Wyckoff wrote about this observation a century ago when discussing how to spot the end (or absorption phase) of a move.
He called it ‘shortening of the thrust’.
So, there it is. The weekly chart shows each major volume spike is less than the last.
The daily close has net distance traveled less than the last.
Add in the mining sector’s GDXJ, posting its most recent peak four weeks ago (week ended April 10th).
Last week’s action in the Junior’s appeared to be an act of desperation by the bulls.
Note: Posts on this site are for education purposes only. They provide one firm’s insight on the markets. Not investment advice. See additional disclaimer here.