Here’s one method to use for a trailing stop; Have the market itself tell you were it goes.
The reason brokerage trading platforms have so many options with an endless list of indicators, is that’s what the (retail) public wants.
It has nothing to do (as usual) with what works best.
Wyckoff himself said the market defines the course of action. The “tape” as he called it, was the master for decision making and no other.
Let’s look at what the tape is saying about LABD, the 3X inverse EFT of Biotech (IBB).
The sector has already been traded profitably last week. Shown on the chart below is another entry. Also shown, is what may be the most efficient method for stop placement.
For LABD over the prior weeks, we could have extracted a large part of its move using a trailing stop based on the 4-Hour chart.
LABD itself has defined that 4-Hour looks best at this point in time.
So, that’s what we’ll do (not advice, not a recommendation). The stop will be at the nearest 4-Hour low (currently, 16.27).
At mid-session today, we’ll move it up to the next 4-Hour low and so on until stopped out.
Note: Posts on this site are for education purposes only. They provide one firm’s insight on the markets. Not investment advice. See additional disclaimer here.
Empirical data shows market tops tend to occur before, during, or just after a holiday week.
Probably the most famous market top, was September 3rd, 1929.
That top was the Tuesday following the Labor Day weekend.
Now, we have another potential Tuesday top; February 16th. The Tuesday following the President’s Day Weekend.
While shiny object distractions abound; Game Stop (GME) hearings, Silver (SLV) squeeze, Bond (TLT) rout and more, the market may have quietly and without fanfare, put in the highs for the year.
Judging from the internet and YouTube chatter, everyone’s expecting some type of immediate crash.
Well, since everyone’s expecting it, it’s not likely to happen. Or more accurately, not the way anyone expects.
The last meltdown about a year ago was pretty much a straight-down affair. If we’ve seen the highs, what happened last time won’t happen this time.
That leaves at least two options:
Gap down 15% – 30% or more, overnight.
Slow, grinding decline, hardly noticeable until one day …
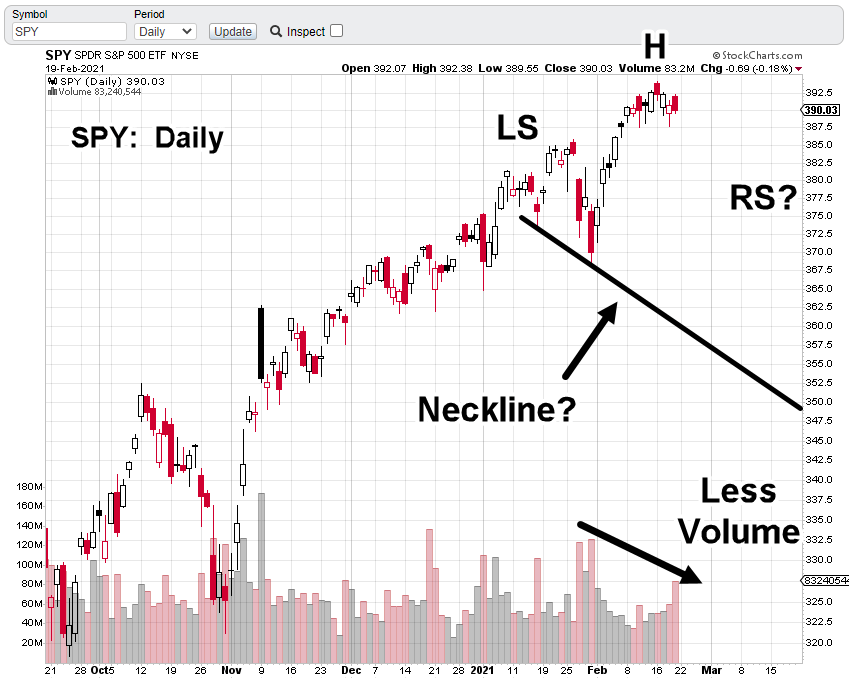
The chart of SPY below shows a possible Head & Shoulders, top formation. It’s still very early in the chart as even the head of the pattern’s not yet complete.
Nonetheless, it’s important to be ahead of the game and anticipate the next moves of the market.
Note the volume’s tapering off as we get into a possible head formation. If there’s to be a Right Shoulder, a textbook case will have volume fall away even more.
It’s about a half-hour to go before the open. SPY is trading down -0.65% to -0.80%, while TLT is unchanged.
If TLT makes a new daily high above 144.32, it’s a good sign we may have seen the bottom of that market.
Note: Posts on this site are for education purposes only. They provide one firm’s insight on the markets. Not investment advice. See additional disclaimer here.
In turn, that public has shown there’re certainly not going to educate themselves. If they were awake, news channel ratings (in the link) would be at zero.
Unfortunately, this time around, the game’s up.
The ongoing collapse will decimate those who refuse to wake up and will probably take some of those who are, with them.
What can be said? We can call it lies, misinformation, propaganda but none of those really get to the root.
Input prices are rising not from inflation, but from supply constriction and disruption.
For example, the corporate (big-Ag) food supply chain as reported on many times, is intentionally being destroyed. The result of course, prices go higher.
We’re also in a quiet sun-cycle period that only serves to help with (cold) weather extremes. The only discussion from the media concerning the weather is that’s it’s getting warmer, right? Opposite of reality.
So we’re taking that ‘opposite of reality’ as a contrary indicator.
Whatever inflation we’ve got after nearly twelve years, is probably at or near a peak … ready to head lower.
That includes the market as well. The likely outcome:
Market down, bonds up.
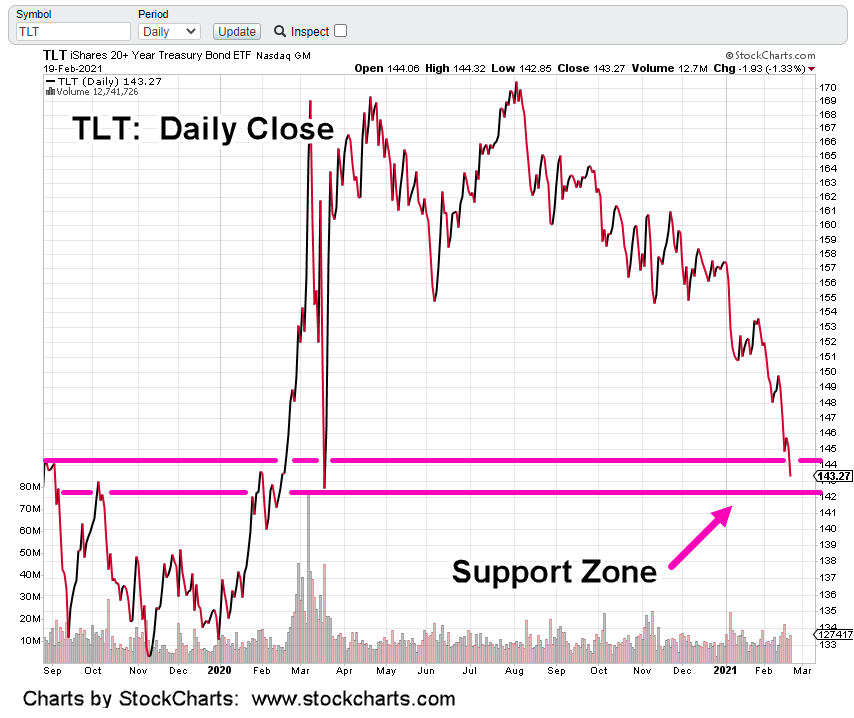
The daily close of long bond TLT, has it in a support zone. One attempt has already been made to position long via TMF (not advice, not a recommendation) as detailed in this report.
Once again this past Friday, another TMF entry.
Both bonds and the markets (i.e. S&P 500) are at opposite extremes. The risk of loss in bonds may have reached its nadir.
Note: Posts on this site are for education purposes only. They provide one firm’s insight on the markets. Not investment advice. See additional disclaimer here.
At this juncture in the market, trades are only to the short side.
The one exception is the bond market.
With everything stretched to never-seen-before extremes and ready to break at any time, bonds are in position to rally.
This short-story of the biotech short actually begins with a bond loss.
Going back in time a bit; on Friday the 12th, a long position was opened in bonds via TMF. That action was documented in this post.
Then, we had the holiday weekend and the Texas freeze.
These posts are originating from a location near Ft. Worth Texas, where temperatures reached a low of -3 F.
At the office, we have backup power and physical (hard-wire) connection for internet. Both systems operated well as main power was cut repeatedly over a three-day period.
Those conditions are mentioned because at the open on Tuesday the 16th, transmission, execution and update times on trades were affected.
A potential harbinger of things to come.
Imagine a nation-wide outage where the market’s down 15-20% and still collapsing. All the while, trade platforms are locked-up with brokers inundated.
During that open on Tuesday, bonds (TLT) gapped-down which was unexpected. Inverse fund TMF was immediately down about -4.5%.
Overall, the bond market is still in position to rally. However, the open on Tuesday said ‘not yet’ and we’re not going to change the trading strategy to one of ‘hope’.
With trade execution times slow (minutes, not seconds), by the time a confirmation came in from the broker, exit on the position posted a -5.2% loss: A dent in the account for sure.
At the same time, we’re monitoring a large set of equities and markets.
So, the immediate task at hand was could that hit be mitigated quickly. Was there an opportunity in another market for gain?
The short answer was yes. It was in biotech to the downside.
Price action on the platform was slow to update. However, it was clear from what was available, shorting biotech via LABD was high probability.
That’s what happened. Entry was at LABD 14.73, about ten-minutes into the session.
Obviously, under the conditions, stress level during re-positioning was high. Temperatures in the trading office were about twenty-degrees below normal.
It’s hard to say exactly, but sometime as the last trade was being entered or confirmed, main power was cut again.
Subsequent price action on LABD was fast.
By the time we’re halfway into the session, not only has the loss been mitigated but the account is showing green. Good stuff.
The position and the account finished the trade in the green and the rest is history. Entry and exit are shown on the 15-minute chart below.
On the exit and in retrospect, the trade was held for a bit longer than it should have been as there was potential for additional upside.
When it became clear it was not to be, LABD was exited with an 8.21%, gain as noted:
Note: Posts on this site are for education purposes only. They provide one firm’s insight on the markets. Not investment advice. See additional disclaimer here.
Note: Posts on this site are for education purposes only. They provide one firm’s insight on the markets. Not investment advice. See additional disclaimer here.
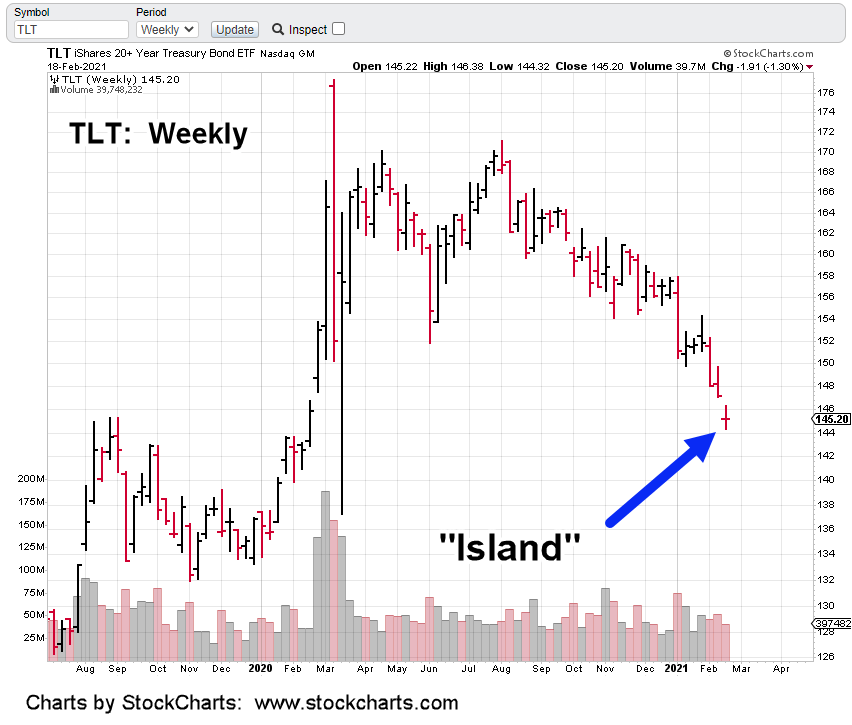
If bonds (TLT) finishes the day essentially where it started, it will have printed an island bar on the weekly chart.
Bonds (TLT) are currently trading in the pre-market around 144.15 – 144.65.
If trading stays in that tight range, with the technical conditions shown below, TLT may set up for a Monday gap-up reversal.
The potential island gap is shown on the weekly chart:
The part that’s not so noticeable on the bar chart (above) is better displayed on the weekly close chart:
TLT is right at established support.
To borrow Steven Van Metre’s assessment, with all the selling and the extremes in short positions taking place over the past six months, bonds have only been able to retrace to well known support levels.
Trigger events have a nasty habit of happening over the weekends.
That’s when the largest number of participants can be trapped with no escape. It’s how the game is played.
The island-gap weekly bar may not happen. Bonds could reverse (or collapse) during the up-coming session.
However, successful participation in the markets requires awareness of what could, or what’s likely to happen … before it does.
Note: Posts on this site are for education purposes only. They provide one firm’s insight on the markets. Not investment advice. See additional disclaimer here.
There are so many reasons why the silver squeeze is over; not the least of which is the constant bombardment of the supposed event in the financial press.
If the mainstream financial press is covering the topic (any topic) whatever the event, it’s over, irrelevant or an intentional miss-direction.
The little guy’s not going to put the big guys into a bind.
Potential action in SLV is above. We’ve got hits on the right side of the chart indicating a potential trend has formed.
There’s already precedent for a trend change with the massive volume spike on February 1st.
Inverse fund ZSL (not advice, not a recommendation) is showing the same trend potential but in the opposite direction … up.
As always, anything can happen. For example, an earthquake (seismic activity picking up world-wide) could wipe out production at some major mine and affect the price.
The chart above, shows the current potential. A trend may have been formed. If SLV price posts a new daily low (below 24.93), we have additional confirmation.
Note: Posts on this site are for education purposes only. They provide one firm’s insight on the markets. Not investment advice. See additional disclaimer here.
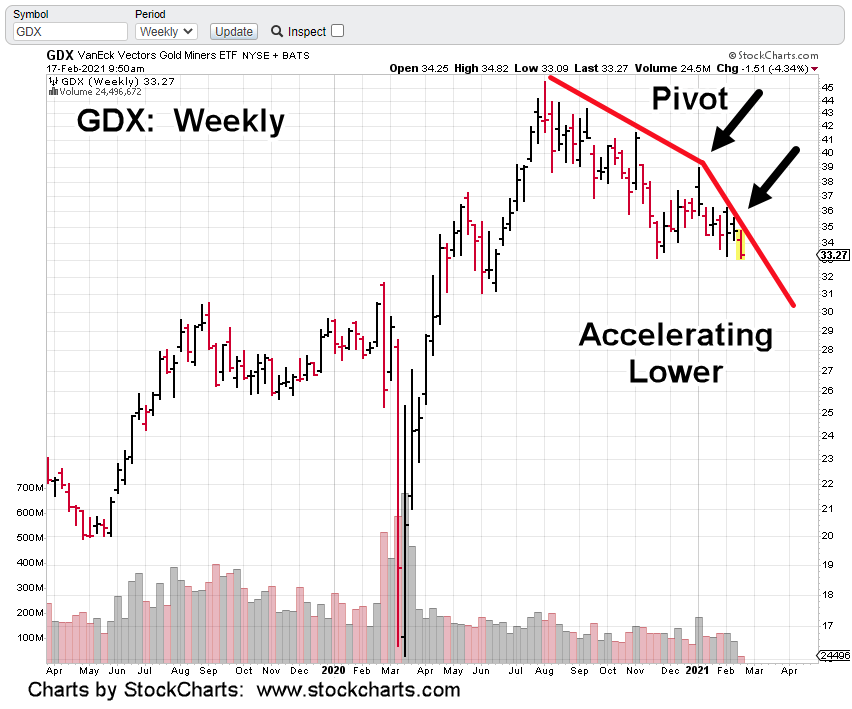
With GDX posting a new weekly low (below 33.23) early this session, it’s helping to confirm a pivot and acceleration to the downside.
Bullish or bearish, it’s a crowded trade that we’re avoiding (not advice, not a recommendation).
It took over a week of oscillating price action before GDX decided to post below the February 4th, low.
Even so, when an established low is penetrated, it puts the market in “Wyckoff Spring Position’.
That means there’ll (potentially) be some type of rally or rally attempt. If that happens, it’s just more oscillations that result in erosion of leveraged inverse funds.
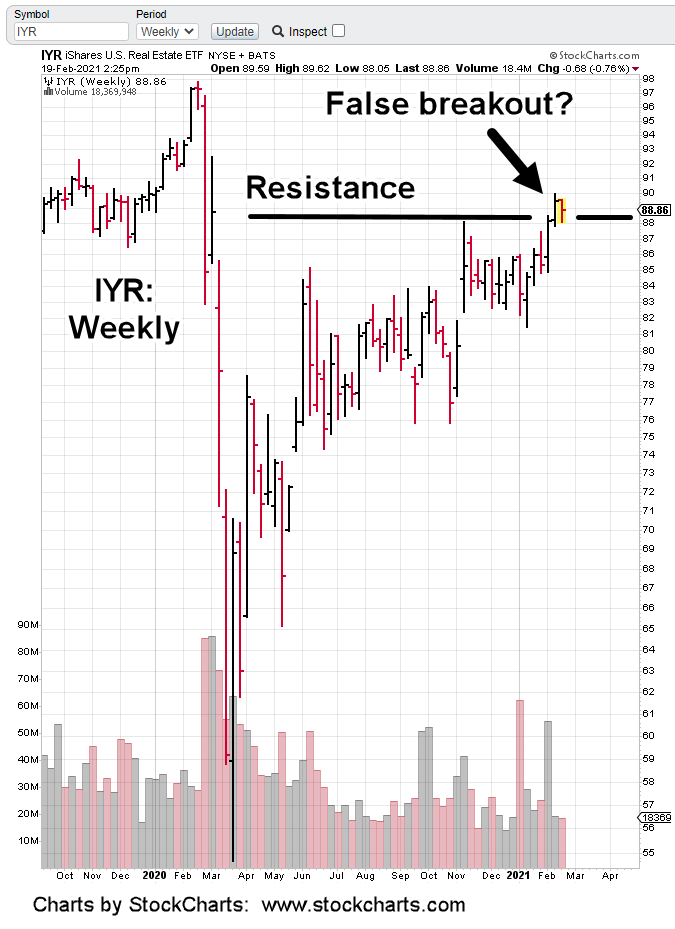
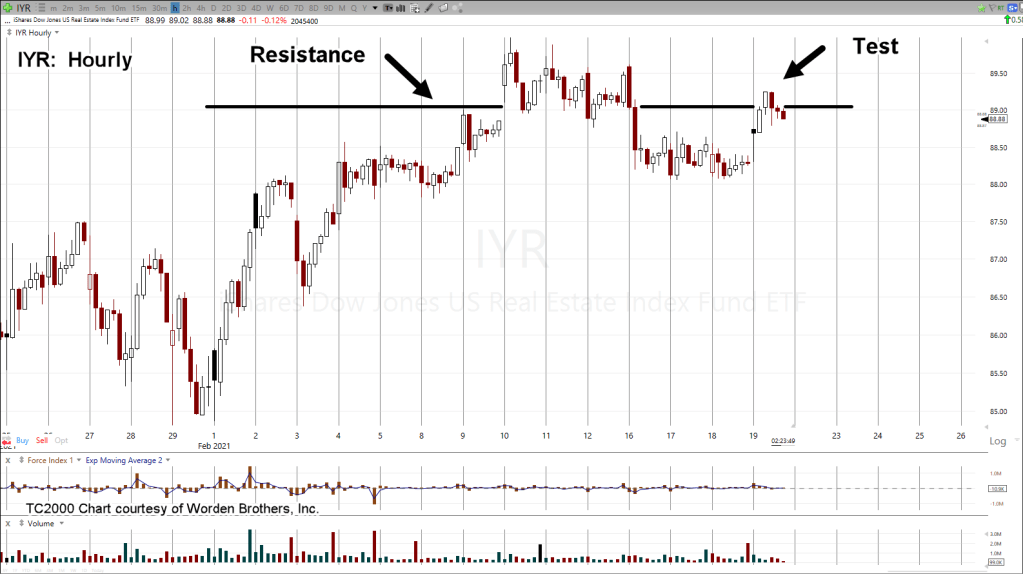
Other areas of the market are performing better on the downside. Real estate IYR, looks like it may post a narrow range day (as of mid-session).
It’s typical action when at support. If there’s no break lower today, then IYR could make an attempt higher at the next session.
Based on previous analysis, that attempt (if it occurs) is expected to be short lived.
Note: Posts on this site are for education purposes only. They provide one firm’s insight on the markets. Not investment advice. See additional disclaimer here.
Wasn’t it August of 1987 when the markets were stretched to extremes?
Then bonds headed lower … with rates going higher?
We know what happened after that.
Back then, the market peaked, retraced and then tried to make a new high which failed.
It was the failed move that set things into motion.
Then it was fast and volatile in the days leading up to Monday, October 19th. Markets do not repeat exactly but they do alternate.
So maybe it’s not August now, but February, March or April?
Getting back to October 1987. The late Dr. Martin Zweig discussed the possibility of a Monday crash during Louis Rukeyser’s Wall Street Week: Time Stamp 6:50 – 9:00.
While his assessment was important, perhaps more important was the rosy market forecast by the sell-side (retail) analyst (time stamp 8:37, link above).
That response to Zweig didn’t age well did it?
Three days later at the open, the market vaporized
Is truth more important than fairy tales? This site is about presenting objective analysis along with potential outcomes.
It’s likely we’re an order of magnitude greater than ’87. There’s no argument markets are stretched to obscene levels.
Will the result be the same? In the markets, anything can happen. However, if enough time has passed to forget (or be ignorant) about the past, it’s possible that it’s time to repeat.
Stay Tuned
Note: Posts on this site are for education purposes only. They provide one firm’s insight on the markets. Not investment advice. See additional disclaimer here.
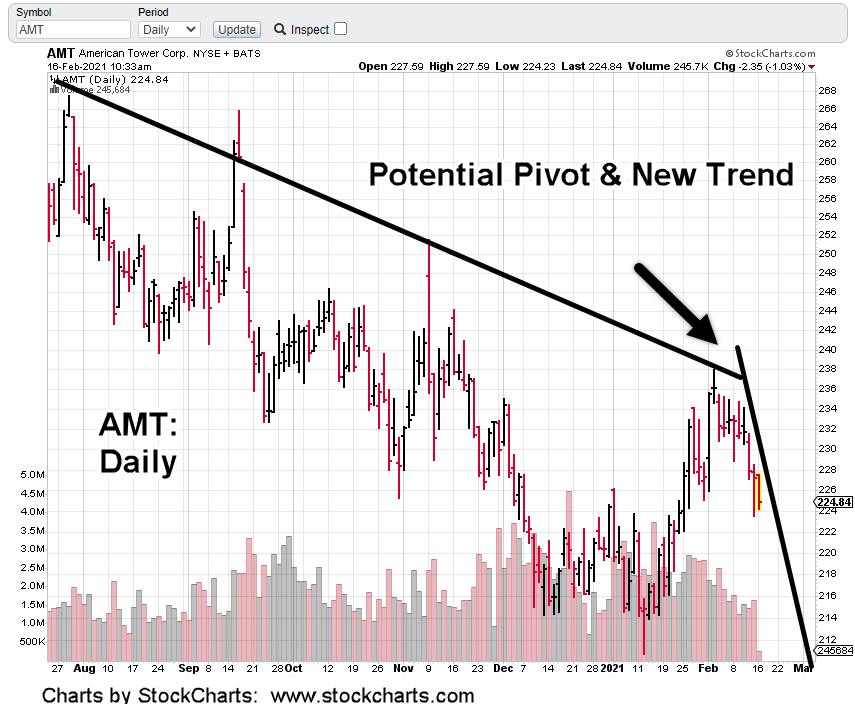
Early in the session, looks like AMT is leading the way lower.
In addition, a new pivot may have been established along with a new (lower) trend line. Subsequent price action will determine if we’ve seen acceleration to the downside.
Separately, IYR has just posted a new daily low … helping the case for reversal (and not ‘throw-over’) at this juncture.
The firm maintains its short position via DRV (not advice, not a recommendation).
Separately, bonds (TLT) broke lower at the open which was unexpected.
The long position in TMF (3X TLT) was exited just after the open. Not advice, not a recommendation.
Even though expectations are for TMF to recover, we’re not going to wait around and hope.
One gets the sense events are happening quickly at this session. Was the Texas blackout the ‘event’ to trigger a market reversal?
It’s possible. Real esate, IYR now trading lower at -1.38%, just 90-minutes after the open.
Note: Posts on this site are for education purposes only. They provide one firm’s insight on the markets. Not investment advice. See additional disclaimer here.