Stealth Collapse

Does anyone (thinking) think, the debt is going to be repaid?
What does anyone (thinking) think the DOGE Brothers are all about, anyway?
Does anyone (thinking) think RFK-Jr., is after Froot Loops and food coloring?
‘Sleepwalking through the markets’, as Dr. Elder put it, years ago.
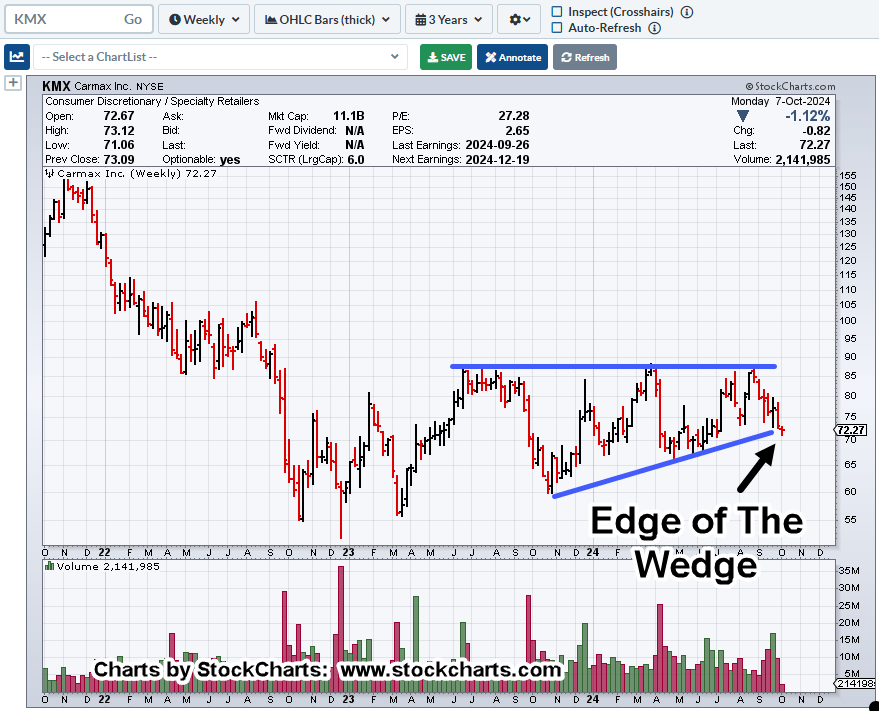
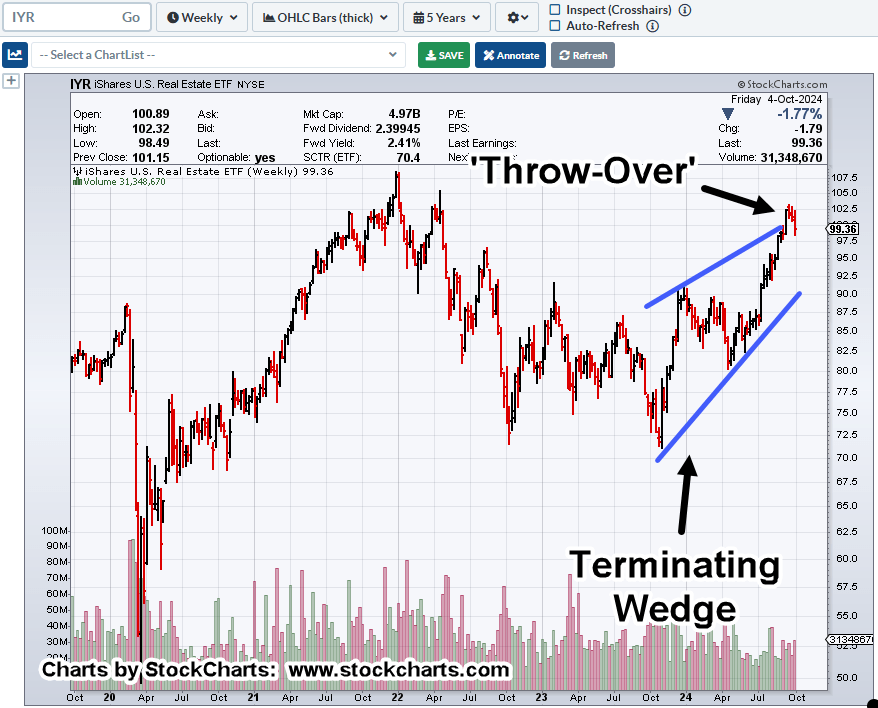
The market itself tells us the most likely outcome, the crux of Wyckoff analysis.
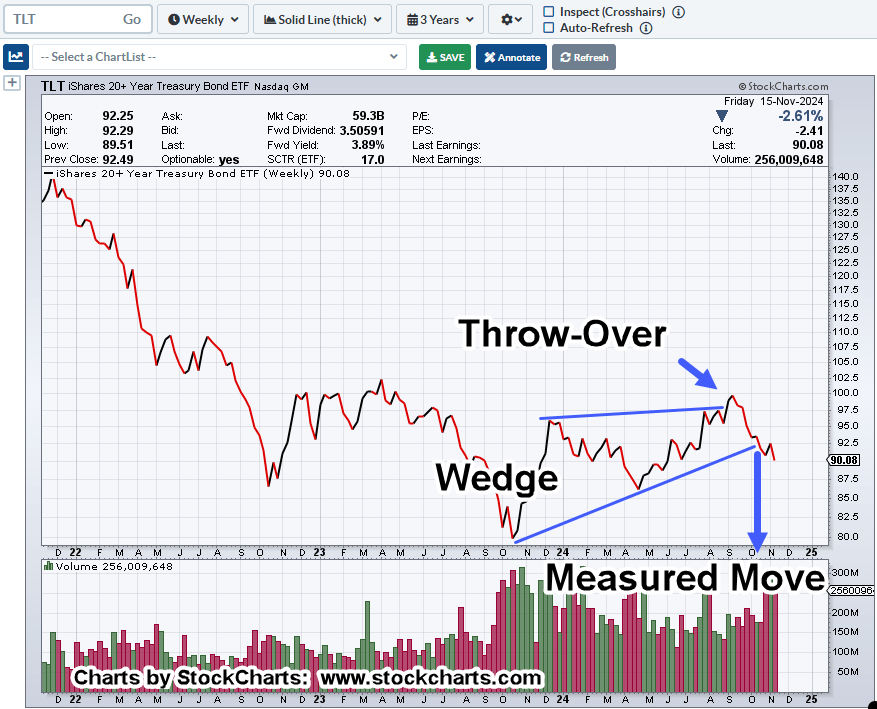
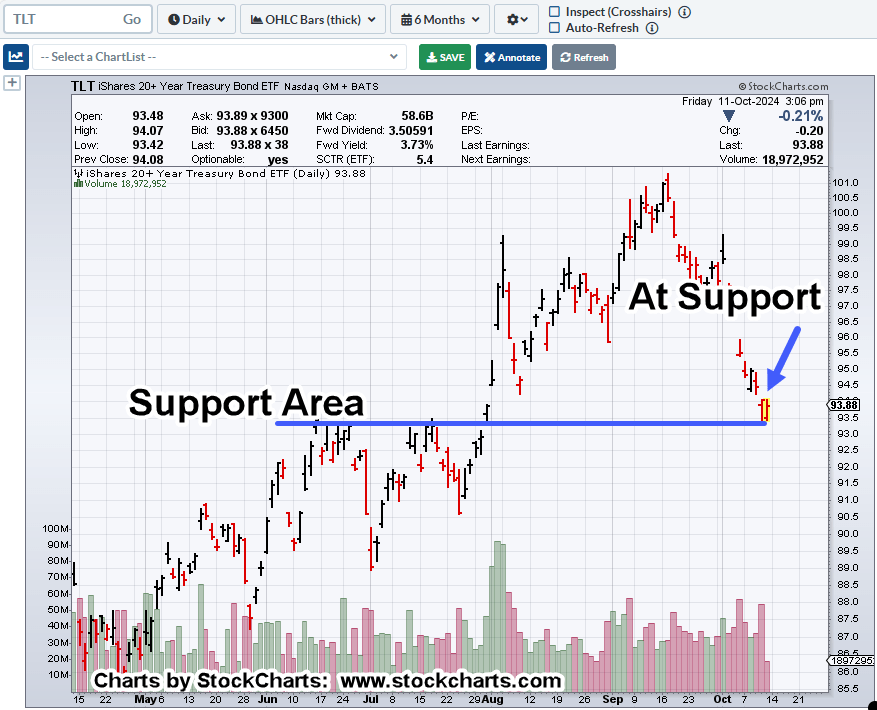
Right now, bonds (TLT) are telling us, down-pressure (rates up) continues to build (not advice, not a recommendation).
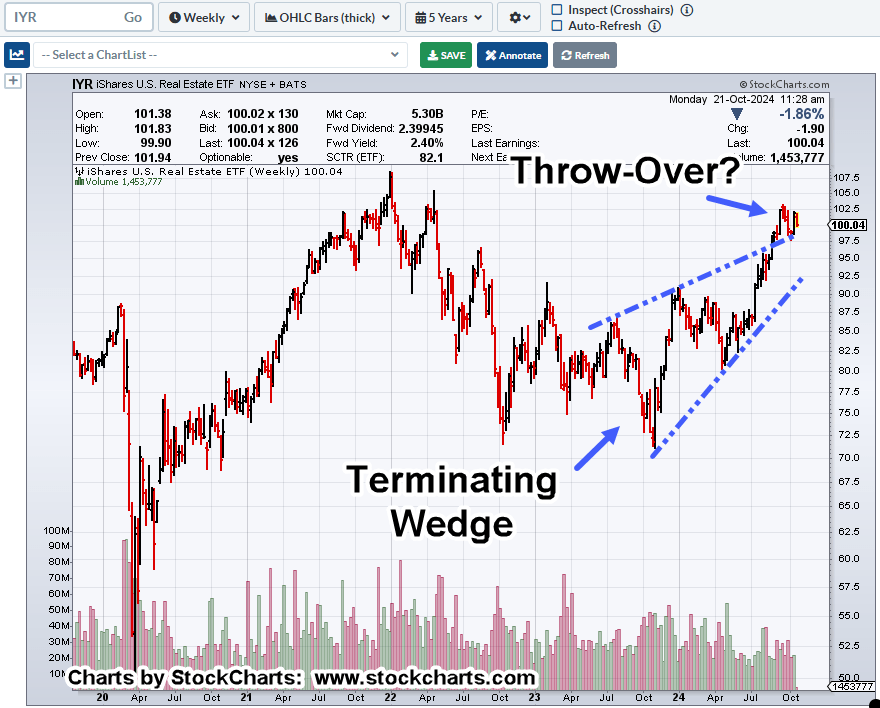
Long Bonds, TLT, Weekly
Will this time, be like last time?
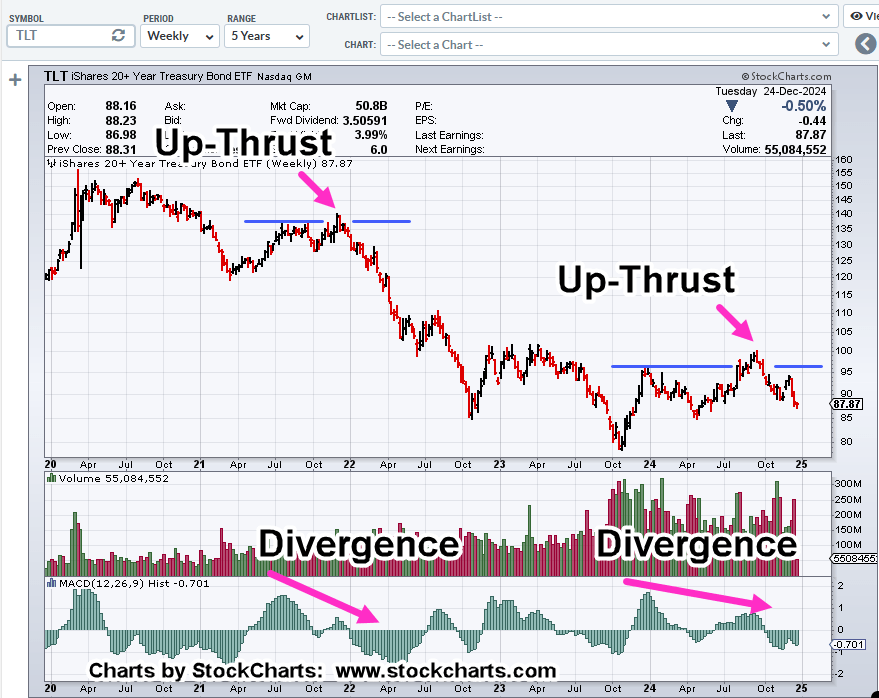
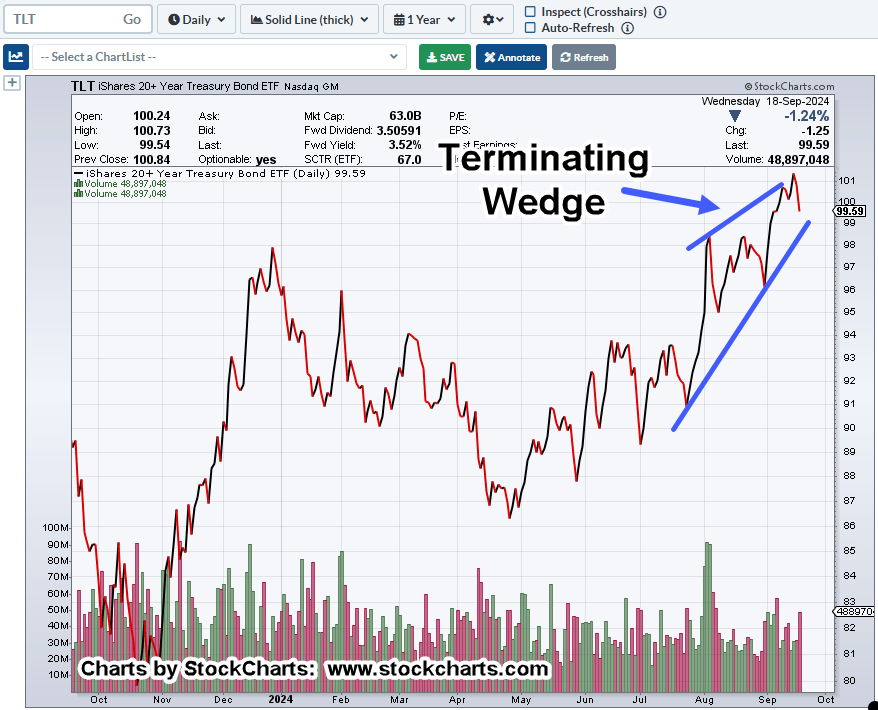
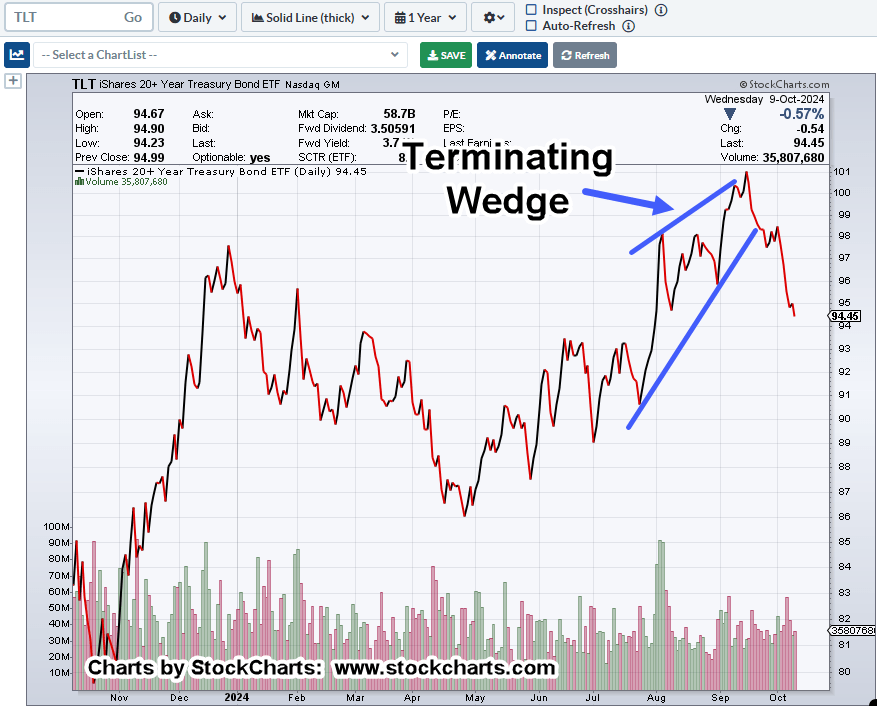
Moving in closer on the weekly

We’re about thirty minutes from the regular session.
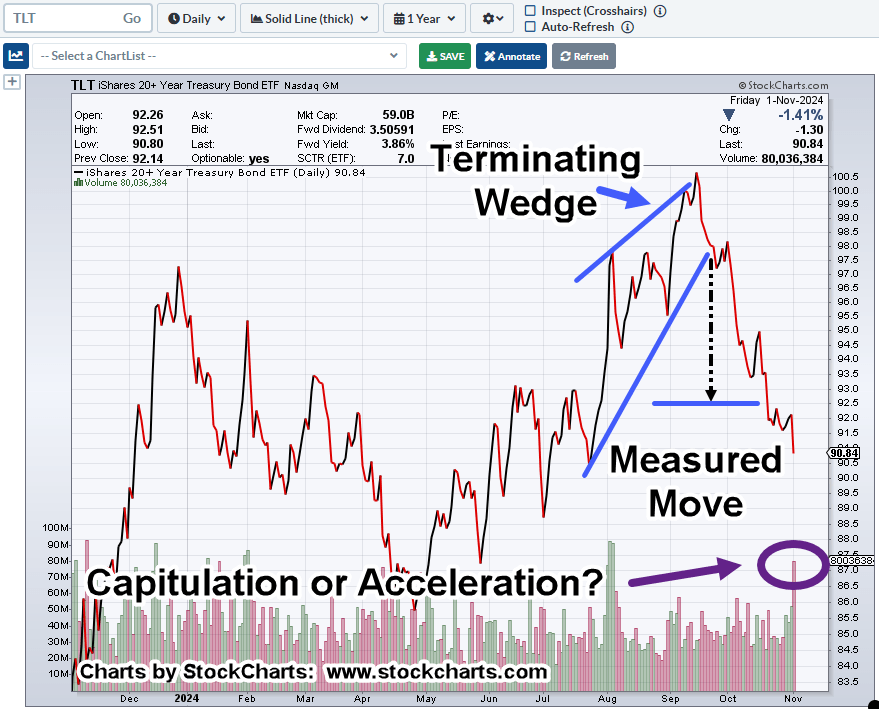
Bonds (TLT), are set to open lower, continuing the downward slide with rates pressuring on higher (not advice, not a recommendation).
Stay Tuned
Charts by StockCharts
Note: Posts on this site are for education purposes only. They provide one firm’s insight on the markets. Not investment advice. See additional disclaimer here.
The Danger Point®, trade mark: No. 6,505,279