That’s How Far We Have To Go
All the way back to late November 2009, to find a bar that’s remotely similar to the one just posted last week.
Even then, there are key differences.
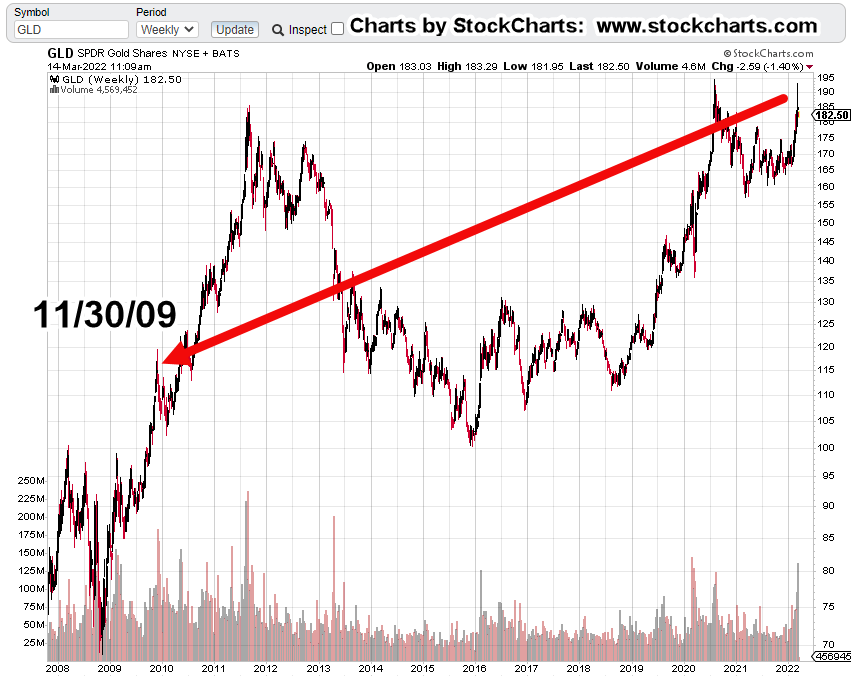
The reversal during the week of November 30th, 2009 was after a breakout and run-up of about 20%; from the resistance/support area around GLD, @ 100.
Last week’s bar was within a trading range not outside it. Also, we had to wait until this morning’s open to get a new weekly low.
Volume (blow-off) characteristics were similar:
Week-ending 11/30/09, volume 93% higher than the week before; week-ending 3/11/22, volume 43% higher than the week before.
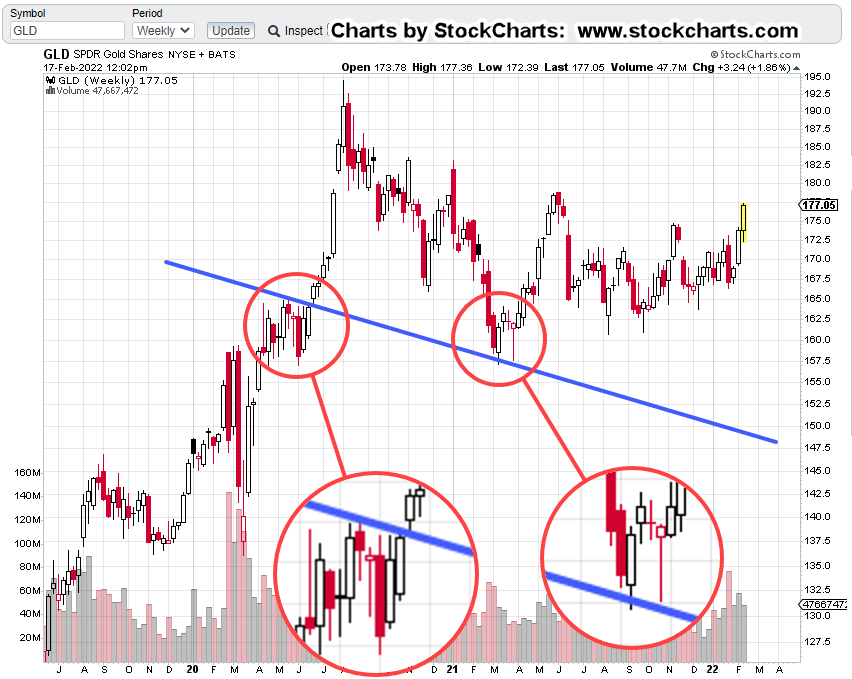
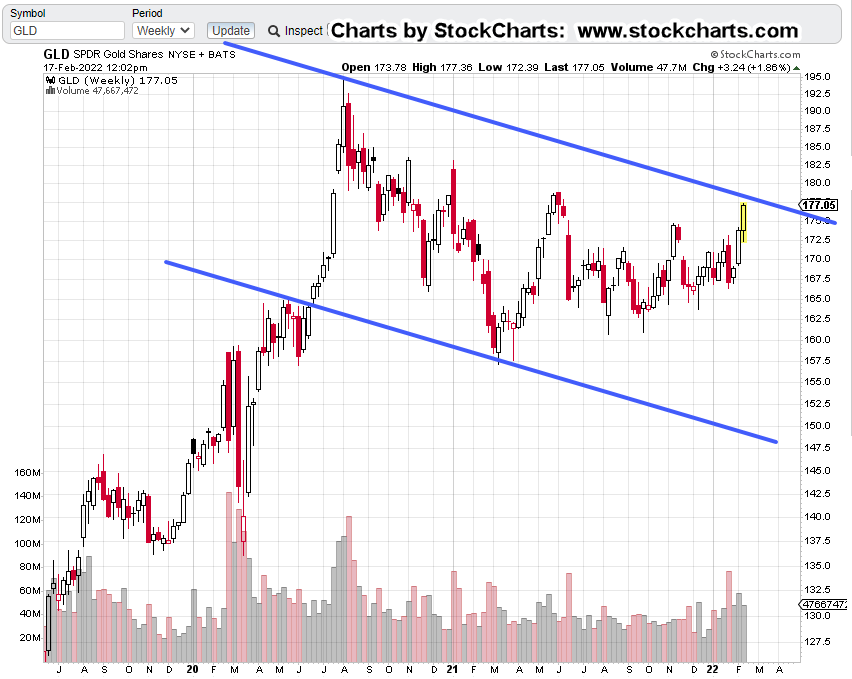
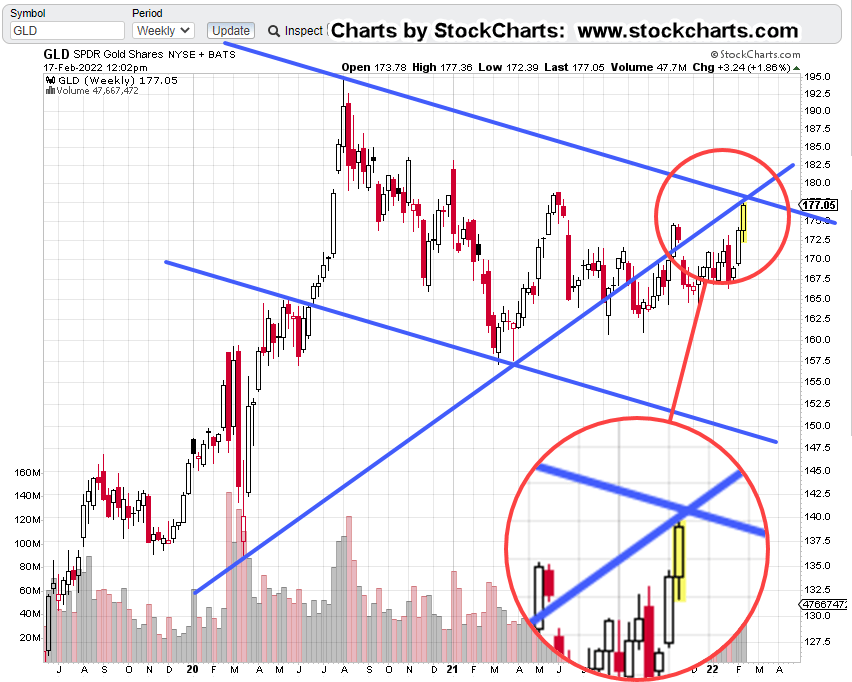
GLD, Weekly Chart
The chart gives us a feel for just how far back we have to go to find similar price action.
The prior update said at this juncture, longer term momentum indicators are pointing higher. Thus, suggesting there will be some kind of upward test either today or this week (Fed meeting?).
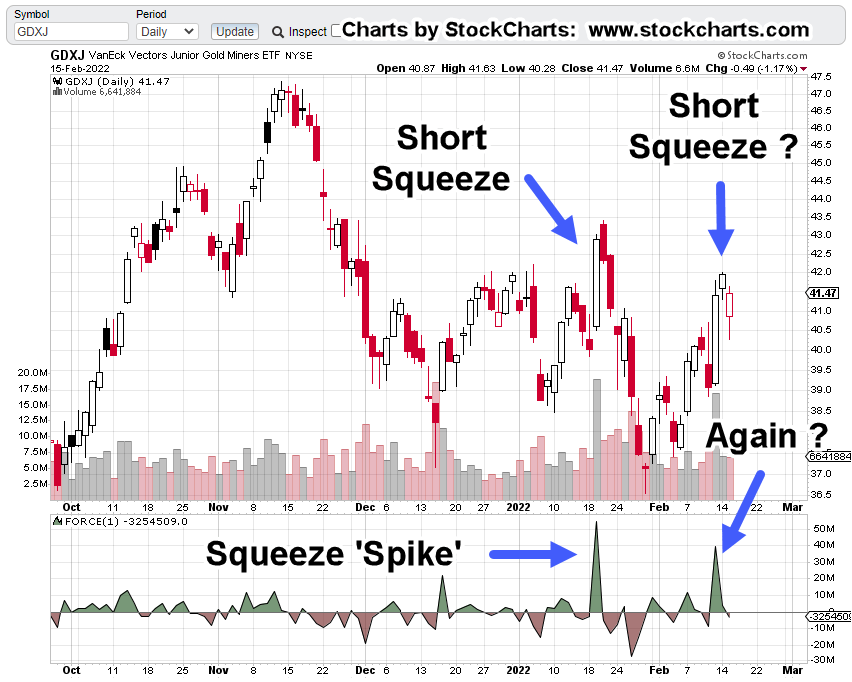
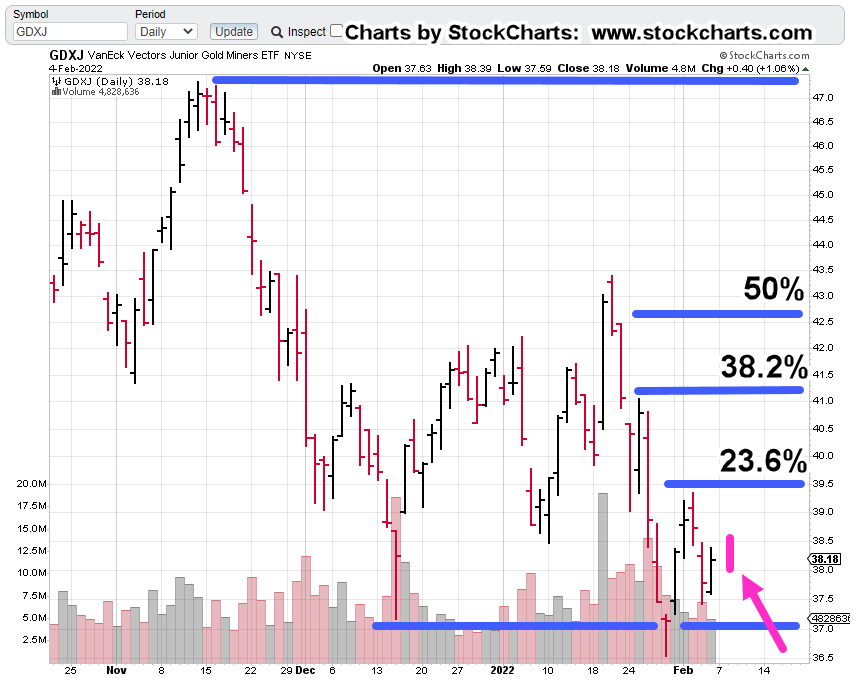
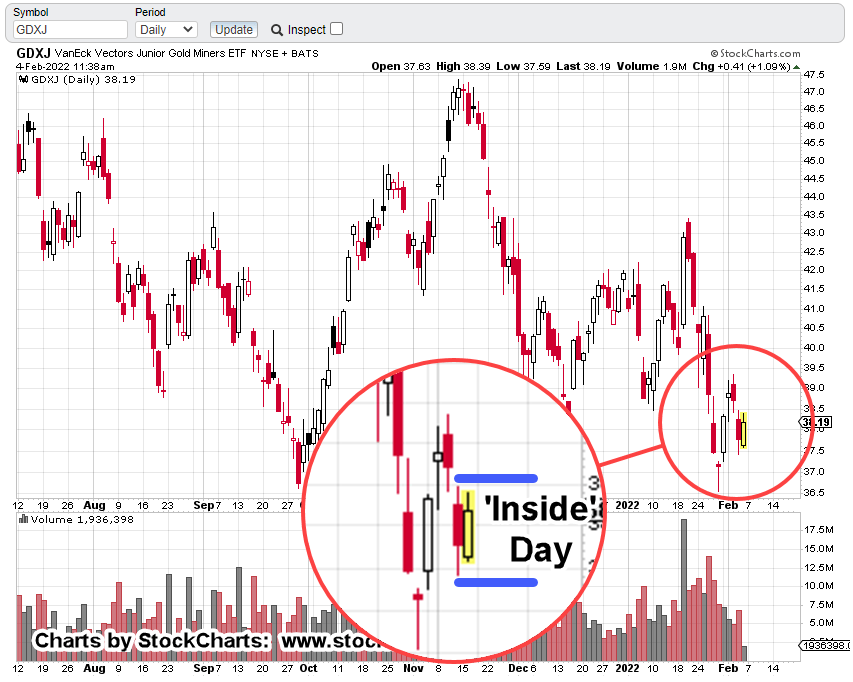
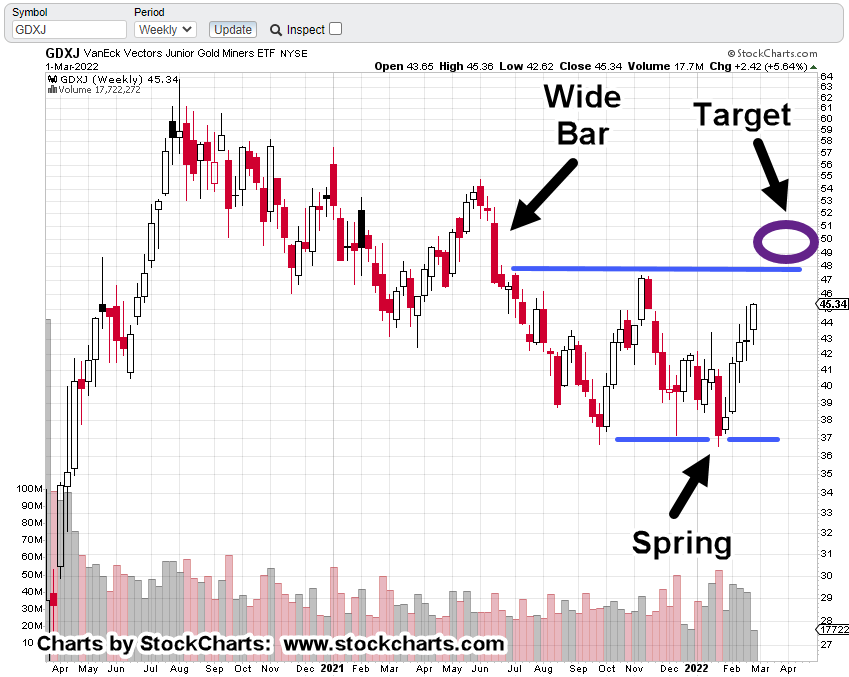
Junior Miners GDXJ, Weekly
Earlier this month, this post said to expect GDXJ, to up-thrust in the 48 – 50, area.
That’s exactly where we are now.
GDXJ, back then.
GDXJ, now.

There we have it. The repeating pattern of ‘Spring to Up-thrust’
That does not guarantee a downside reversal. It just shows us price action repeats these behaviors; doing so for decades, if not hundreds of years.
What happens now?
Longer term momentum indicators point higher and give the bias to the upside.
However, something that can be done is to use that upward bias to position short at the lowest risk possible (not advice, not a recommendation).
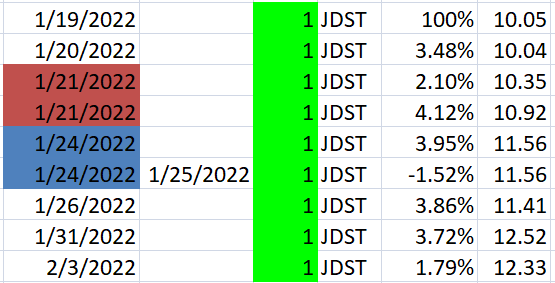
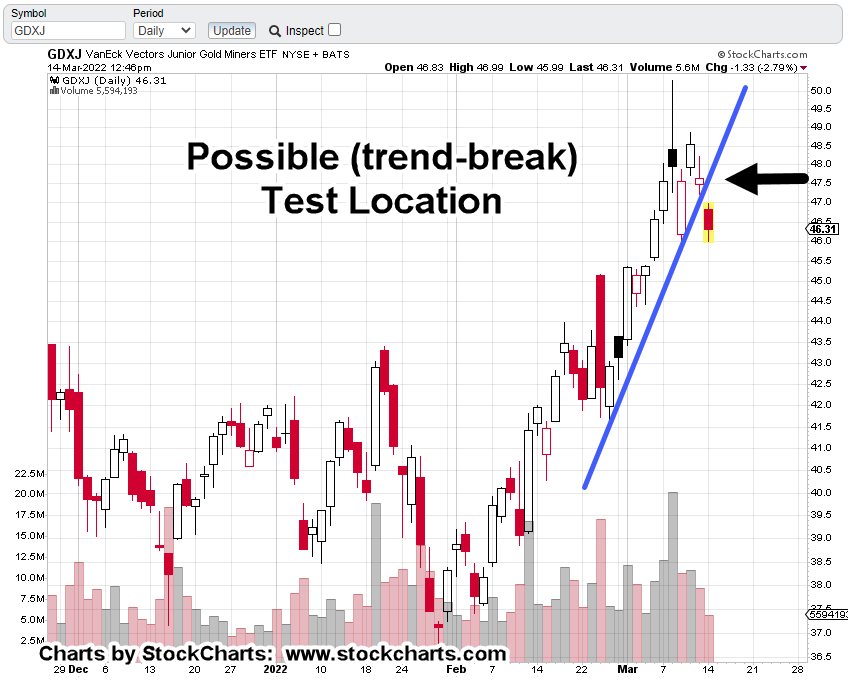
Positioning via JDST
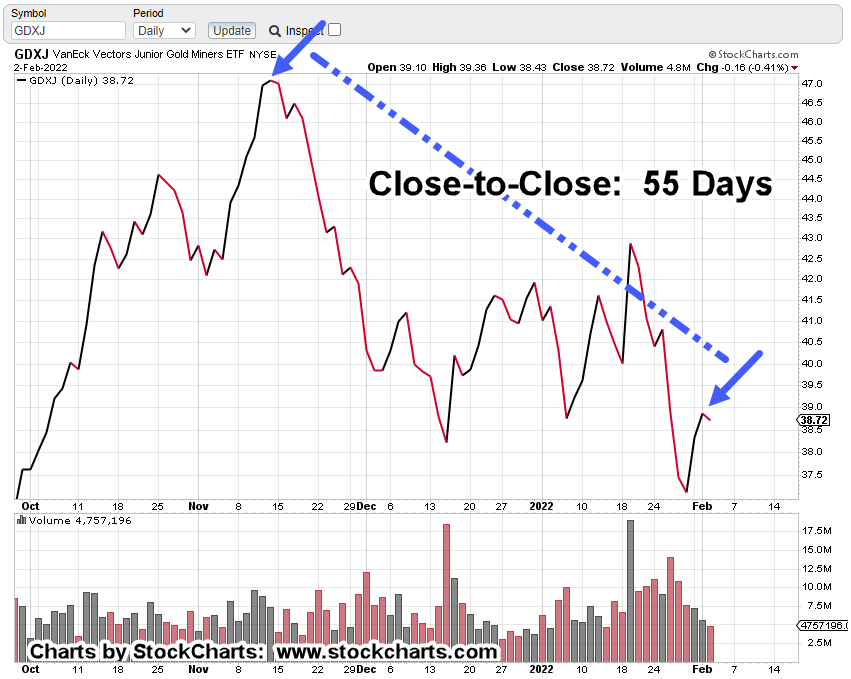
Junior Miners GDXJ, could come back to test the trendline break shown below starting today, through Wednesday.
If it does, the difference between being correct (about going short) and continued bull side action may be narrowed as much as possible (not advice, not a recommendation).
If that happens, the JDST stop will be very tight.
Stay Tuned
Charts by StockCharts
Note: Posts on this site are for education purposes only. They provide one firm’s insight on the markets. Not investment advice. See additional disclaimer here.
The Danger Point®, trade mark: No. 6,505,279