As if on cue to support the prior post highlighting silver’s ‘mysterious’ decline, we have this just out, on Newmont Mining.
Newmont’s in free-fall.
For long-time visitors to this site, today’s events should be no surprise.
These reports, here and here, posted back in April, identified reversals in gold miners GDXJ, and implicitly GDX, to the day.
We’ll include a quote from the first linked report below:
“It’s a fairly safe assessment, nobody expects a downside reversal … nobody”.
And yet, here we are.
As the administration and the financial press, becomes ever more confused and bipolar; even now, re-defining the long-held definition of ‘recession’, we have Wyckoff analysis time and again, cutting through the media trash to determine the highest probability for the market.
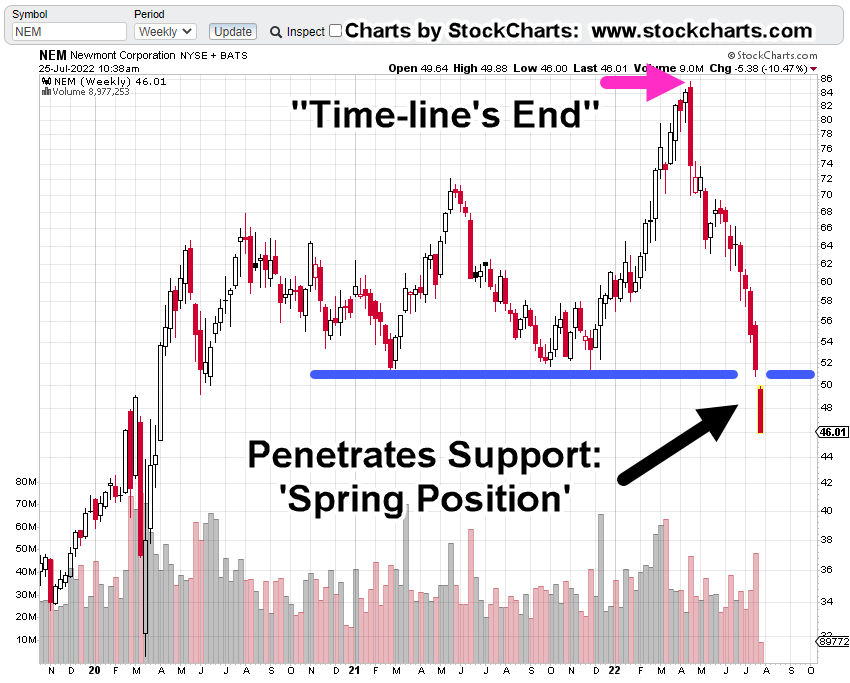
Newmont Mining (NEM) Weekly
The chart below has current conditions for Newmont.
Also shown is the location of the first post linked above, released before Newmont began its decline.
At this juncture, NEM has penetrated long established support; technically it’s in ‘spring position’.
The expectation is for some kind of (weak) rally attempt. We’ll see if it’s able to get back above support.
Note: Posts on this site are for education purposes only. They provide one firm’s insight on the markets. Not investment advice. See additional disclaimer here.
Wyckoff and Fibonacci analysis allowed the reversal of gold miners GDXJ, to be identified to the week and then, to the day.
A quick review of this post, is the reversal on a weekly basis and this one is a follow-up, showing Fibonacci correlation on a daily basis.
If we want to go way-back, this report, shows the miners were not in a bull market and have not been for some time; for years, actually.
That does not mean there were no trades for upside or downside; there were.
However, from a strategy standpoint, gold miners are not bullish.
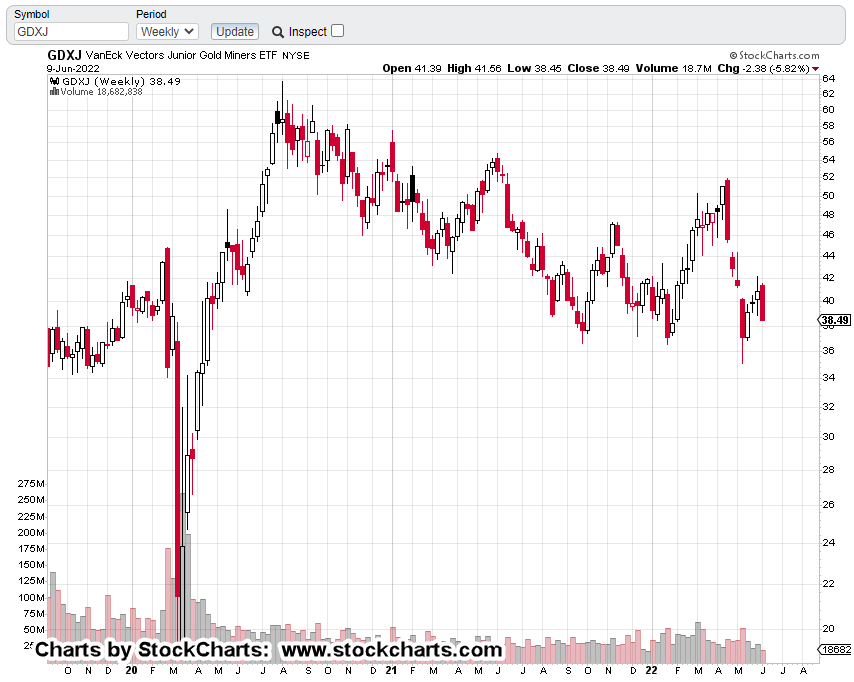
So, let’s look at the Junior Miners GDXJ, as it’s the weakest in the sector.
Junior Miners GDXJ, Weekly Chart
Un-marked
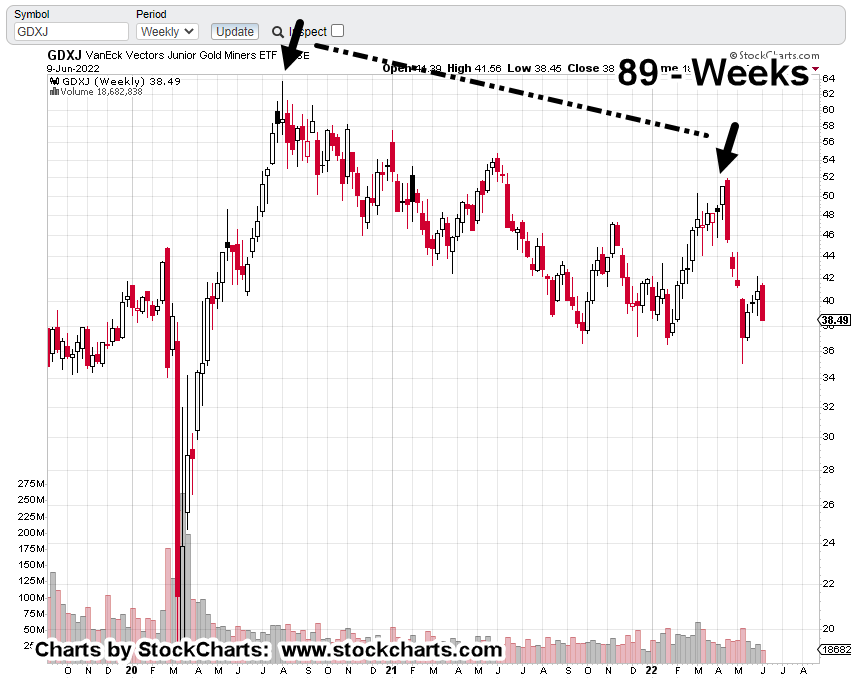
First Mark-up
The reversal is at Fibonacci 89-weeks, plus one day.
However, it’s the next chart that’s more disconcerting for the bulls.
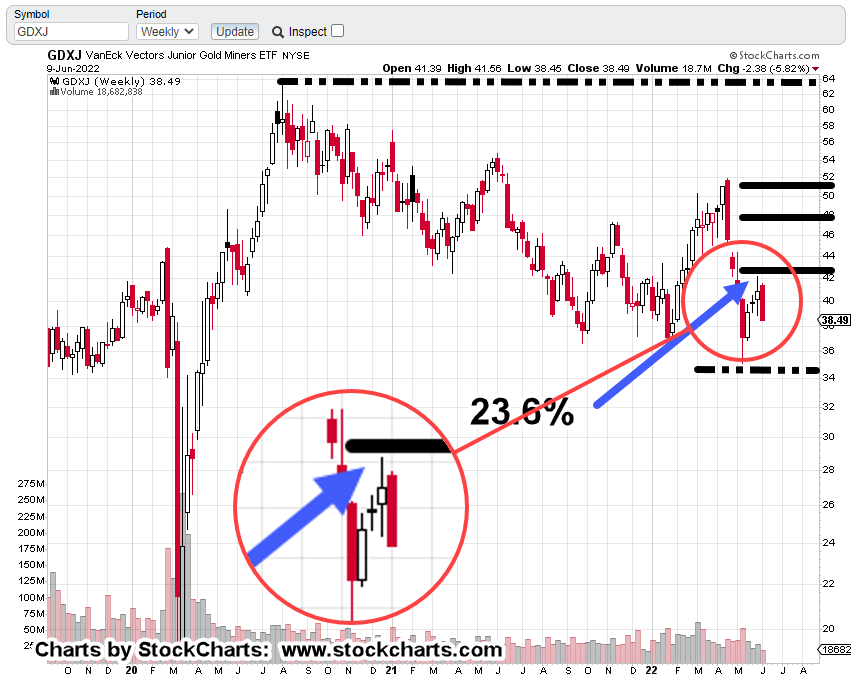
Price action reversed right at a Fibonacci 23.6%, retrace; indicating severe weakness (if it holds).
The two black lines above the 23.6%, are 38.2%, and 50%, respectively.
The next chart zooms into the reversal area.
This week has already posted a new weekly low, providing additional confirmation of the reversal.
As gold, silver and the associated miners reverse lower, we have news reports of precious metals purchases going off the charts.
Where was everybody in 2001, as gold was bottoming?
That’s, 2001 – to – 2022, a Fibonacci, 21-years.
Which brings us to the next point.
The YouTube “Herd”, is Forming
Several YouTube sites that have been monitored for years, have recently blown-up, passing 100,000 subscribers; more than a few are past 200,000 or higher.
Recently, they have started giving each other ‘shout-outs’, to indicate their approval of that particular site’s ‘content’.
Viewer, Beware
By definition, the ‘herd’, does not have the right answer.
Each one is now monitoring what the other one is doing; they are all, influencing themselves.
The only way to have a hope of getting unique insight is to remain aloof. Wyckoff described this exact phenomenon in his autobiography.
He had very wealthy clients that wanted to get closer (unlimited) access to him. To this overture, he refused.
He isolated himself and remained cloistered.
Summary
Thus far, the analysis of gold ‘changing hands‘ remains intact. Gold continues to be well off its highs; silver is not anywhere close.
Strategy, Tactics, and Focus.
The Junior Miner’s reversal can’t be disputed … there it is.
If precious metals and the miners are not responding to all the ‘money printing;’, then something else’s afoot that’s not being revealed to us in the proletariat.
That ‘something’, is probably starvation … which gets us back to Genesis 41; corn and grain come first, then gold and silver (not advice, not a recommendation).
Note: Posts on this site are for education purposes only. They provide one firm’s insight on the markets. Not investment advice. See additional disclaimer here.
It’s a significant, if not major event, when one market participant (collectively) hands off the trading vehicle to another.
In a decline, that usually means the ‘average investor’, the least disciplined, least knowledgeable, gives up and hands off to the professionals; the ‘strong hands’.
In a blow-off top, the reverse is true.
The professionals lead the ignorant along with whatever narrative is necessary so that enough volume is created to successfully exit positions.
The changing of hands for gold and gold miners, was identified on this site, here, here, here, here, here, here, and here, starting over two-and-a-half months ago.
The analysis was consistent throughout; we are not in a long-term, sustainable, bull market. That stance applied most specifically to gold miners GDX, and GDXJ.
For that assessment to change, price action itself would have to change character; not the lagging momentum indicators, moving averages, price oscillators and so on that are themselves, defined by price action.
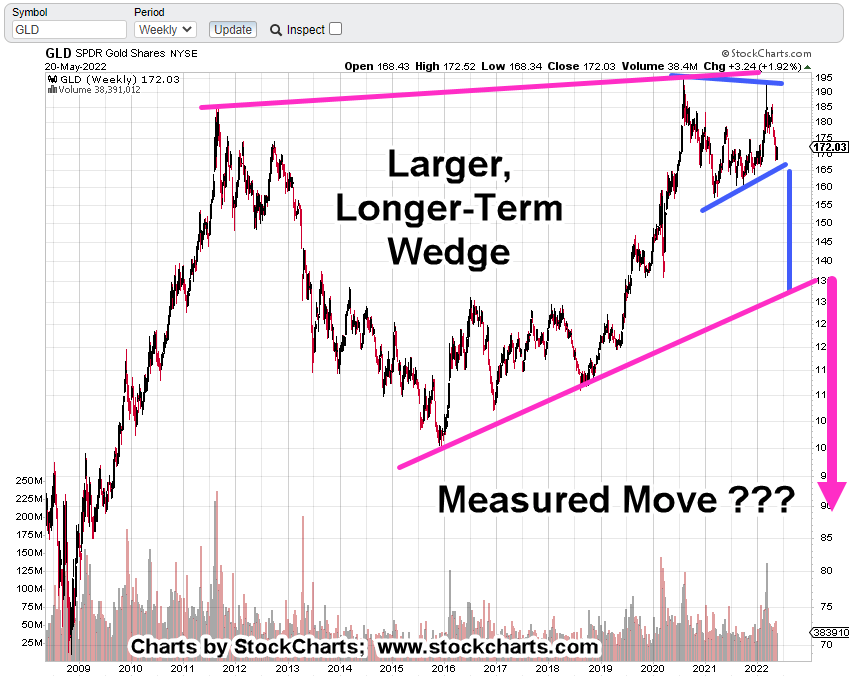
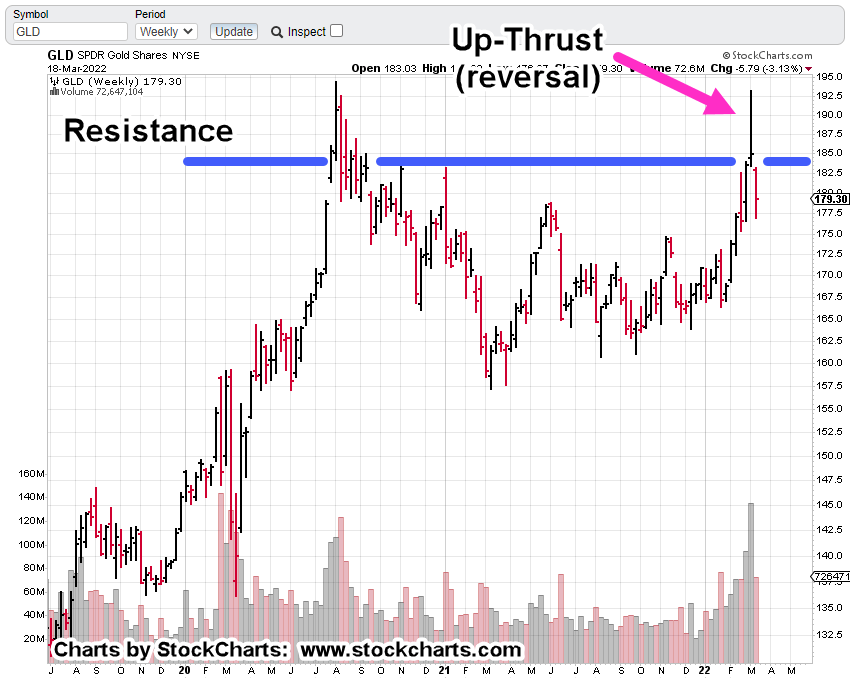
So, let’s take a look at what gold (GLD) is saying about itself.
Gold (GLD), Weekly Chart
First, the un-marked chart.
Next, we see a medium to long term trendline that’s been decisively broken and tested.
Getting closer-in, we can see the oscillation about the line, the break and subsequent test (with reversal).
What’s Next?
Well, that brings us to Harry Dent.
Love him or hate him. Here he is, offering up a perspective that’s not going to be popular.
How can gold (GLD) decline from here?
Let’s take a look.
If the wedge above is in-effect, if it’s the dominant factor at this point, then a break depending on location would take GLD down to about 130-ish.
If that happens, it will be a big event … down to approximately $1,300/oz.
However, it’s what may come next, that will be totally unexpected.
It’s interesting, the wedge in blue has a measured move target right to the bottom of the larger wedge in magenta.
To get below $900/oz, will be a very different place.
With that in mind, this site has presented time and again, we’re in an unprecedented world-event.
‘Normal’ is not coming back … ever.
Awake, or Not
Jerimiah Babe, in one of his latest videos hints there’s a strange vibe to what’s happening: Time stamp 5:20,
‘There’s something going on here …’
The Fed may actually be telling us the truth … just not in the way we expect.
You have to be awake to read between the lines.
Inflation may indeed be ‘transitory’ as they say because consumer demand is going to evaporate.
Evaporate not because the consumer can’t afford it, but because there are, or will be, no consumers.
Note: Posts on this site are for education purposes only. They provide one firm’s insight on the markets. Not investment advice. See additional disclaimer here.
Note: Posts on this site are for education purposes only. They provide one firm’s insight on the markets. Not investment advice. See additional disclaimer here.
The previous bearish analysis was overwhelmed by the larger, upward trend.
Instead of continuing lower, real estate IYR, moved higher. It’s now at another inflection point.
The position in DRV (DRV-22-01) was exited at 32.66, when it was obvious the trade was going to fail.
Taking a hit like that gets one’s attention; there must be something else going on … something on a larger timeframe.
There’s nothing wrong, with being wrong.
However, there is something wrong with being wrong and staying wrong.
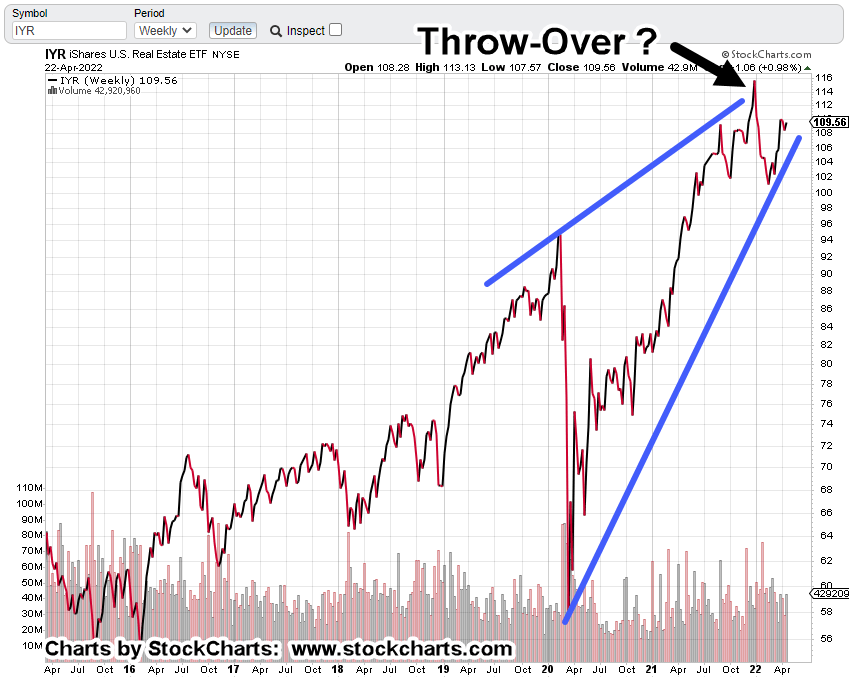
If we pull farther out to the longer, weekly timeframe, it looks like there’s danger ahead; possible new all-time highs and Wyckoff upthrust (potential reversal).
Real Estate IYR, Weekly
As with the Junior Miners, GDXJ, it looks like we have yet another Fibonacci time correlation.
During the financial crisis, IYR, posted its low the week of March 6th, 2009.
Thirteen years later, another major inflection point?
Shown below, is a terminating wedge that may have already completed a throw-over.
One probability suggesting new highs instead of a reversal at this point (which seems like even odds) is the repeating tendency of markets to go from ‘spring to up–thrust‘.
This site has presented over and again, it’s a common market behavior.
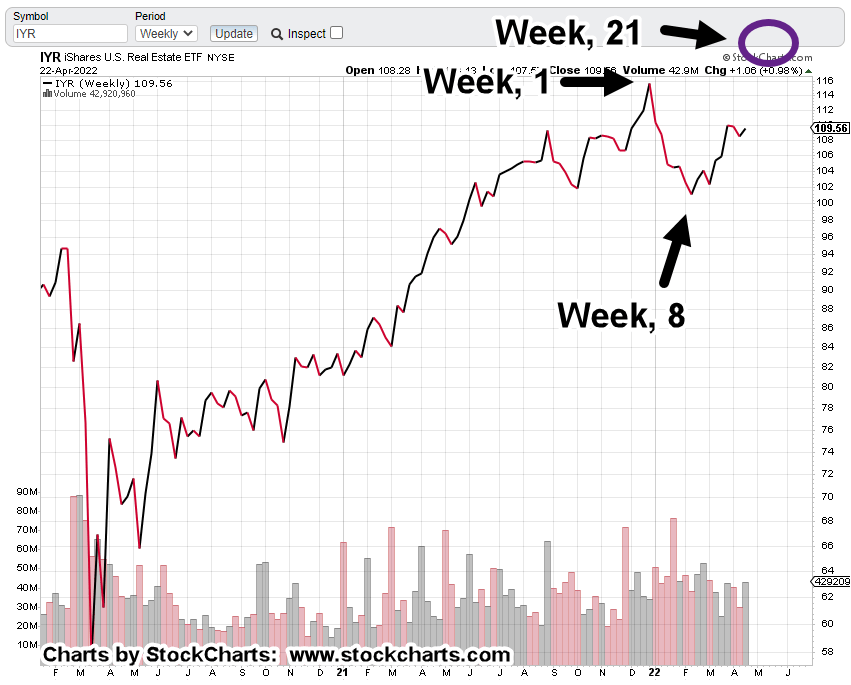
Getting closer-in on the weekly, the spring set-up is identified.
Now, comes the Fibonacci time correlation.
From the all-time highs, the market closed at the lows on Week 8. The print low came one week later.
Using that information and projecting forward, if this correlation is in effect, if it’s valid, we can expect an up-thrust high somewhere during the week of May 20th, to May 27th.
Note: Posts on this site are for education purposes only. They provide one firm’s insight on the markets. Not investment advice. See additional disclaimer here.
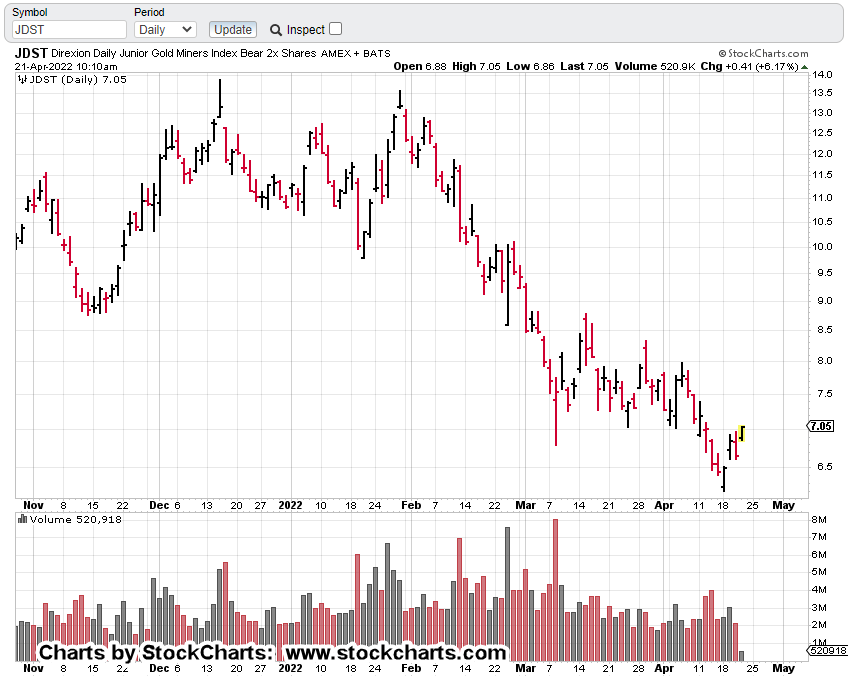
Every market has its own personality, its own characteristics.
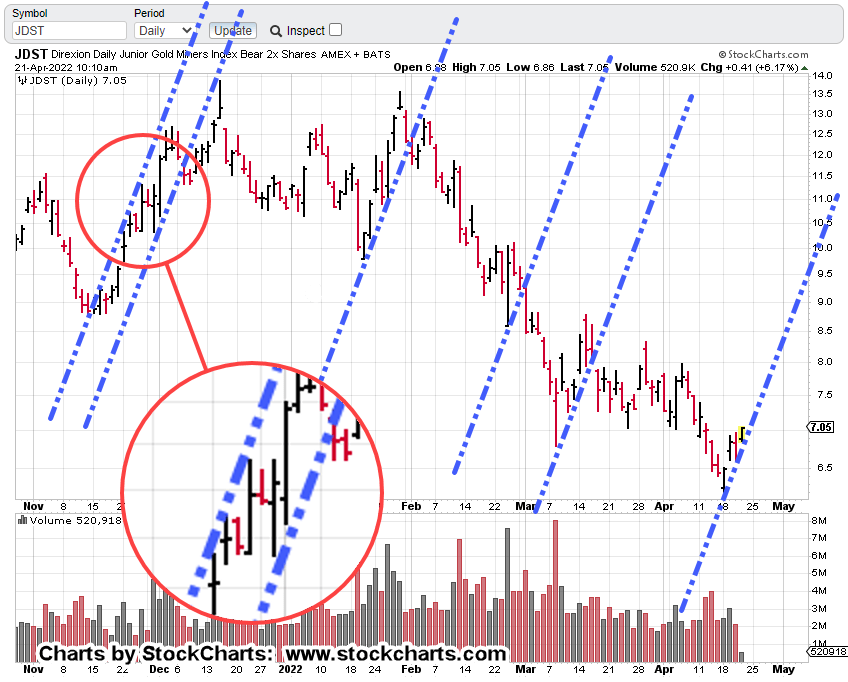
After working the gold mining indices GDX, more specifically GDXJ, a repeating trendline tendency was observed in leveraged inverse, JDST.
That repeating market behavior, shown below.
Junior Miners, Leveraged Inverse, JDST
The un-marked daily chart, first
Repeating trendlines
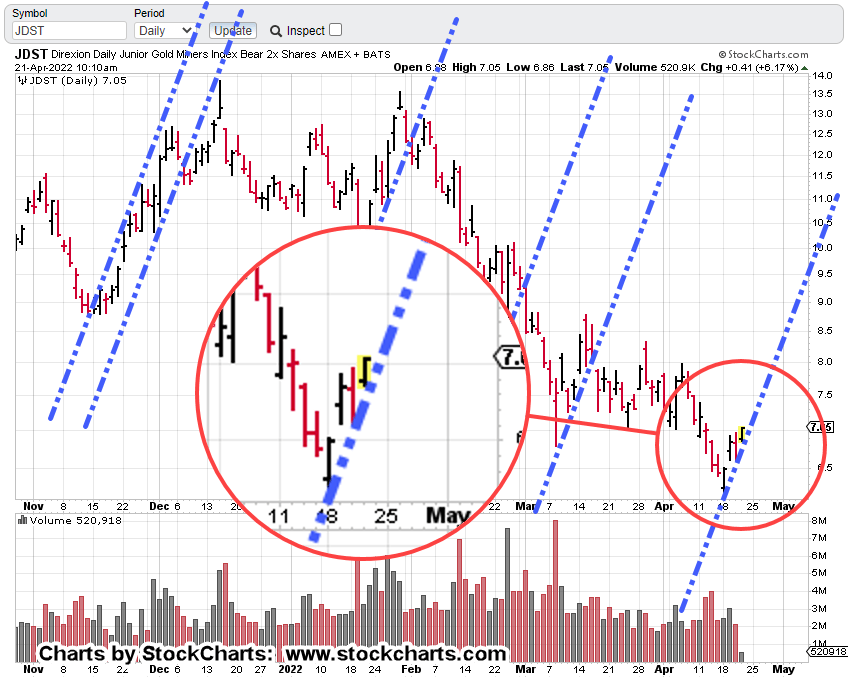
The next several charts zoom-in on specific areas.
Set The Stop
And walk away …
As the tagline in this post shows with JDST-22-04, we’re already short the Junior Miners via JDST (not advice, not a recommendation).
The current stop, is set at yesterday’s low of 6.61.
Depending on price action today, that stop will be moved up to the recent low (presently @ JDST 6.855).
Summary
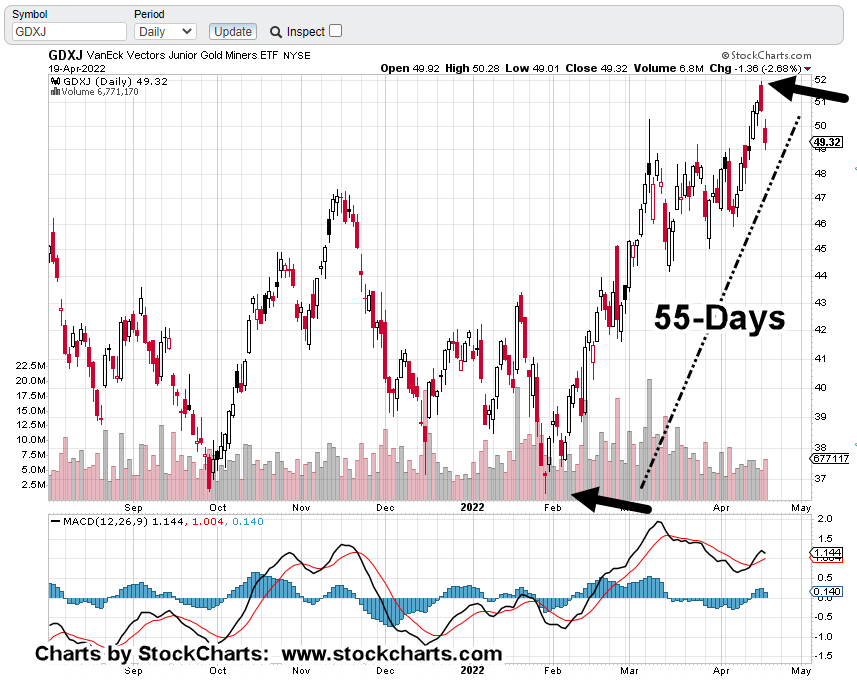
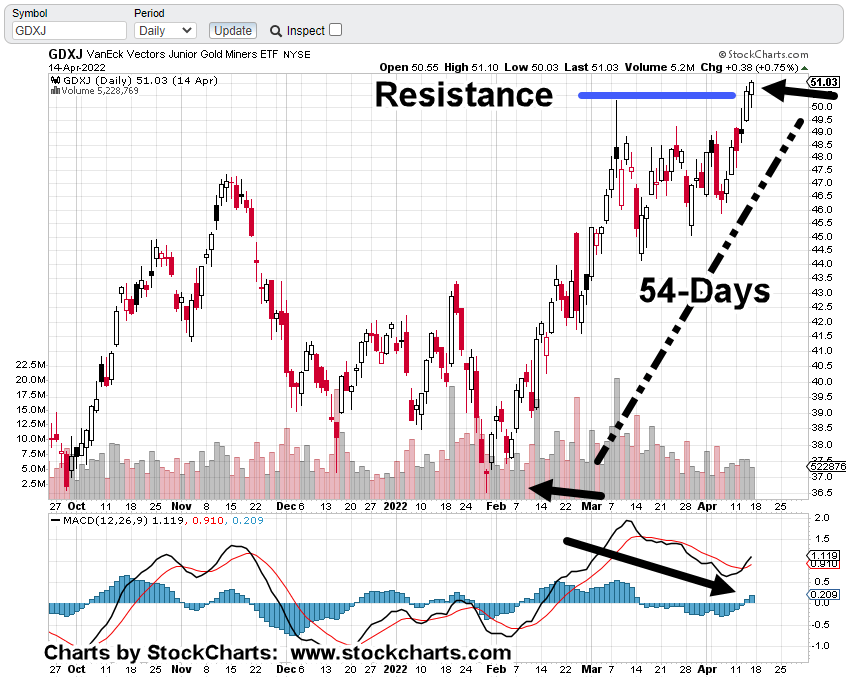
GDXJ, reversed at Fibonacci 55-Days, 13-Weeks from the January 28th, low.
As presented in this update, we’re also Fibonacci 89-Weeks (+1), peak-to-peak.
Time correlation coupled with price action, along with incessant financial press ‘gold standard‘ narrative, gives a near perfect backdrop for a significant downside reversal.
The trade may or may not work out … price action is the final arbiter. However, we’ve already shown the trend characteristic of the market.
A simple but effective way to manage the trade is to follow that trend, raise the stop accordingly and exit when stopped out (not advice, not a recommendation).
Note: Posts on this site are for education purposes only. They provide one firm’s insight on the markets. Not investment advice. See additional disclaimer here.
The last update on the subject highlighted a multi-decade Fibonacci time correlation.
Going all the way back to the 2001 lows for gold, there’s a correlation of 21-years, 89-weeks and 55-days as it relates to the Junior Mining Index, GDXJ.
This past Monday, 55-Days from the January 28th, low, GDXJ, posted a reversal.
The chart below, is an updated version of the one presented on Thursday, the 14th.
Junior Miners, GDXJ, Daily
The bearish MACD has completed with a momentum tick to the downside. Price action reversed exactly at Fibonacci 55-Days.
Getting closer-in, the chart below shows we’re at minor support.
It’s early in today’s session about an hour after the open.
Price action’s already pushing down on the support level, posting a new daily low.
If GDXJ continues lower and decisively penetrates support, the expectation is for some kind of upward test in the next session(s).
For the Junior Gold Miners, GDXJ, we’re at the danger point.
Obvious stop levels for a short position would be yesterday’s high or Monday’s high (not advice not a recommendation).
Summary
With so many convinced gold and the miners must move higher as a result of ‘inflation’, a significant, sustained reversal would be completely unexpected.
Of course, what’s not being discussed (except in alternate media) is the intentional destruction of the food supply and the supply chain.
That’s at least a significant contributor to the rising prices.
Note: Posts on this site are for education purposes only. They provide one firm’s insight on the markets. Not investment advice. See additional disclaimer here.
The laws enacted by the Government to prevent the crash of 1929, were passed in 1934.
So, now we have at least two states (here and here) eliminating sales tax on the purchase of gold and silver.
Where were they way back in 2001, as the metals were bottoming?
Interestingly (then again, not) it’s a Fibonacci 21-years, nearly to the day, from that 2001 bottom.
That’s not the only Fibonacci correlation being observed.
Let’s take a look at Junior Miners GDXJ, and see if it too, has a Fibonacci event.
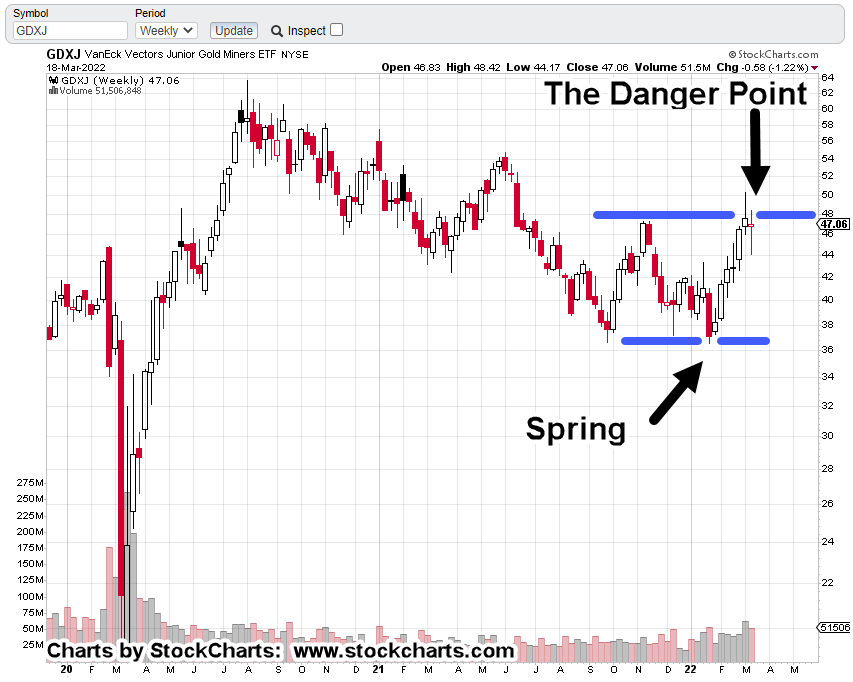
Junior Miners GDXJ, Weekly
We’re just one week short of Fibonacci 13-Weeks, from the late January 2022, bottom.
One extra week is well within margin of error when considering the 89-Week timeframe as shown.
But wait, there’s more.
Looking at the daily chart, not only is there a bearish MACD divergence, we’re also just one day shy before it’s a Fibonacci 55-Days, from the 1/28/22, bottom.
Junior Miners, GDXJ, Daily
Can it all line up this perfectly?
Well, it can if no one is watching; that’s where the crowd and the government come in.
Summary
It’s a fairly safe assessment, nobody expects a downside reversal … nobody.
Even though time and again, we have clues that opportunity for precious metals may come later not sooner (not advice, not a recommendation).
The lockdowns in Shanghai with subsequent starvation and bartering (here and here), show under such conditions, precious metals are nowhere on the list.
Closer to home, the Texas Freeze of 2021, exposed that (lack of metals demand) as well.
Housing prices are starting to ease-off as well as prices for used cars.
Gold (GLD) may have reached its peak, March 8th, this year. Let’s see what happens next.
Note: Posts on this site are for education purposes only. They provide one firm’s insight on the markets. Not investment advice. See additional disclaimer here.
All it might take, is one major ‘Carrington Event‘, Coronal Mass Ejection to rip the mask off Crypto; just as this link has done with the truth of ‘The Speck’ protection.
From a predictive programming standpoint, it’s interesting the typical symbol for crypto, the most popular ‘Bitcoin’, is colored gold.
Which brings us to the actual chart of gold (GLD).
Gold (GLD) Weekly
From a Wyckoff, tape-reading approach, we have to trust what the chart is telling us.
That is, gold has reversed.
Earlier posts on gold and the miners have effectively stated, there’s no more ‘fear’ to be had save an outright nuclear detonation.
If that happens, it’s doubtful that anyone will be running to the gold market for protection.
Does everyone have Potassium Iodide tablets? If there’s an ‘event’, they’ll be worth their weight in gold (literally).
The Noose Tightens
Constriction, elimination of the food supply (along with everything else) continues and is accelerating.
Fortunately, or unfortunately depending on perspective, we’re watching a potential major opportunity unfold.
That is, the opportunity to acquire hard precious assets when (nearly) everyone else liquidates.
Gold to Crypto
Is that even possible?
Would gold (and miners) be sold off to buy Crypto?
According to Kyle Bass in the link above, it’s already happening and has been for a while.
From a ‘beast system’ standpoint, it makes perfect sense, going from the pure (i.e., gold) to man-made, corrupt.
Note: Posts on this site are for education purposes only. They provide one firm’s insight on the markets. Not investment advice. See additional disclaimer here.
Gold (GLD) is hovering near all-time highs but the miners, especially the Juniors GDXJ, are far below.
What better way to show the disconnect than looking at the weekly close charts for both gold (GLD), and GDXJ.
GLD & GDXJ, Combined, Weekly Close
The next chart has been discussed in prior updates but is repeated here for refrence.
The difference is GDXJ’s, now in up-thrust (potential reversal) position.
Junior Miners GDXJ, Weekly Close
Closer in on the weekly candle chart, we have the following repeating pattern, ‘Spring to Up-Thrust‘:
We’re at the danger point where it won’t take much to see if action is to continue higher or reverse.
The case for reversal is shown on the daily below.
Note the energy of the upward thrusts Force Index, is dissipating (black arrow) while the energy on the downward thrusts is increasing.
GDXJ, Daily with Force Index
Summary:
The Junior Miners are not in a bull market and have not been for years.
They never fully recovered after gold’s decline during the 2012 – 2015, timeframe. In the meantime, they may have posted an ‘a-b-c’ corrective (bearish) price action.
Obviously, there have been upward spasms as has just occurred over the past six-weeks.
Now, it appears we’re at the juncture where action has set probabilities to favor a downside reversal (not advice, not a recommendation).
Note: Posts on this site are for education purposes only. They provide one firm’s insight on the markets. Not investment advice. See additional disclaimer here.